
Warehouse environments are fast-paced. Forklifts move constantly. Teams lift heavy materials. Shipments arrive under strict deadlines. In such conditions, even a small safety gap can turn into a serious incident.
Yet many warehouses still depend on scattered spreadsheets and manual reports. As a result, safety managers struggle to monitor incidents properly. They cannot compare targets with actual results. Moreover, identifying patterns becomes difficult.
The solution?
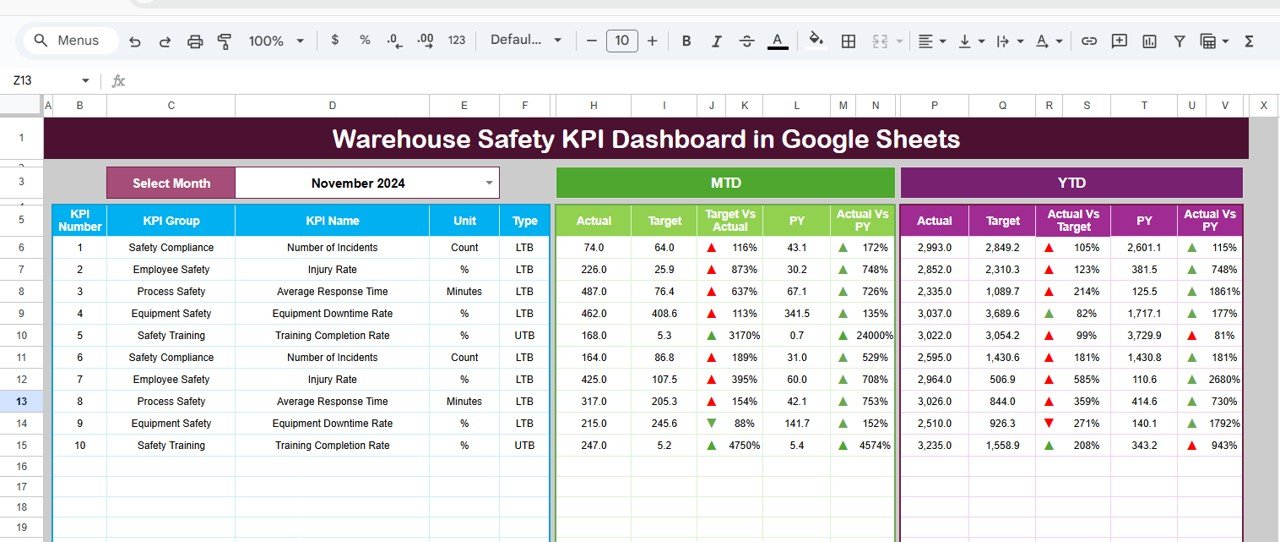
The Warehouse Safety KPI Dashboard in Google Sheets — a ready-to-use, structured safety monitoring system that centralizes your safety metrics in one powerful online dashboard.
This dashboard helps you track safety KPIs, monitor MTD and YTD performance, compare targets with actual numbers, and evaluate previous year trends — all in one collaborative Google Sheets file.
If safety matters in your warehouse (and it should), this dashboard gives you clarity, control, and confidence.
🚀 Key Feature of Warehouse Safety KPI Dashboard in Google Sheets
This dashboard is professionally structured to simplify safety monitoring.
✅ Dynamic Monthly Selection (Cell D3)
Select the month from a drop-down menu, and the entire dashboard updates automatically.
✅ MTD & YTD Performance Tracking
Track Month-to-Date and Year-to-Date performance side by side.
✅ Actual vs Target Comparison
Instantly view performance gaps with variance calculations.
✅ Previous Year Comparison
Compare current safety performance with last year’s results.
✅ Conditional Formatting Arrows
Up and Down indicators visually highlight performance improvement or decline.
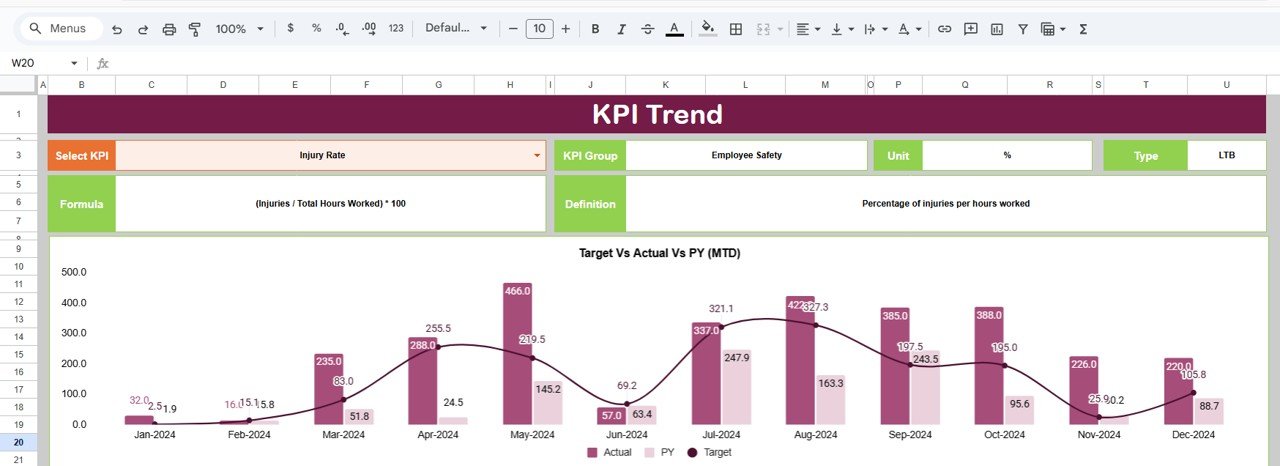
✅ KPI Trend Analysis (Cell C3 Selection)
Select any KPI and view detailed trend charts for Actual, Target, and Previous Year.
✅ Centralized Data Entry Sheets
Separate sheets for Actual Numbers, Targets, and Previous Year data ensure accuracy.
Because Google Sheets works online, teams can collaborate in real time from anywhere.
📊 What’s Inside the Warehouse Safety KPI Dashboard in Google Sheets
This template includes 6 structured worksheets:
1️⃣ Dashboard Sheet – Displays MTD, YTD, Target vs Actual, and Previous Year comparisons.
2️⃣ KPI Trend Sheet – Deep KPI analysis with charts and detailed definitions.
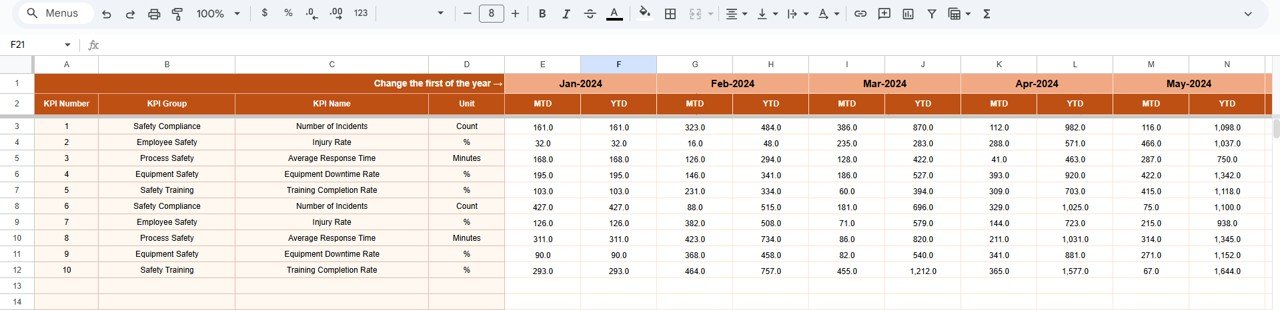
3️⃣ Actual Number Sheet – Enter monthly MTD and YTD actual data.
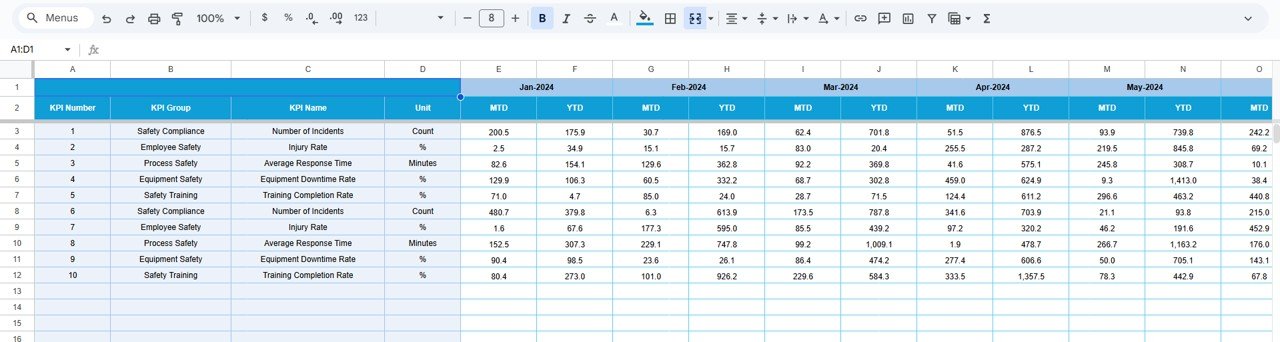
4️⃣ Target Sheet – Set safety performance targets.
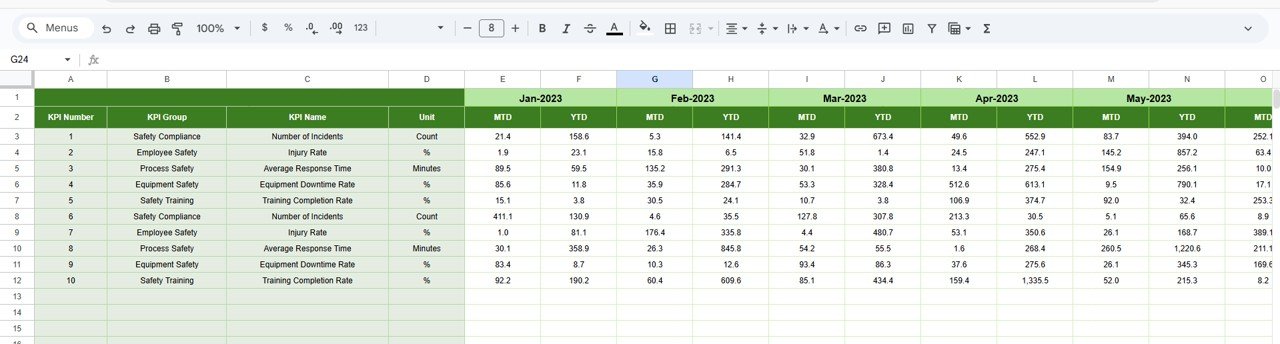
5️⃣ Previous Year Number Sheet – Enter historical data for comparison.
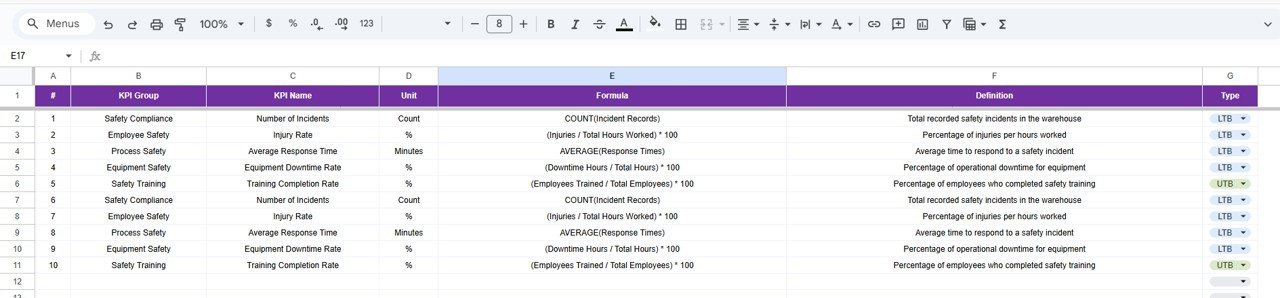
6️⃣ KPI Definition Sheet – Standardized documentation of KPI Name, Group, Unit, Formula, and Definition.
You can track essential warehouse safety KPIs such as:
-
Total Recordable Incident Rate (TRIR)
-
Lost Time Injury Frequency Rate (LTIFR)
-
Near Miss Reports
-
Safety Training Hours
-
Equipment Inspection Compliance Rate
-
Forklift Incident Rate
-
Fire Safety Compliance %
-
PPE Compliance Rate
Each KPI includes unit, formula, and type (Lower the Better / Upper the Better).
Everything is structured for clarity and audit readiness.
⚙️ How to Use the Warehouse Safety KPI Dashboard in Google Sheets
Using the dashboard is simple:
Step 1: Enter monthly Actual data in the Actual Number Sheet.
Step 2: Set MTD and YTD safety targets in the Target Sheet.
Step 3: Input previous year data for historical comparison.
Step 4: Select the desired month from cell D3 in the Dashboard.
Step 5: Analyze trends in the KPI Trend Sheet by selecting KPI in cell C3.
Within minutes, you can:
✔ Identify high-risk areas
✔ Monitor compliance performance
✔ Detect recurring safety issues
✔ Prepare audit-ready reports
No advanced technical skills required — basic Google Sheets knowledge is sufficient.
👷 Who Can Benefit from This Warehouse Safety KPI Dashboard in Google Sheets
This dashboard is ideal for:
✔ Warehouse Managers
✔ Safety Officers
✔ Operations Managers
✔ Compliance Teams
✔ Logistics Supervisors
✔ Manufacturing Units
✔ Distribution Centers
If your goal is to reduce workplace incidents, improve compliance, and strengthen accountability, this dashboard delivers measurable visibility.
Because it is Google Sheets-based, it supports real-time collaboration and remote access — perfect for multi-location warehouses.
By using this dashboard consistently, you can:
✔ Reduce incident rates
✔ Improve safety compliance
✔ Strengthen reporting accuracy
✔ Enhance safety meetings with real data
✔ Build a proactive safety culture
Stop reacting to incidents. Start preventing them.
Click hare to read the Detailed blog post
Watch the step-by-step video tutorial:
Visit our YouTube channel to learn step-by-step video tutorials:
👉 https://www.youtube.com/@NeotechNavigators


