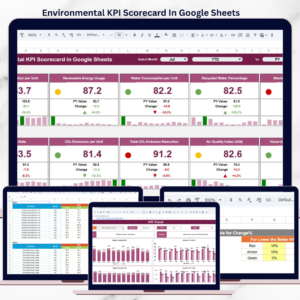
The world of video game creation blends art, technology, and precision — and behind every hit game lies organized data, measurable goals, and tight project tracking. Video Game Development KPI Dashboard in Excel Whether you manage coding, design, QA, or post-launch analytics, success depends on clarity and control.
That’s exactly what the Video Game Development KPI Dashboard in Excel delivers — a ready-to-use, interactive template designed for studios, producers, and managers who want to track every stage of game development with ease.
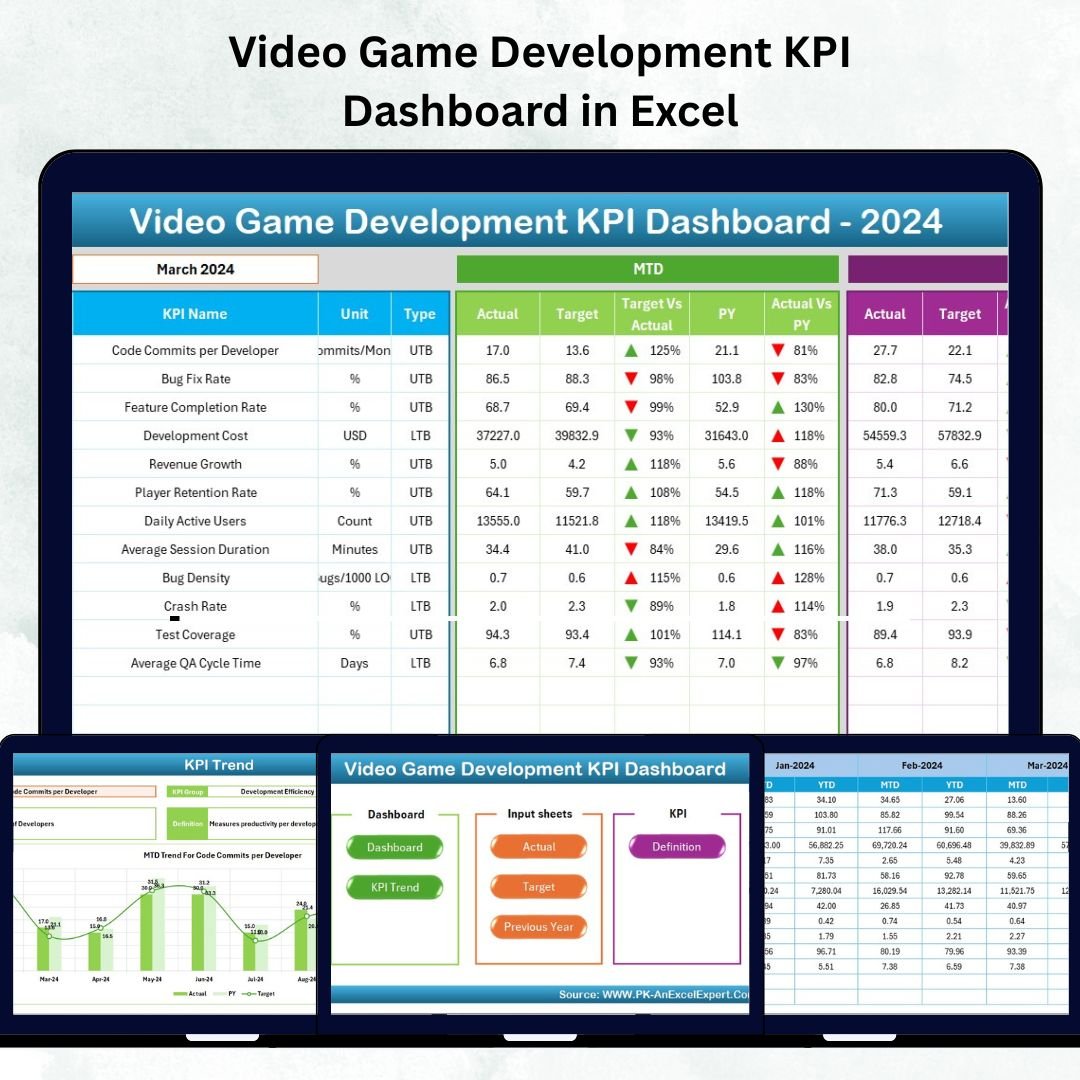
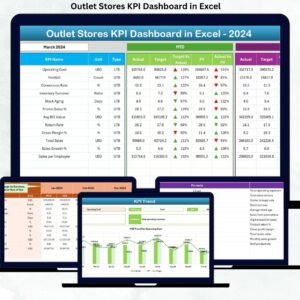
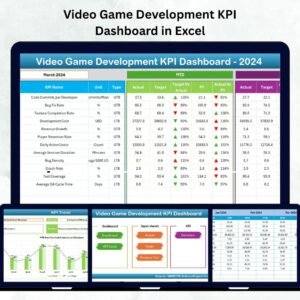
Built entirely in Microsoft Excel, this dashboard consolidates production, financial, and engagement KPIs into one powerful visualization hub. From sprint efficiency to bug-fix rates and player retention, it gives your team the visibility needed to deliver high-quality games — on time and within budget.
⚙️ Key Features of the Video Game Development KPI Dashboard in Excel
🎮 All-in-One Performance Dashboard – Track design, coding, QA, and player metrics from one Excel file.
📅 Month Selector (Cell D3) – Instantly update visuals by choosing a month from the drop-down list.
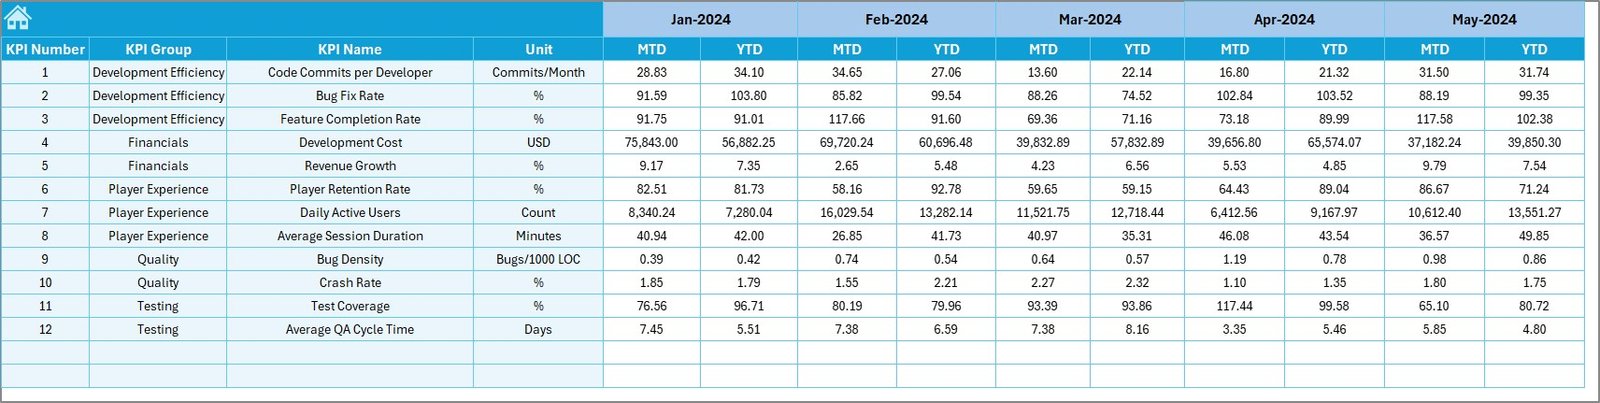
📊 MTD & YTD Views – Analyze Month-to-Date and Year-to-Date performance in one place.
📈 Visual Indicators (▲ / ▼) – See which KPIs are on track or lagging via color-coded arrows.
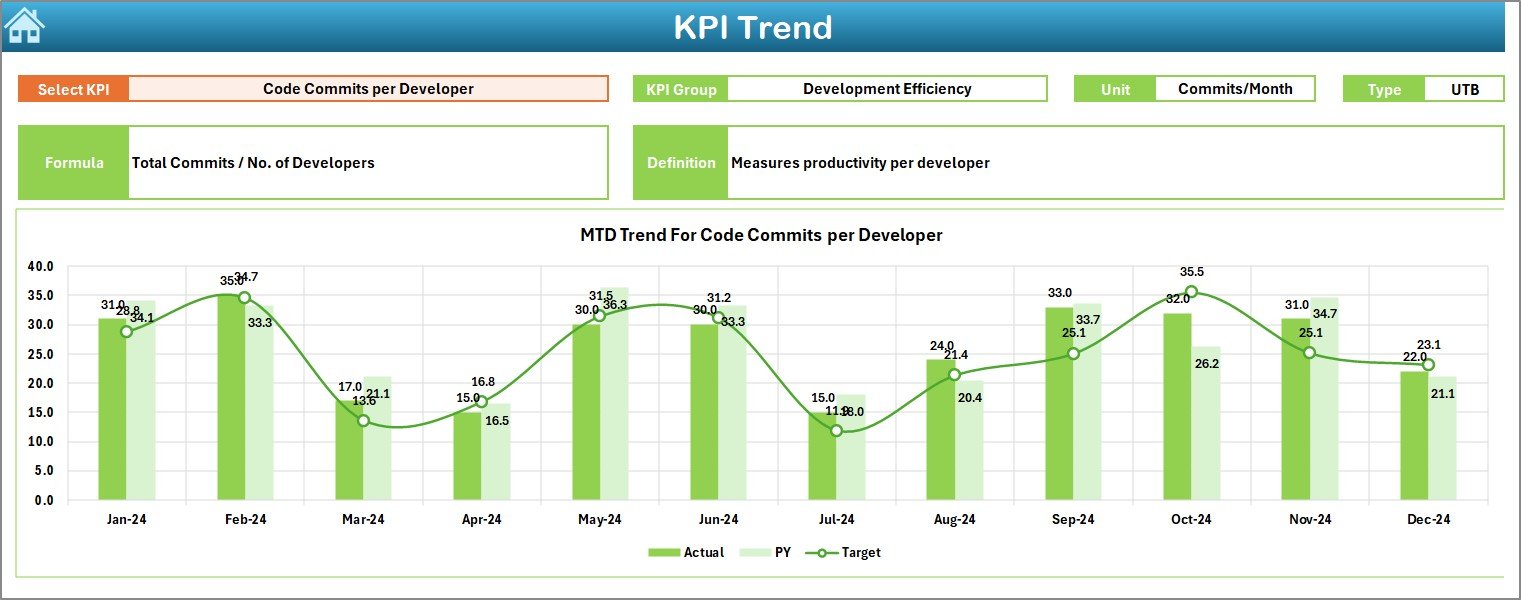
💡 KPI Trend Page – Explore monthly progress and historical patterns using dual combo charts.
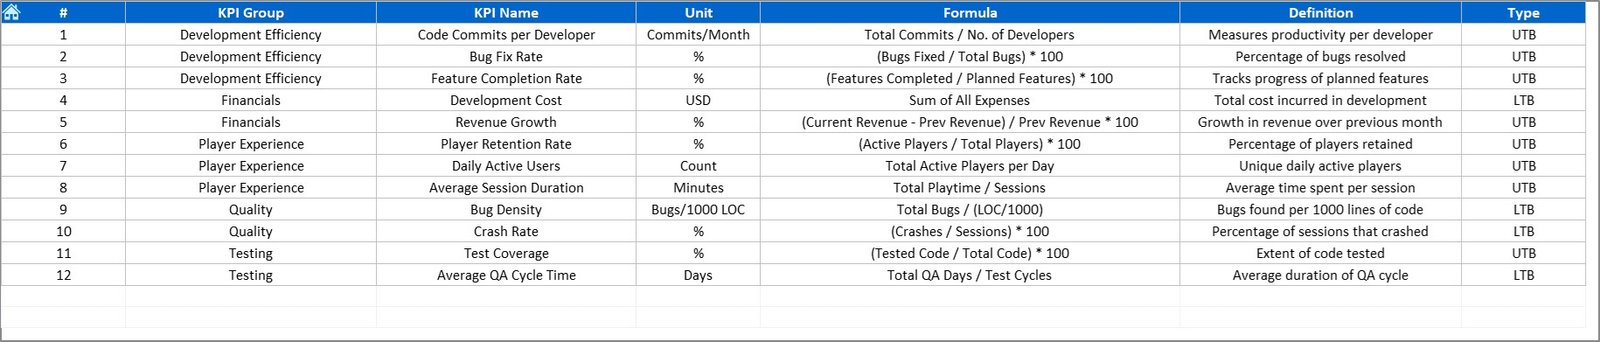
📘 KPI Definition Sheet – Clarifies formula, type (UTB/LTB), and definition for each metric.
🧮 Automatic Calculations – Targets vs Actuals and CY vs PY computed automatically.
🕹️ Customizable KPIs – Add new measures for any production or post-launch area.
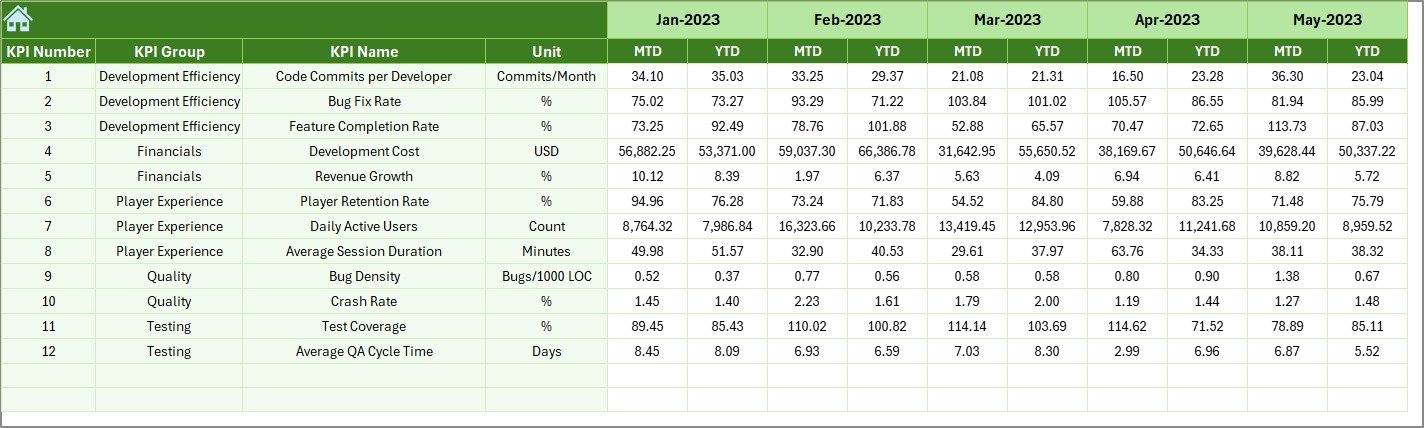
📦 Historical Comparison – Compare current results with previous-year data.
⚙️ No Extra Software Needed – 100% Excel-based; no Power BI or add-ins required.
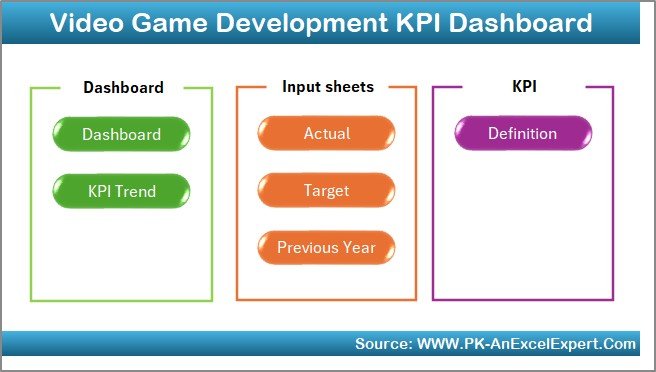
📂 What’s Inside the Dashboard
🏠 1️⃣ Home Sheet – Navigation Hub
Jump quickly between sheets via six interactive buttons. Even non-technical users can navigate effortlessly.
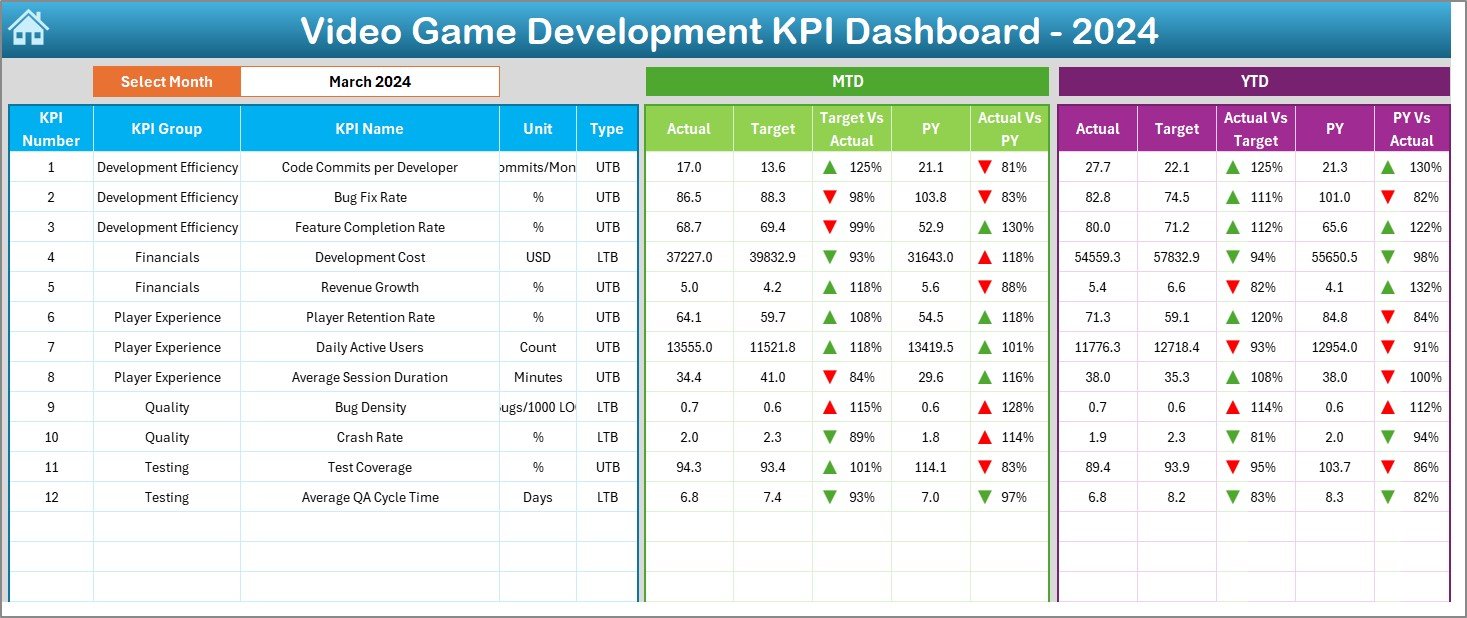
📊 2️⃣ Dashboard Sheet – Main Control Panel
View all KPIs together.
-
Month selector in D3
-
MTD & YTD sections for Actual, Target, and Previous Year
-
Conditional-formatting arrows for instant insight
📈 3️⃣ KPI Trend Sheet – Visualize Progress Over Time
Select a KPI (cell C3) to see MTD and YTD trend charts for Actual vs Target vs PY — perfect for identifying bottlenecks or spikes.
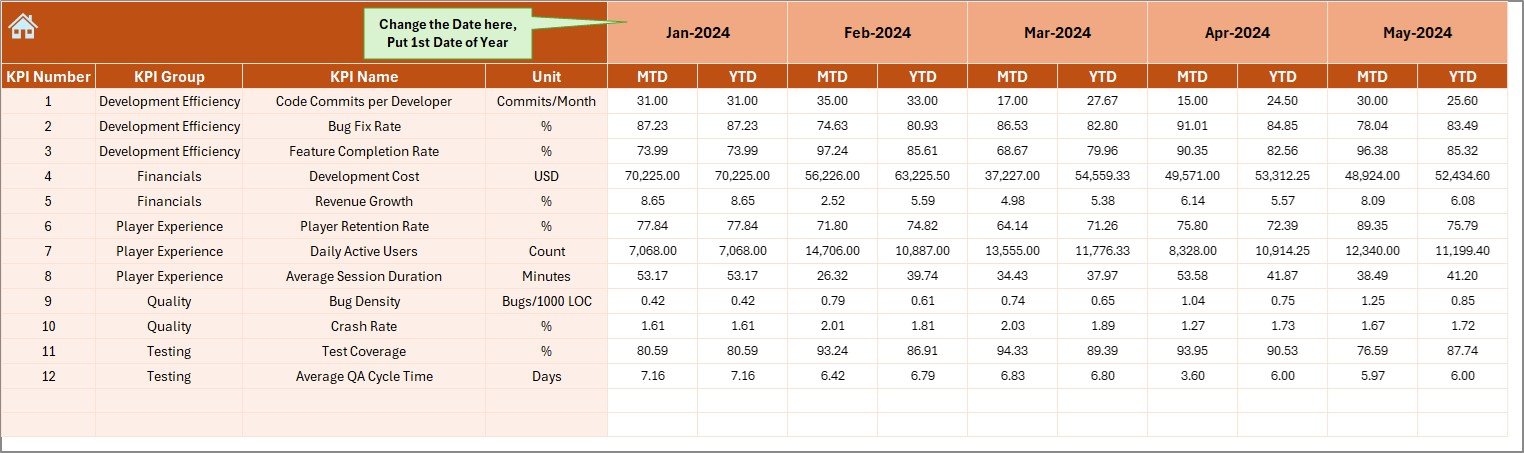
📋 4️⃣ Actual Numbers Input Sheet
Enter real monthly data (MTD/YTD). The dashboard updates automatically.
🎯 5️⃣ Target Sheet
Define monthly and cumulative goals for each KPI — from sprint completion to bug resolution.
🕰️ 6️⃣ Previous Year Sheet
Log last year’s numbers to benchmark progress and improvement.
📘 7️⃣ KPI Definition Sheet
Reference each KPI’s group, formula, and description to maintain consistency across teams.
🧮 Sample KPIs for Game Development Studios
🧑💻 Production
-
Sprint Completion Rate (%)
-
Bug Fix Rate (per month)
-
Feature Implementation Ratio
-
Code Review Efficiency
💰 Finance
-
Development Cost per Hour
-
Revenue per Release
-
Cost Variance (%)
-
Return on Investment (ROI %)
🧪 Quality Assurance
-
Bug Density (per 1,000 LOC)
-
Test Coverage (%)
-
Regression Rate (%)
👥 Team Performance
-
Task Completion Time (hrs)
-
Team Utilization (%)
-
Overtime Hours
⭐ Player Experience
-
Player Retention Rate (%)
-
User Rating (★)
-
Average Session Length (mins)
-
Support Tickets Resolved
All KPIs can be customized to match your studio’s workflow — indie, mobile, or AAA.
🚀 Advantages of Using This Dashboard
✅ Centralized Performance Tracking – View all development KPIs in one file.
✅ Real-Time Visibility – Instantly compare Actual vs Target and Previous Year.
✅ Cost-Effective Analytics – No Power BI license required.
✅ Accountability & Transparency – Historical comparisons foster ownership.
✅ Fully Customizable – Add new metrics or departments anytime.
✅ Informed Decisions – Spot production delays before they escalate.
🧠 Best Practices
📌 Define KPIs with clear formulas and owners.
📌 Update data monthly for accuracy.
📌 Use consistent units across KPIs.
📌 Keep formatting simple — green = good, red = needs attention.
📌 Protect formulas and back up regularly.
📌 Hold monthly reviews using KPI Trend Charts.
👥 Who Can Benefit from This Dashboard
🎮 Game Developers – Track production speed and task completion.
📋 Project Managers – Monitor milestones, costs & deliverables.
💰 Finance Teams – Control budgets and ROI.
🧪 QA Teams – Measure testing coverage and bug fix rates.
🏢 Executives – Get a bird’s-eye view of studio performance.


Reviews
There are no reviews yet.