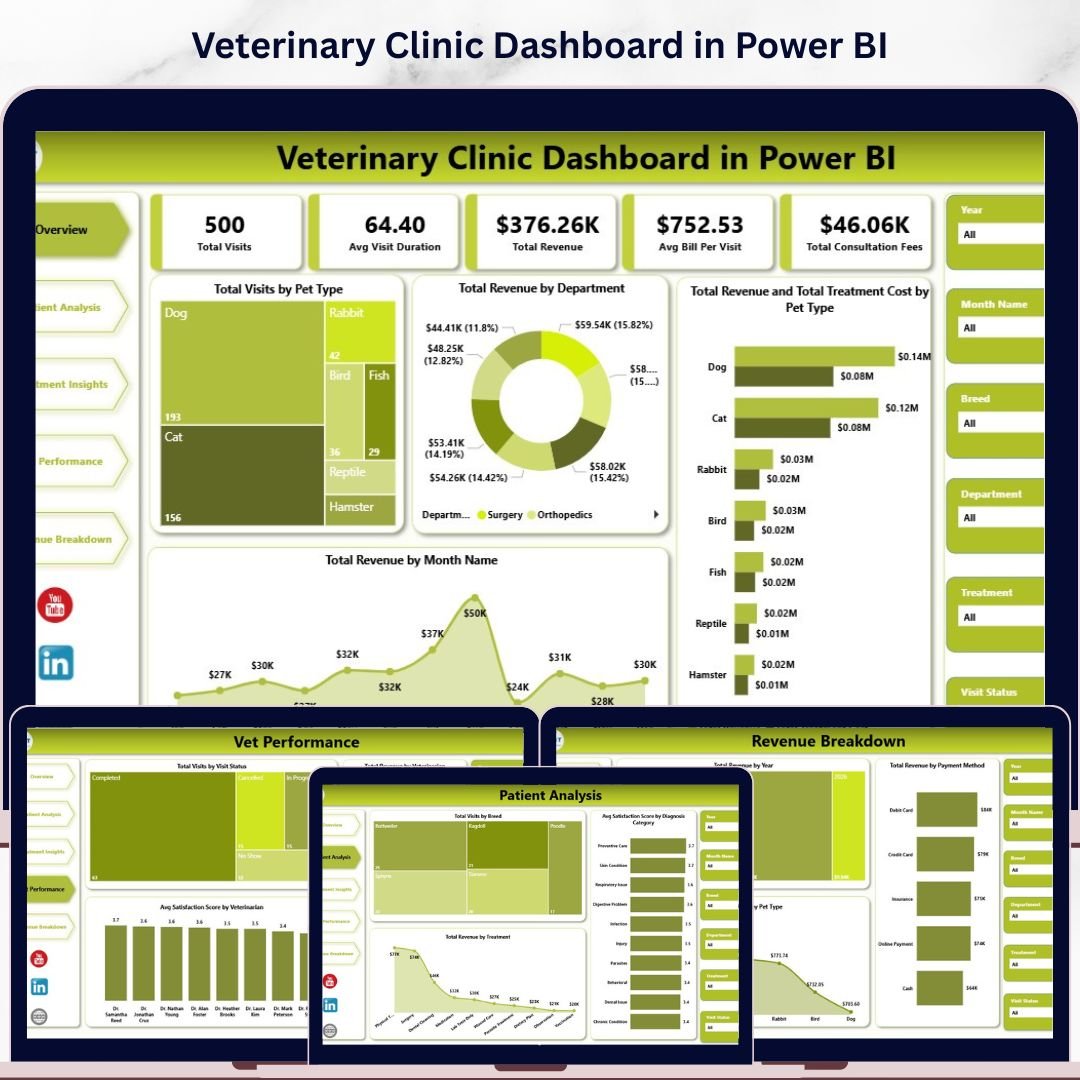
Veterinary Clinic Dashboard in Power BI is a professionally designed, interactive analytics dashboard built for veterinary clinic owners, practice managers, and animal healthcare professionals who want complete visibility into clinic operations, patient trends, treatment patterns, and revenue performance — all inside Microsoft Power BI. This dashboard includes 5 interactive report pages covering every angle of veterinary clinic management from high-level overviews to granular revenue breakdowns.
Whether you manage a small veterinary practice or a multi-location animal hospital, this Power BI dashboard template delivers interactive, drill-down analytics to help you make smarter clinical and business decisions every day.
🔑 Key Features of Veterinary Clinic Dashboard in Power BI
📊 5 Interactive Dashboard Pages — Overview, Patient Analysis, Treatment Insights, Vet Performance, and Revenue Breakdown provide a 360-degree view of your clinic’s operations and finances.
📈 Dynamic DAX-Powered Visuals — All charts and KPI cards are powered by DAX measures, ensuring accurate and real-time calculations across every report page.
🔍 Slicer Filters for Instant Analysis — Use built-in slicers to filter data by month, department, pet type, veterinarian, visit type, and more for quick, targeted insights.
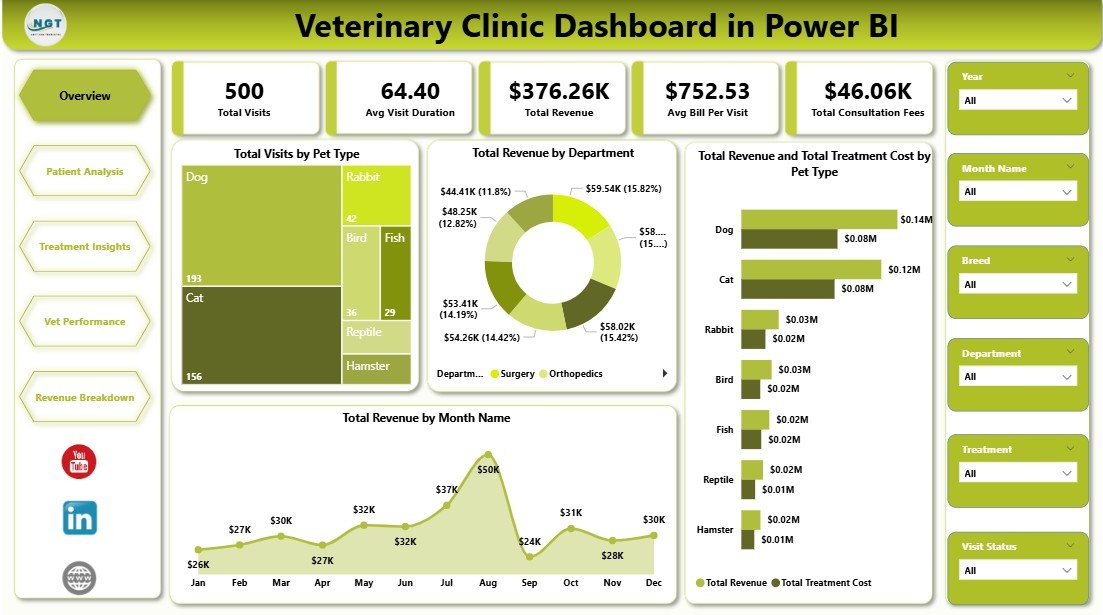
💡 KPI Summary Cards — Track Total Visits, Avg Visit Duration, Total Revenue, Avg Bill Per Visit, and Total Consultation Fees at a glance on the Overview page.
🐾 Patient & Treatment Analytics — Analyze visits by breed, diagnosis category, treatment type, and veterinarian to understand patient flow and treatment effectiveness.
💰 Revenue Intelligence — Break down revenue by payment method, year, department, and pet type to identify top-performing revenue streams and optimize billing.
🩺 Veterinarian Performance Tracking — Compare satisfaction ratings, revenue contribution, and visit status across your veterinary team to identify top performers.
📂 Easy Data Replacement — Simply replace the sample Excel data source with your own clinic records and refresh the report to see your personalized dashboard instantly.
📦 What’s Inside the Veterinary Clinic Dashboard in Power BI
This Power BI template includes 5 professional report pages covering every angle of veterinary clinic analytics:
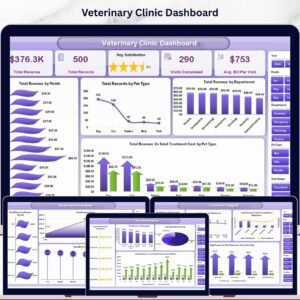
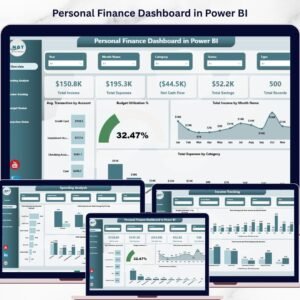
🔹 Overview Page — High-level KPI cards showing Total Visits, Avg Visit Duration, Total Revenue, Avg Bill Per Visit, and Total Consultation Fees. Charts include Total Visits by Pet Type, Total Revenue by Department, Total Revenue and Total Treatment Cost by Pet Type, and Total Revenue by Month Name. Multiple slicers let you filter the entire dashboard instantly.
 Veterinary Clinic Dashboard in Power BI
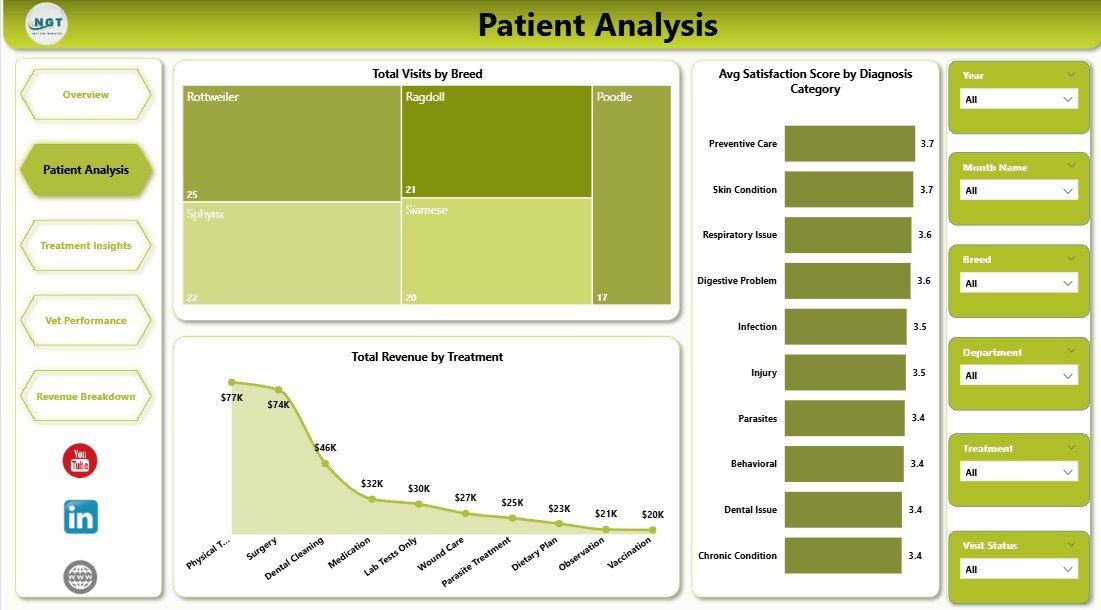
🔹 Patient Analysis Page — Deep dive into patient data with charts for Total Visits by Breed, Avg Satisfaction Score by Diagnosis Category, and Total Revenue by Treatment. This page helps you understand which breeds drive the most visits and which diagnosis categories receive the highest satisfaction ratings.
 Patient Analysis
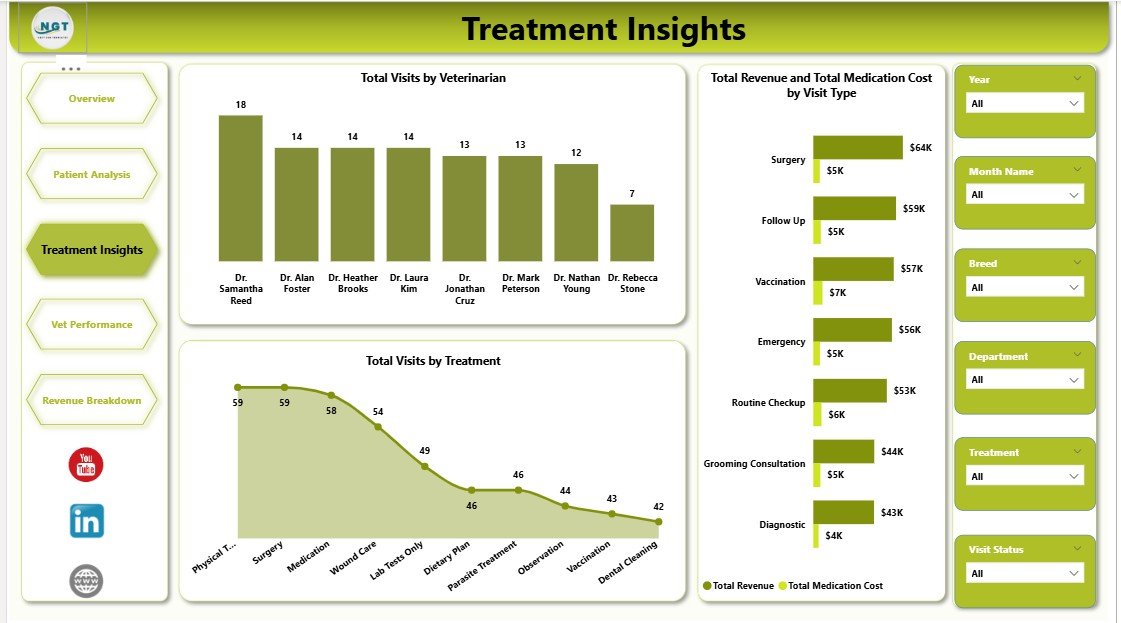
🔹 Treatment Insights Page — Analyze treatment operations with Total Visits by Veterinarian, Total Revenue and Total Medication Cost by Visit Type, and Total Visits by Treatment. Identify which treatments generate the most visits and compare revenue against medication costs.
 Treatment Insights
🔹 Vet Performance Page — Evaluate your veterinary team using Total Visits by Visit Status, Total Revenue by Veterinarian, and Avg Satisfaction Score by Veterinarian. This page gives clinic managers clear data to assess team workload, revenue contributions, and patient satisfaction per vet.
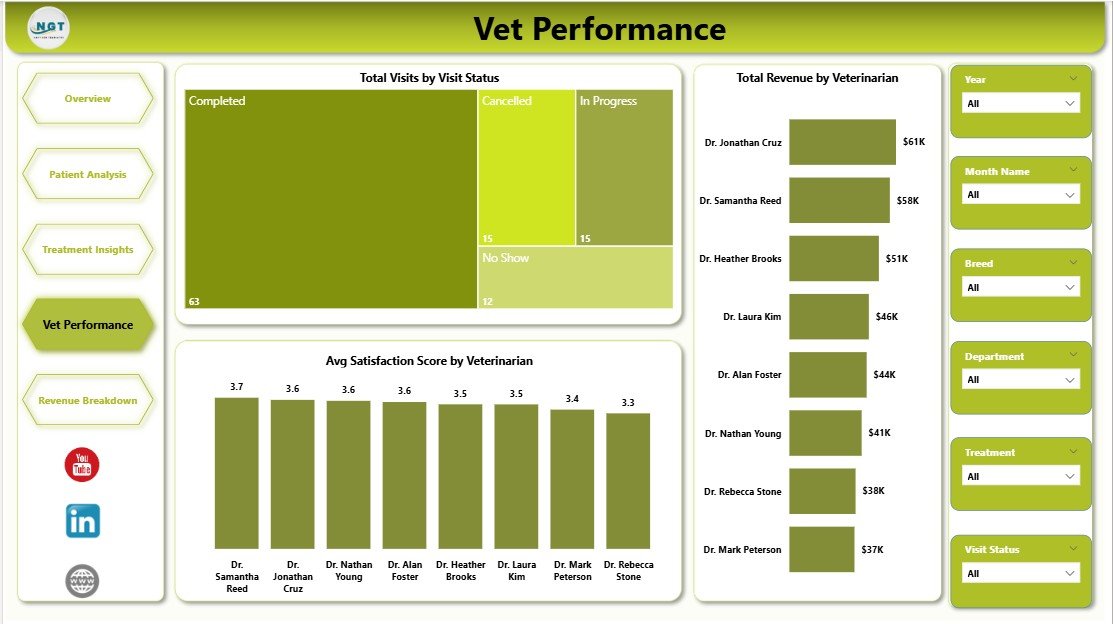 Vet Performance
🔹 Revenue Breakdown Page — Financial analytics with Total Revenue by Year, Avg Bill Per Visit by Pet Type, and Total Revenue by Payment Method. This page helps you track long-term revenue trends and understand which payment methods and pet types contribute the most to your bottom line.
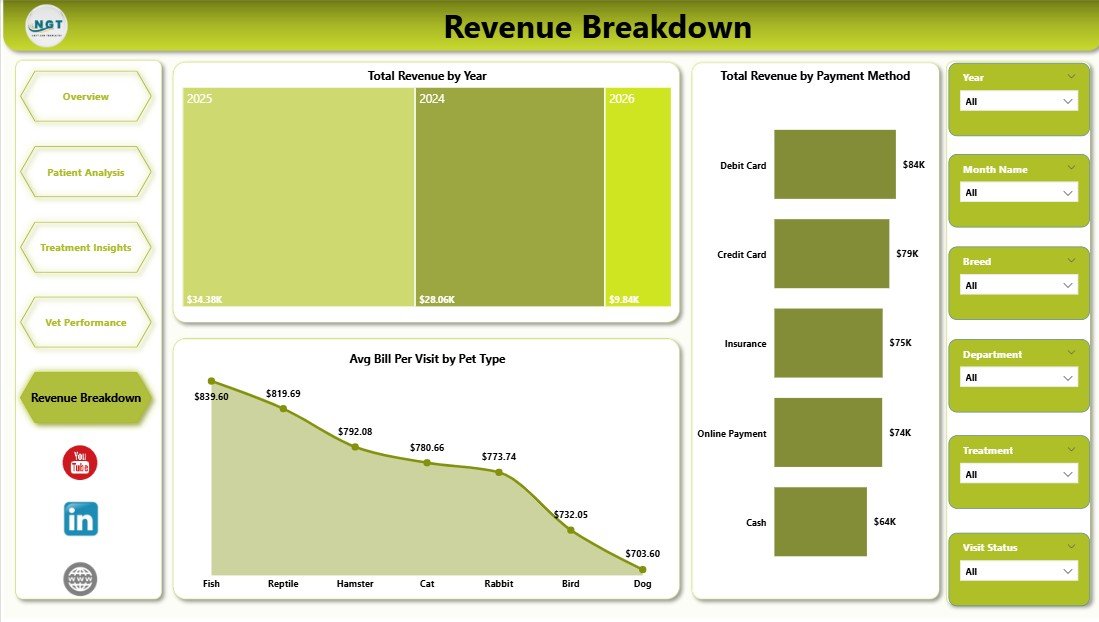 Revenue Breakdown
If you are looking for a KPI-focused scorecard, check out the Veterinary Clinic KPI Scorecard in Excel. For an Excel-based dashboard, we also offer the Veterinary Clinic Dashboard in Excel.
⚙️ How to Use the Veterinary Clinic Dashboard in Power BI
1️⃣ Download and Open — Unzip the downloaded file and open the .pbix file in Power BI Desktop (free from Microsoft).
2️⃣ Review Sample Data — Explore the dashboard with the included sample data to understand the layout, charts, and KPI structure.
3️⃣ Replace Your Data — Update the Excel data source with your own clinic records using the same column format.
4️⃣ Refresh the Report — Click Refresh in Power BI Desktop to update all visuals, KPI cards, and charts automatically.
5️⃣ Apply Filters — Use the slicers on each page to filter by month, pet type, department, veterinarian, or visit type for targeted analysis.
👥 Who Can Benefit from This Veterinary Clinic Dashboard in Power BI
🐶 Veterinary Clinic Owners and Practice Managers tracking overall clinic performance and profitability.
🩺 Veterinarians monitoring patient outcomes, treatment patterns, and satisfaction scores across their practice.
💼 Clinic Administrators managing operational workflows, appointment data, and billing analytics.
📊 Business Analysts in healthcare and medical services looking for ready-to-use Power BI analytics tools.
🐾 Animal Hospital Chains comparing performance across multiple locations and veterinary teams.
❓ Frequently Asked Questions
What metrics does the Veterinary Clinic Dashboard in Power BI track?
The Veterinary Clinic Dashboard in Power BI tracks Total Visits, Avg Visit Duration, Total Revenue, Avg Bill Per Visit, and Total Consultation Fees across 5 interactive pages covering patient analysis, treatment insights, vet performance, and revenue breakdown.
Do I need advanced Power BI skills to use this dashboard?
No. Simply replace the sample Excel data source with your own records and click Refresh in Power BI Desktop. All charts and KPI cards update automatically — no DAX coding or advanced skills required.
Can I customize the visuals and add my own measures?
Yes. The dashboard uses standard Power BI visuals and DAX measures. You can modify existing measures, add new columns to the data source, and create additional report pages to match your clinic’s specific tracking needs.
How is this different from the Veterinary Services KPI Dashboard in Power BI?
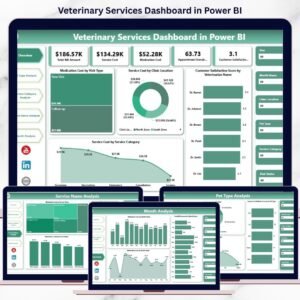
The Veterinary Services KPI Dashboard in Power BI focuses on pre-defined KPI metrics with MTD/YTD target tracking and trend analysis. This Veterinary Clinic Dashboard provides broader operational analytics with 5 analysis pages covering patients, treatments, vet performance, and revenue in detail.
Is there an Excel version of this dashboard?
Yes! Check out the Veterinary Clinic Dashboard in Excel for a pivot-driven Excel alternative with the same 5 analysis pages.
🔗 Explore Related Templates
🔹 Veterinary Clinic Dashboard in Excel — Pivot-driven Excel dashboard with 5 interactive analysis pages and automated charts.
🔹 Veterinary Clinic KPI Scorecard in Excel — Track monthly and yearly KPI targets with color-coded performance indicators.
🔹 Pet Care Services KPI Dashboard in Power BI — Advanced KPI tracking for pet grooming, boarding, and daycare businesses.
📖 Click here to read the Detailed Blog Post
🎥 Visit our YouTube channel to learn step-by-step video tutorials
👉 YouTube.com/@NextGenTemplates


Reviews
There are no reviews yet.