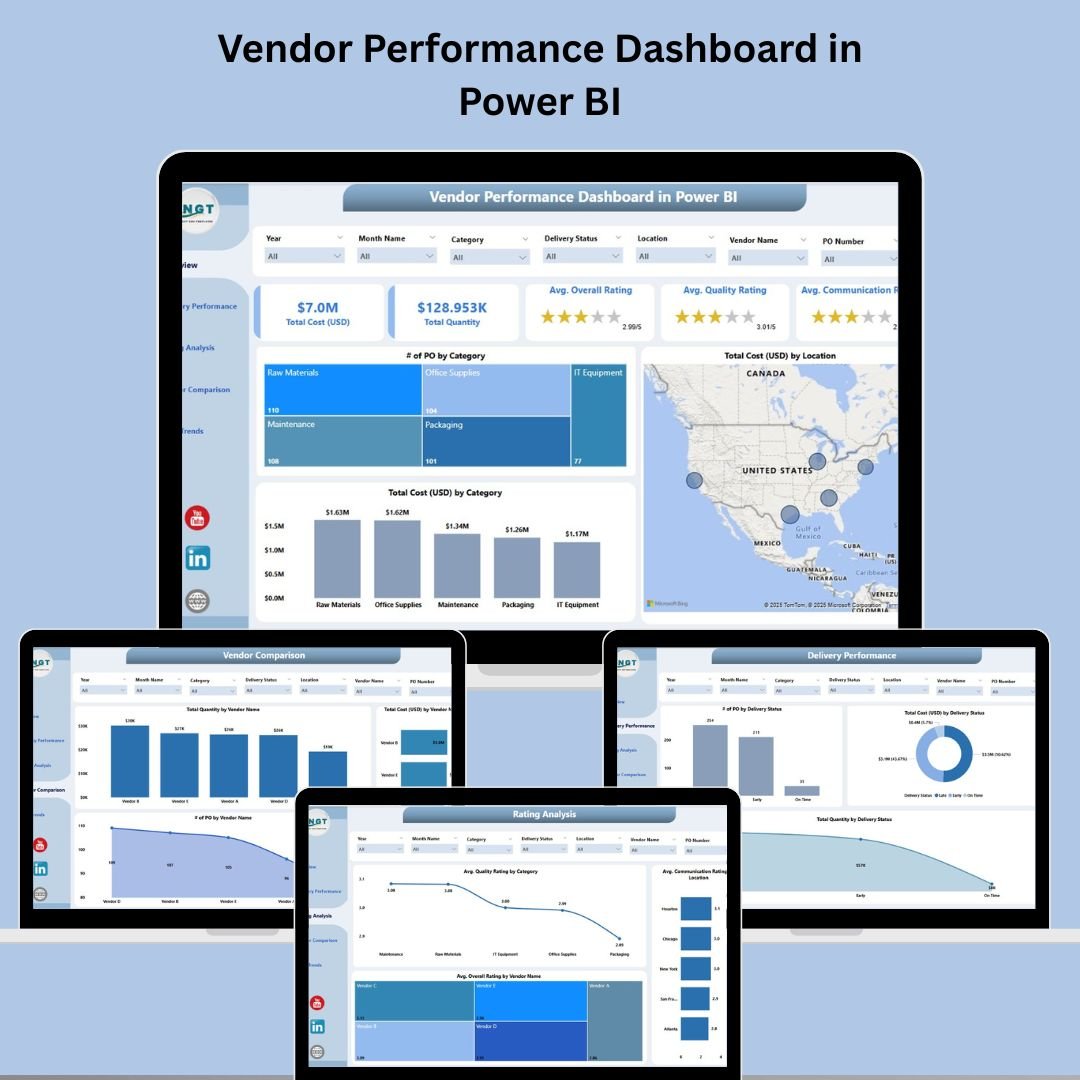
In today’s competitive and fast-paced business environment, managing your vendors is more than a task—it’s a strategic function. That’s where the Vendor Performance Dashboard in Power BI comes in. This powerful, plug-and-play dashboard helps you monitor vendor performance, spot risks, and make smarter procurement decisions—backed by real-time data and stunning visualizations.
No more juggling spreadsheets or manually calculating KPIs. This dashboard centralizes all vendor data in one place—analyzing cost, delivery performance, ratings, and monthly trends across customizable dimensions like vendor name, location, category, and more. Whether you’re working with 10 vendors or 1,000, this dashboard scales to your needs.
✨ Key Features of Vendor Performance Dashboard in Power BI
📊 Real-Time KPIs at a Glance
Track critical vendor KPIs like total cost, quantity ordered, delivery days, and overall rating—all in one place.
🎯 5 Insightful Pages
Get focused insights across five dynamic Power BI pages: Overview, Delivery Performance, Rating Analysis, Vendor Comparison, and Time Trends.
🧮 Smart Slicers for Deep Filtering
Use 7 slicers to filter by vendor, location, category, and delivery status. Drill down into any dimension with a click.
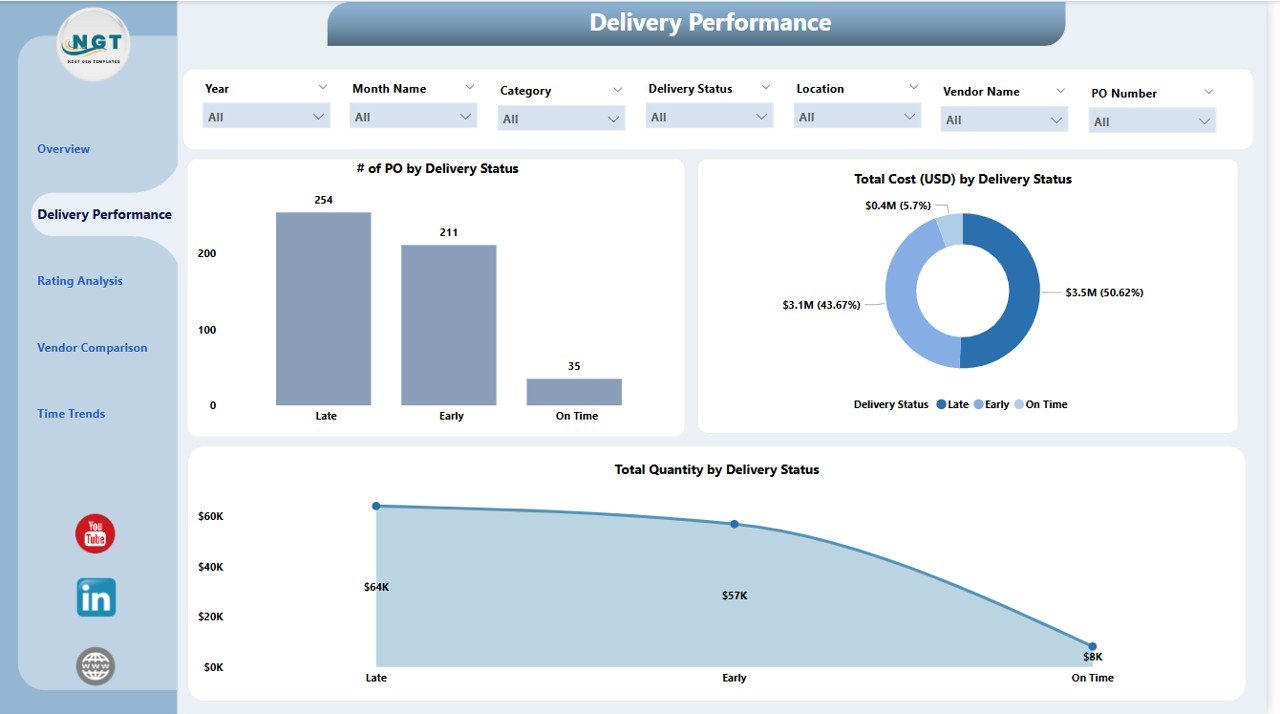
🚚 Delivery Status Breakdown
Spot late deliveries, on-time shipments, and partial fulfillments instantly.
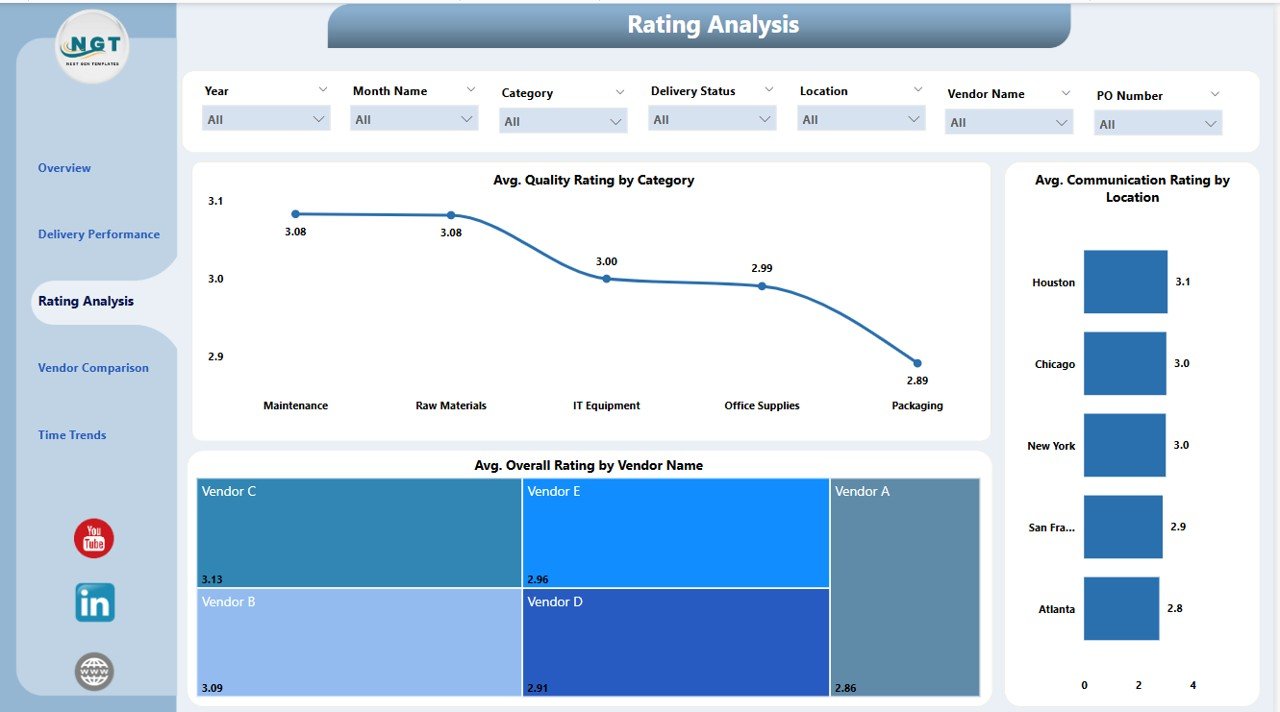
⭐ Vendor Rating Analysis
Compare average ratings for quality, communication, and satisfaction—vendor-wise, category-wise, and by location.
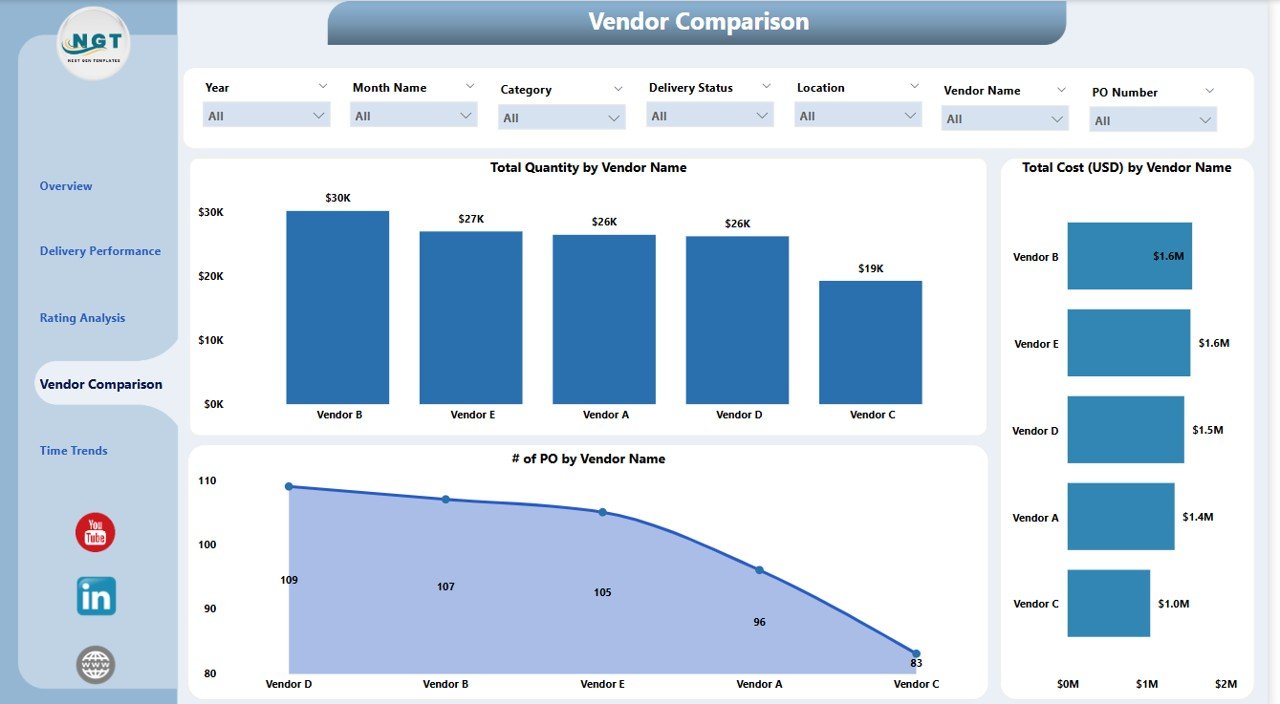
🔄 Side-by-Side Vendor Comparison
Evaluate total quantity, cost, and POs per vendor in one dashboard view. Identify the best and worst performers instantly.
📆 Monthly Trends
Visualize procurement activity over time with charts for monthly POs, cost, and quantities.
📂 What’s Inside the Vendor Performance Dashboard
You’ll get access to five dedicated Power BI pages, each designed to deliver focused insights:
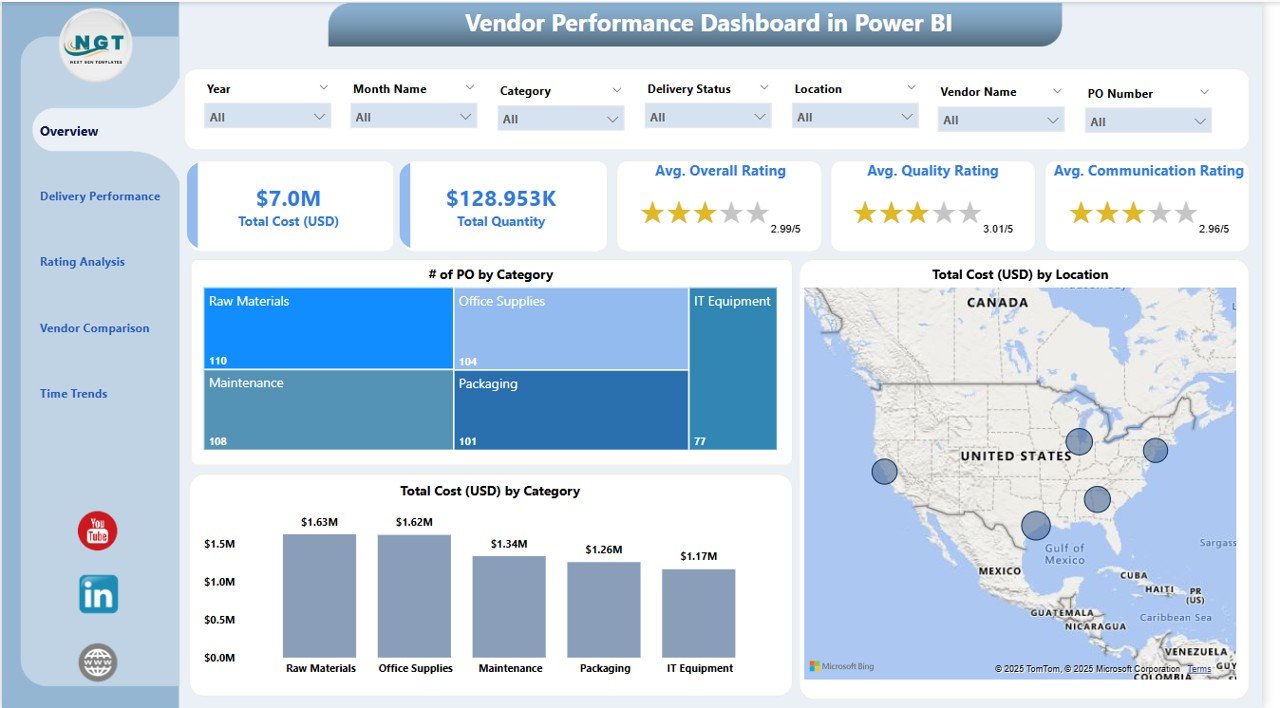
1️⃣ Overview Page
See KPIs, cost by category/location, and total POs at a glance. Use slicers to drill down quickly.
2️⃣ Delivery Performance Page
Track late vs. on-time deliveries, cost distribution by delivery status, and delivered quantities.
3️⃣ Rating Analysis Page
Visualize vendor ratings on quality, communication, and overall performance. Perfect for improving partnerships.
4️⃣ Vendor Comparison Page
Compare vendors by quantity, cost, and purchase order volume—side by side.
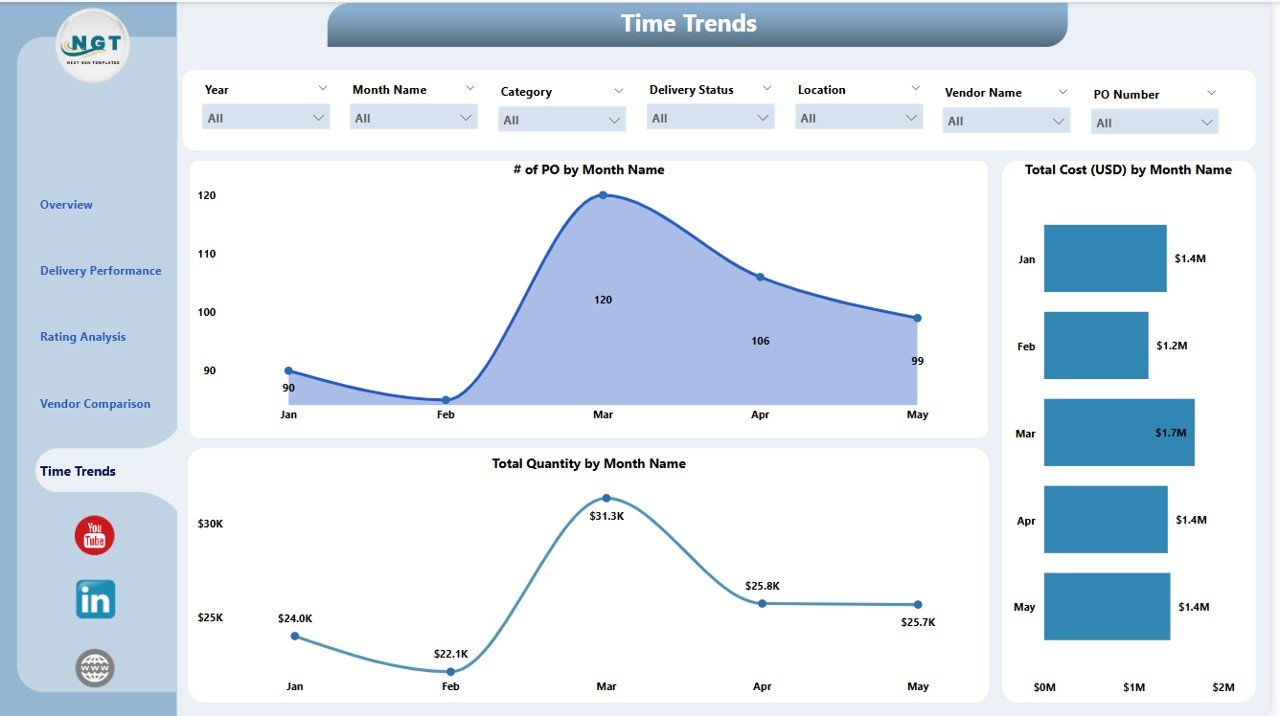
5️⃣ Time Trends Page
Track procurement trends over months. Identify seasonality, demand surges, or vendor slumps.
🛠️ How to Use the Vendor Performance Dashboard
-
🗂️ Prepare your Excel data (PO No., Vendor Name, Category, Quantity, Delivery Status, Cost, Ratings)
-
🔗 Import into Power BI and clean via Power Query
-
🧮 Build relationships between tables
-
🧠 Use DAX to define KPIs (e.g., Avg Delivery Days, Total Cost)
-
🎨 Navigate through each page and use slicers for custom views
-
📤 Publish and share securely using Power BI Service
👥 Who Can Benefit from This Dashboard?
-
🛒 Procurement Teams – Evaluate vendors based on cost, delivery, and performance
-
📦 Supply Chain Managers – Improve logistics and track fulfillment
-
💰 Finance Departments – Monitor spend trends and budget compliance
-
🧪 Quality Teams – Assess supplier ratings and detect issues
-
🧑💼 Executives & Leaders – Make data-driven sourcing decisions
-
🏭 Manufacturing, Retail, IT, and More – Any sector relying on vendor partnerships
🔗 Click here to read the Detailed blog post
🔗 Visit our YouTube channel to learn step-by-step video tutorials


Reviews
There are no reviews yet.