Managing Vendor Management Dashboard is no longer optional—it is a core business requirement. Vendors directly impact cost control, delivery timelines, service quality, compliance, and overall operational efficiency. However, many organizations still manage vendors through disconnected spreadsheets, email threads, and manual reviews. As a result, decision-makers lack visibility, risks remain hidden, and vendor relationships suffer.
This is precisely where a Vendor Management Dashboard in Excel delivers massive value.
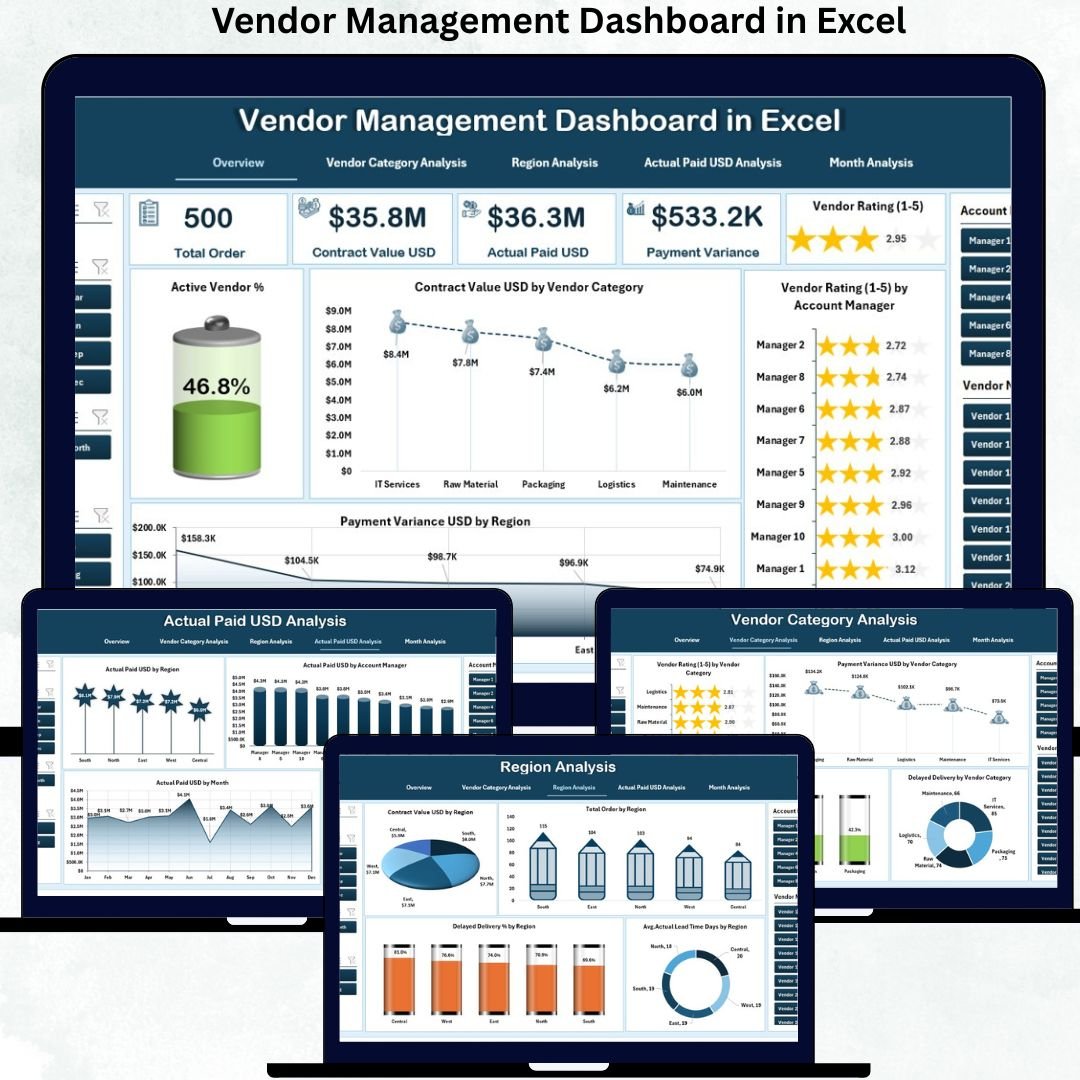
The Vendor Management Dashboard in Excel is a ready-to-use, interactive analytics solution designed to give complete visibility into vendor performance, payments, contracts, compliance, and delivery efficiency—all within Excel. Instead of reacting late to issues, organizations can monitor vendor performance proactively and take data-driven actions.
Built entirely in Excel, this dashboard transforms raw vendor data into powerful KPIs, visual charts, and slicer-driven insights. You do not need expensive vendor management software, complex systems, or technical skills. If you know basic Excel, you can start using this dashboard immediately.
✨ Key Features of the Vendor Management Dashboard in Excel
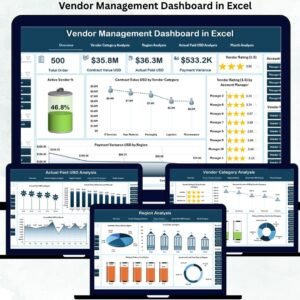
This dashboard is structured into five professional analysis pages, each answering a critical vendor-related question.
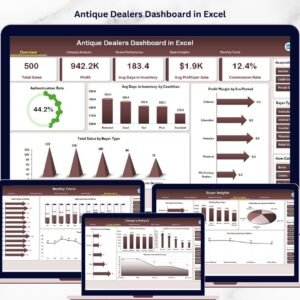
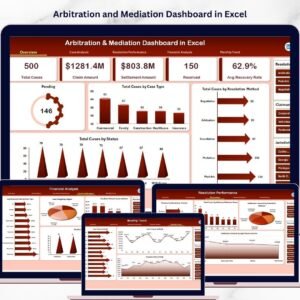
⭐ Overview Page – Complete Vendor Health Snapshot
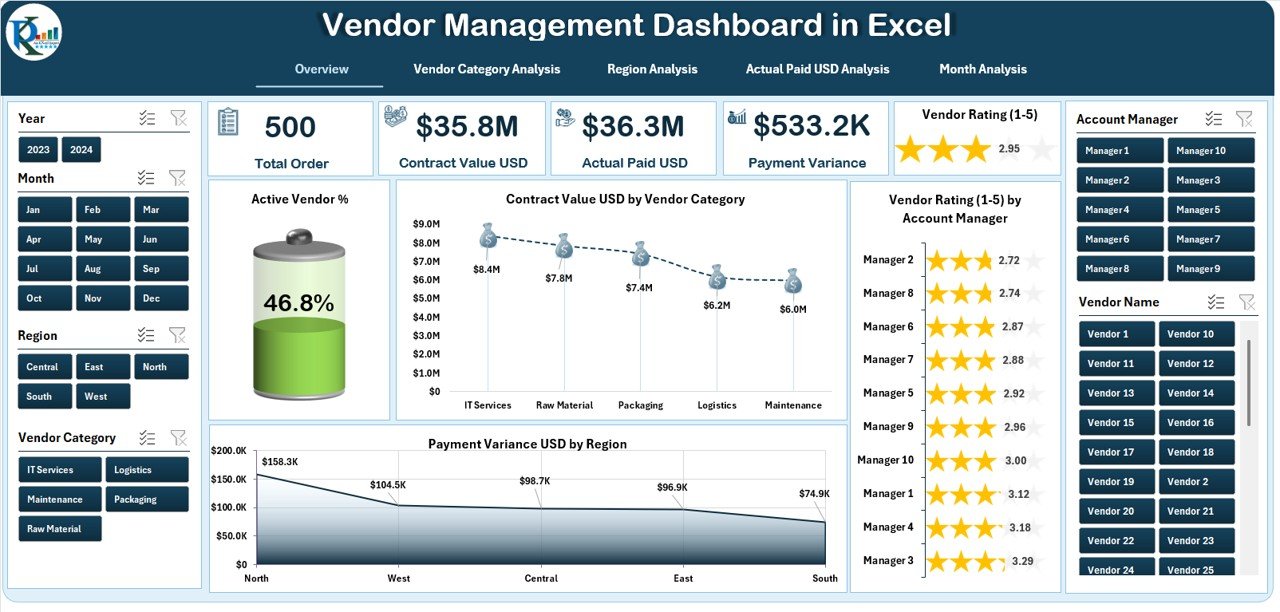
✔ Five KPI cards showing:
-
Active Vendor %
-
Total Contract Value USD
-
Average Vendor Rating
-
Total Payment Variance USD
-
Delayed Delivery %
✔ High-impact charts including:
-
Contract Value USD by Vendor Category
-
Vendor Rating by Account Manager
-
Payment Variance USD by Region
-
Active Vendor %
This page acts as the executive summary, helping leaders understand overall vendor health in seconds.
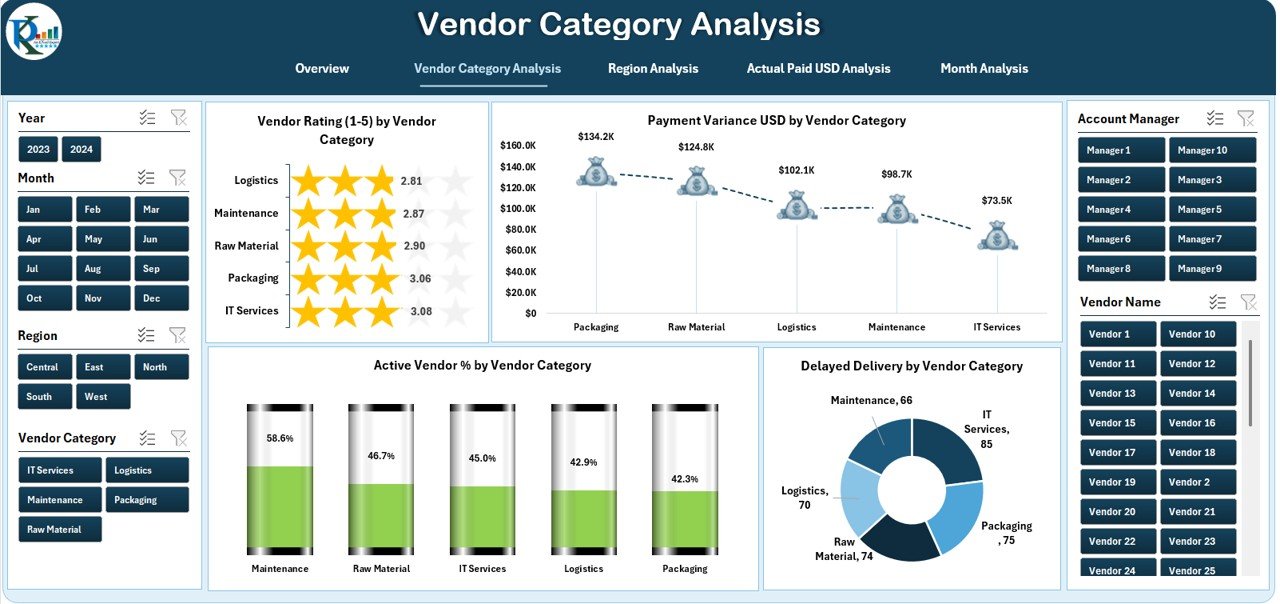
⭐ Vendor Category Analysis – Category-Wise Performance
✔ Vendor Rating by Category
✔ Payment Variance USD by Category
✔ Active Vendor % by Category
✔ Delayed Delivery % by Category
This analysis helps organizations identify high-risk vendor categories, optimize sourcing strategies, and improve contract negotiations.
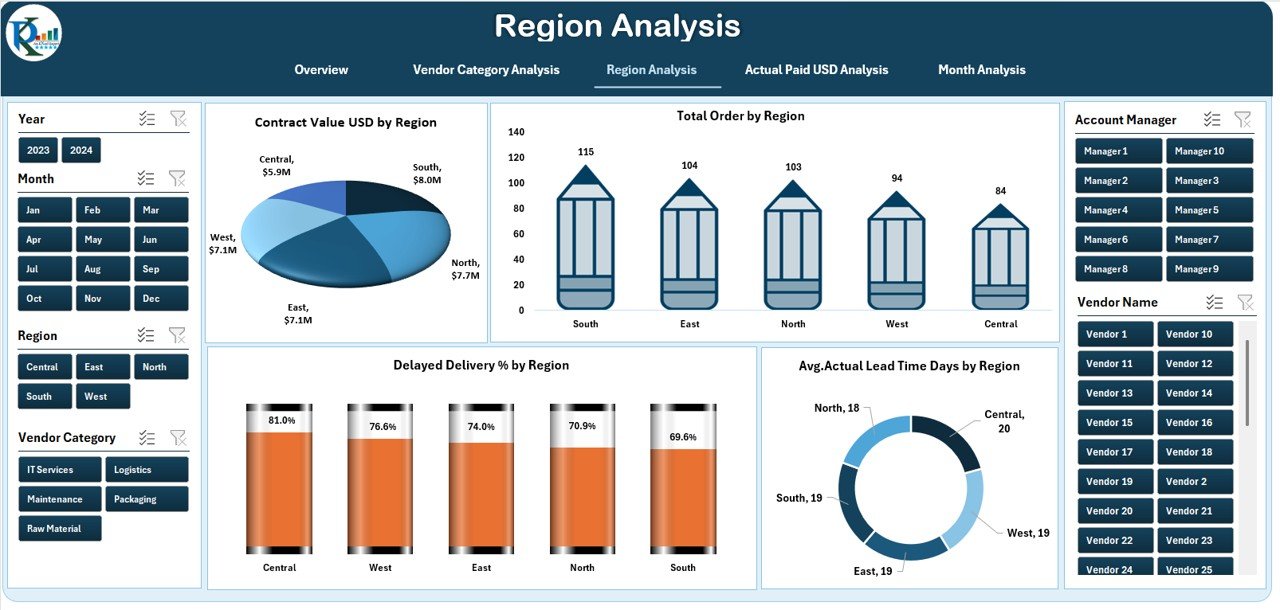
⭐ Region Analysis – Geographic Vendor Insights
✔ Contract Value USD by Region
✔ Total Orders by Region
✔ Delayed Delivery % by Region
✔ Average Actual Lead Time Days by Region
With region-wise insights, teams detect logistics challenges, regional risks, and cost inefficiencies early.
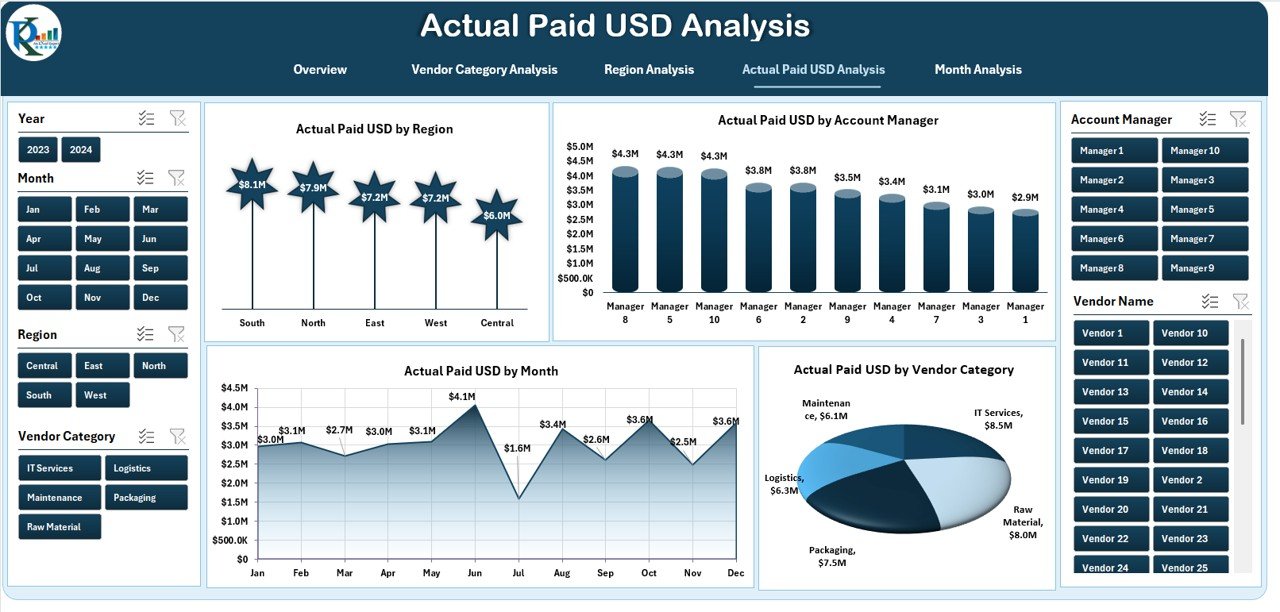
⭐ Actual Paid USD Analysis – Financial Control
✔ Actual Paid USD by Region
✔ Actual Paid USD by Account Manager
✔ Actual Paid USD by Vendor Category
✔ Actual Paid USD by Month
This page strengthens cash-flow planning, payment discipline, and financial transparency.
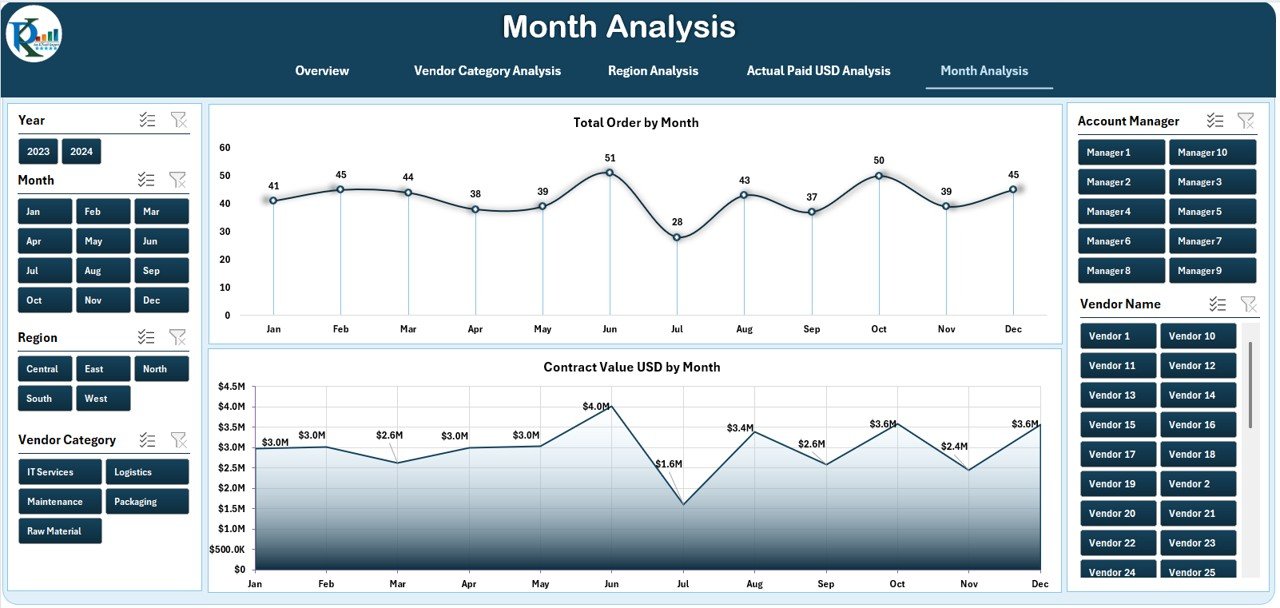
⭐ Month Analysis – Trend & Forecasting
✔ Monthly vendor performance trends
✔ Seasonal payment and delivery patterns
✔ Early detection of performance fluctuations
Trend analysis allows organizations to predict problems before they escalate.
📦 What’s Inside the Vendor Management Dashboard
When you download this product, you get:
✅ Ready-to-use Excel dashboard file
✅ 5 professionally designed analysis pages
✅ KPI cards with visual indicators
✅ Right-side slicers for fast filtering
✅ Clean and executive-ready layout
✅ Scalable structure for growing vendor data
Simply update the Data Sheet, and the dashboard refreshes automatically.
🛠️ How to Use the Vendor Management Dashboard
1️⃣ Update vendor data in the Data Sheet
2️⃣ Open the dashboard sheet
3️⃣ Use slicers to filter by vendor, region, category, or month
4️⃣ Review KPIs and charts instantly
5️⃣ Identify risks, delays, and cost variance
6️⃣ Use insights in vendor reviews and negotiations
No advanced Excel or technical expertise required.
👥 Who Can Benefit from This Vendor Management Dashboard
This dashboard is ideal for:
✔ Procurement Managers
✔ Supply Chain Teams
✔ Finance Managers
✔ Vendor Relationship Managers
✔ Operations Leaders
✔ Business Owners
Small businesses, mid-size companies, and large enterprises can all use this dashboard effectively.
### 📘 Click here to read the Detailed blog post
🎥 Visit our YouTube channel to learn step-by-step video tutorials
👉 Youtube.com/@PKAnExcelExpert


Reviews
There are no reviews yet.