Managing television broadcasting performance has become more complex than ever. TV networks today operate across multiple platforms, regions, and content categories while handling massive volumes of audience data and advertising metrics. Without a structured analytics system, it becomes extremely difficult to track viewer engagement, TRP ratings, impressions, and advertising revenue efficiently.
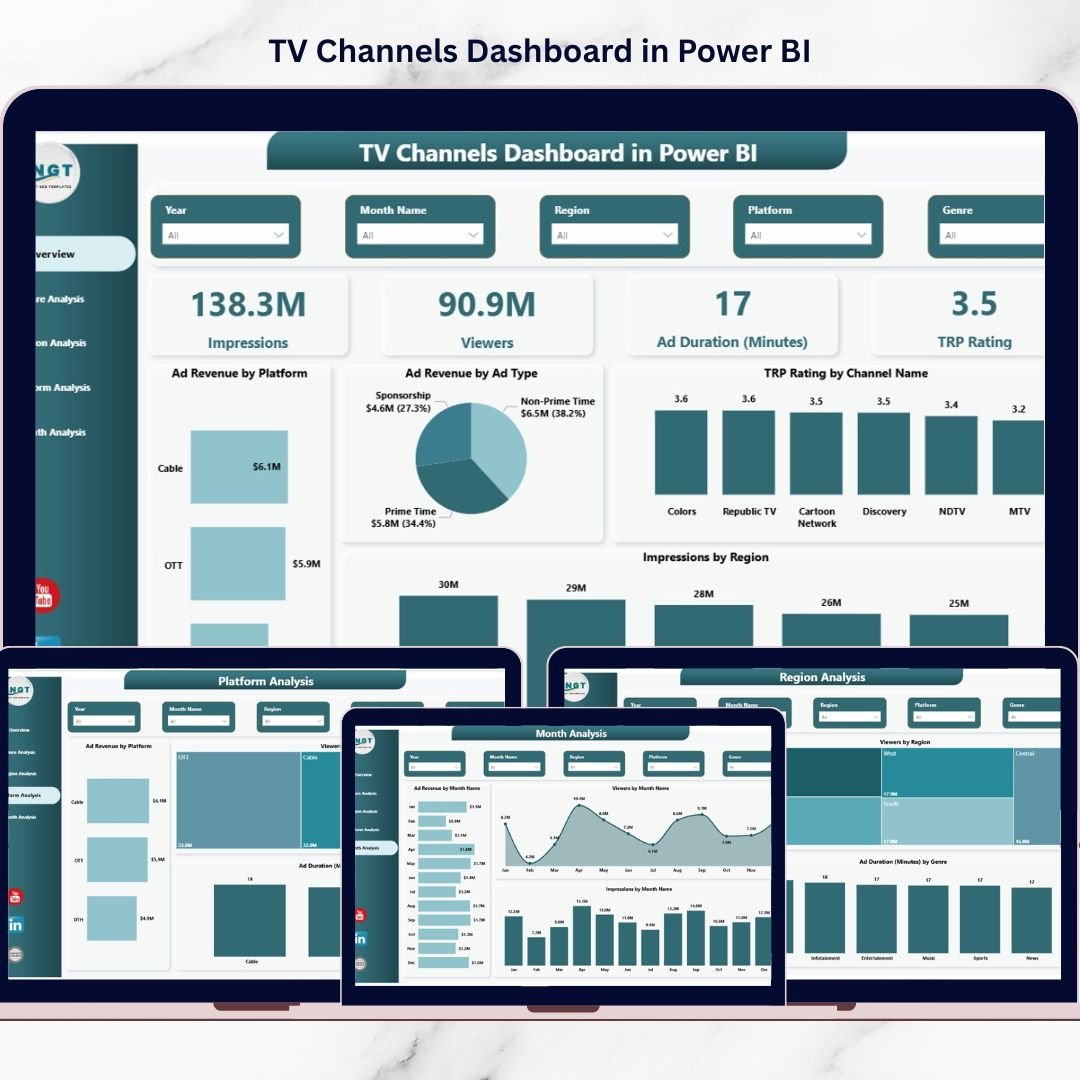
The TV Channels Dashboard in Power BI is designed to solve this challenge by providing a powerful and interactive business intelligence solution. This ready-to-use dashboard allows broadcasting companies, media analysts, and advertising agencies to monitor TV channel performance using dynamic visual reports.
Instead of analyzing scattered spreadsheets and disconnected reports, users can track all key broadcasting metrics from a centralized Power BI dashboard. The template transforms raw data into meaningful charts, KPIs, and insights that help decision-makers understand audience behavior, advertising trends, and channel performance quickly.
With interactive slicers and powerful visual analytics, users can filter insights by genre, platform, region, channel, and month, allowing them to explore performance trends from multiple perspectives.
Whether you are managing TV networks, analyzing advertising campaigns, or evaluating audience engagement, this dashboard helps you make faster and smarter decisions using data-driven insights.
Key Feature of TV Channels Dashboard in Power BI
🚀 5 Interactive Analytical Pages – Explore TV channel performance through five fully designed Power BI dashboard pages for detailed analysis.
📊 Powerful KPI Cards – Instantly monitor key broadcasting metrics including Impressions, Viewers, Ad Duration (Minutes), and TRP Rating.
📈 Advanced Advertising Analytics – Track advertising revenue by platform, ad type, genre, and region to understand which segments generate the highest income.
🌍 Regional Audience Insights – Analyze viewer engagement and impressions across different geographic regions.
🎬 Genre Performance Analysis – Identify which genres such as news, sports, entertainment, and movies attract the most viewers and generate the highest revenue.
📺 Platform Performance Monitoring – Evaluate audience engagement across cable TV, satellite TV, streaming platforms, and mobile devices.
📅 Monthly Performance Tracking – Analyze trends in viewer engagement, impressions, and advertising revenue across different months.
🎯 Interactive Slicers and Filters – Easily filter the dashboard by region, genre, platform, channel, and time period for deeper analysis.
⚡ Dynamic Visual Charts – Beautiful Power BI visuals help transform raw broadcasting data into easy-to-understand insights.
💡 Centralized Reporting System – Consolidate all TV channel analytics into one interactive dashboard.
What’s Inside the TV Channels Dashboard in Power BI
This Power BI template includes five powerful analytical pages designed to monitor different aspects of television broadcasting performance.
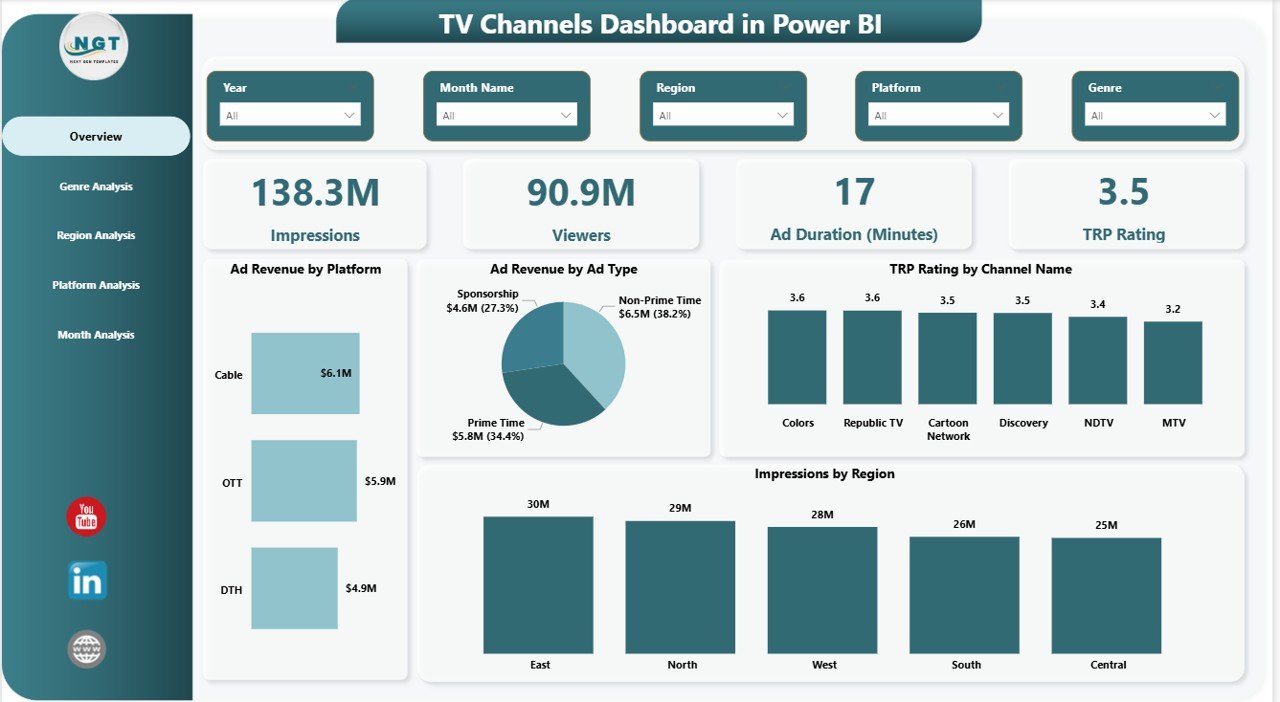
📊 Overview Page
This main dashboard page provides a quick summary of broadcasting performance with four KPI cards:
-
Impressions
-
Viewers
-
Ad Duration (Minutes)
-
TRP Rating
It also includes four analytical charts:
-
Ad Revenue by Platform
-
Ad Revenue by Ad Type
-
TRP Rating by Channel Name
-
Impressions by Region
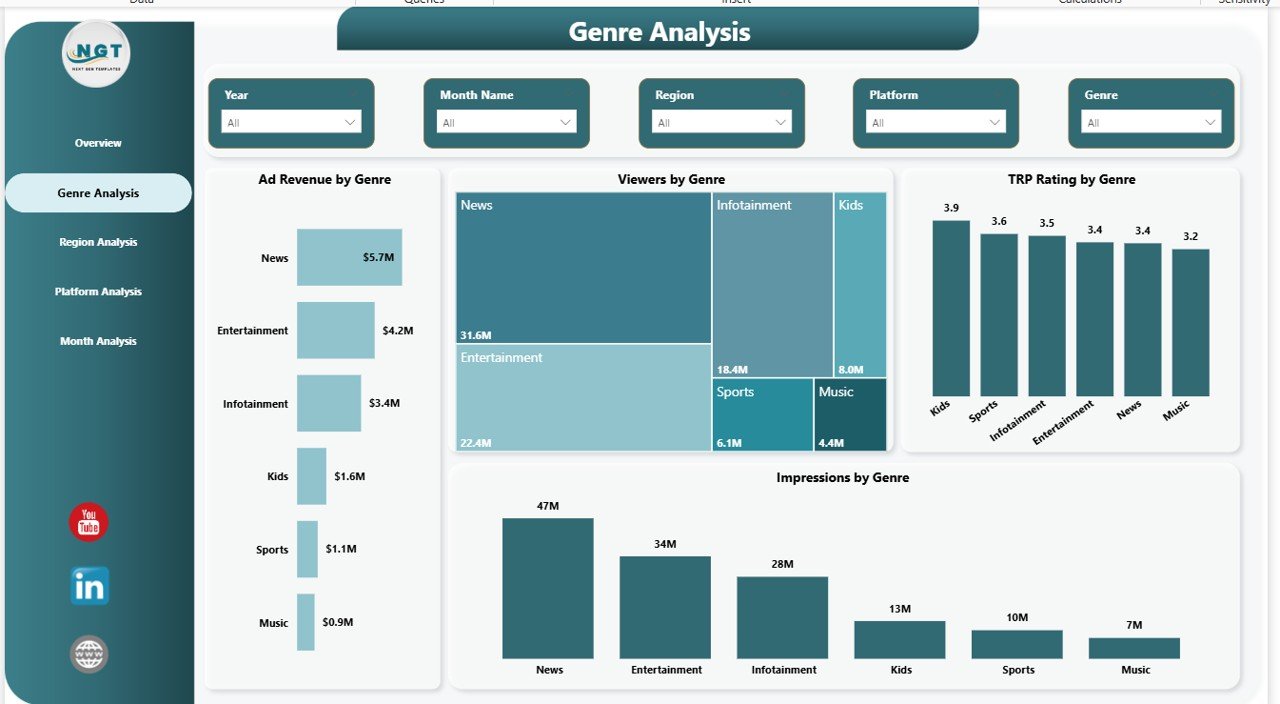
📺 Genre Analysis Page
This page helps identify which content genres generate the most audience engagement and revenue.
Charts include:
-
Ad Revenue by Genre
-
Viewers by Genre
-
TRP Rating by Genre
-
Impressions by Genre
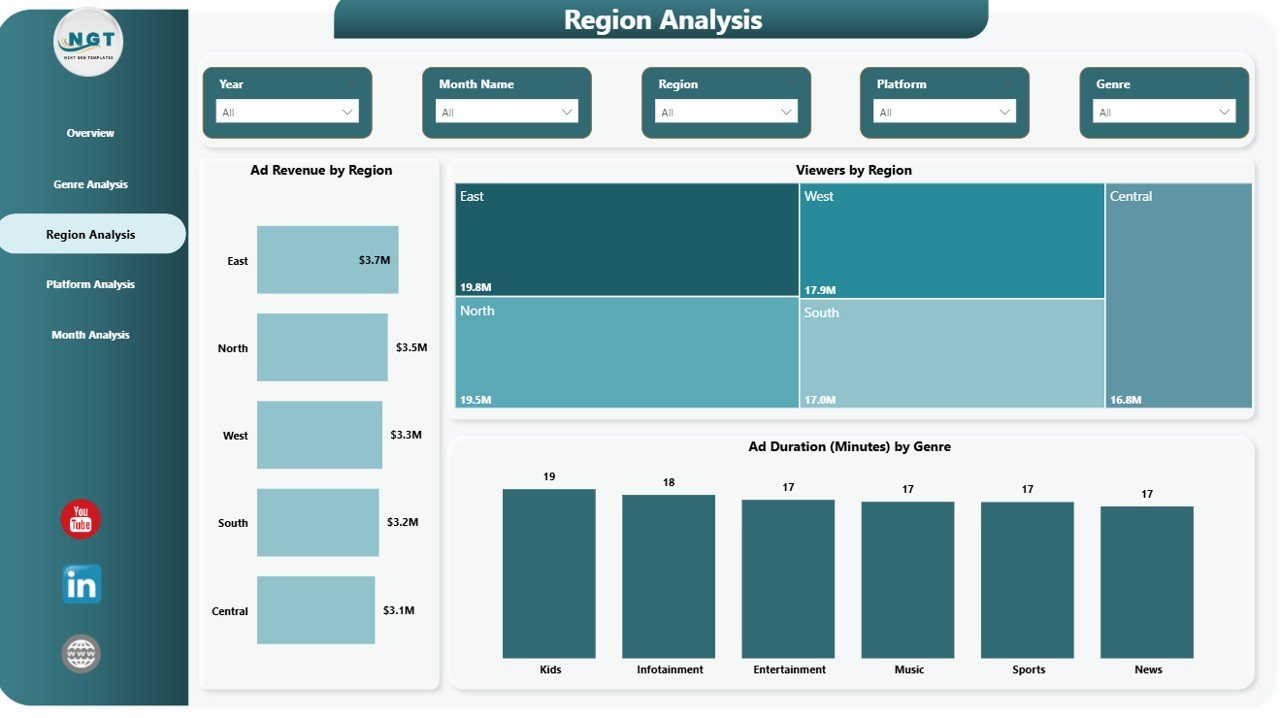
🌎 Region Analysis Page
This section analyzes viewer distribution and advertising performance across geographic regions.
Charts include:
-
Ad Revenue by Region
-
Viewers by Region
-
Ad Duration (Minutes) by Genre
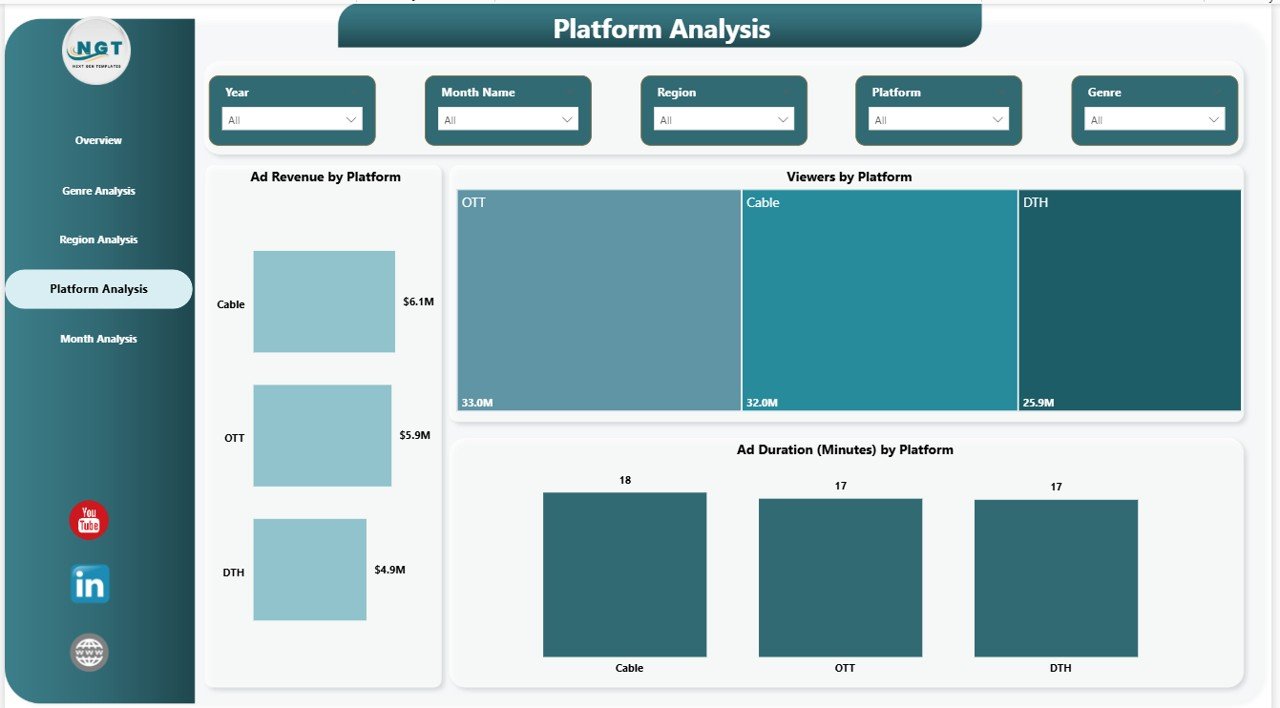
📱 Platform Analysis Page
Evaluate how different broadcasting platforms perform in terms of audience engagement and revenue.
Charts include:
-
Ad Revenue by Platform
-
Viewers by Platform
-
Ad Duration (Minutes) by Platform
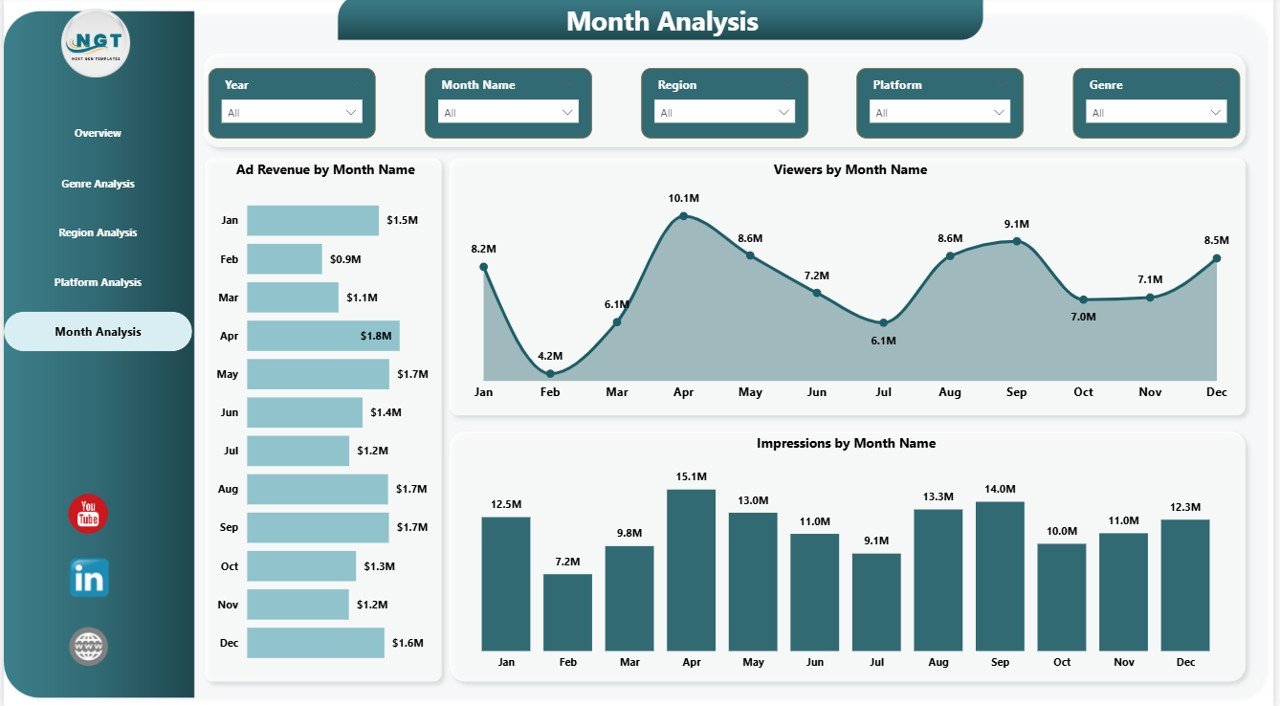
📅 Month Analysis Page
Understand seasonal broadcasting trends with monthly performance insights.
Charts include:
-
Ad Revenue by Month Name
-
Viewers by Month Name
-
Impressions by Month Name
How to Use the TV Channels Dashboard in Power BI
Using this dashboard template is simple and requires only basic Power BI knowledge.
1️⃣ Import your broadcasting dataset into Power BI.
2️⃣ Connect the data tables to the dashboard visuals.
3️⃣ Refresh the data model to update charts automatically.
4️⃣ Use slicers to filter the dashboard by region, genre, platform, or month.
5️⃣ Analyze viewer trends, advertising revenue, and TRP ratings instantly.
Because the dashboard is interactive, users can explore multiple insights quickly without creating complex reports manually.
Who Can Benefit from This TV Channels Dashboard in Power BI
This dashboard is useful for a wide range of professionals working in the media and broadcasting industry.
📺 TV Network Executives – Monitor channel performance and optimize programming strategies.
📊 Media Analysts – Analyze viewer engagement and audience trends.
💰 Advertising Agencies – Identify the most profitable advertising channels and regions.
🎬 Content Strategy Teams – Understand which genres attract the highest viewership.
📈 Broadcasting Managers – Track TRP ratings and advertising revenue effectively.
📡 Digital Streaming Analysts – Evaluate platform performance and viewer behavior.
Click here to read the Detailed blog post
Watch the step-by-step video tutorial:


