Running a trucking company today is more complex than ever. Rising fuel prices, increasing maintenance expenses, delivery delays, driver performance issues, and tight profit margins make decision-making extremely challenging. Relying on manual spreadsheets and delayed reports only adds to the problem.
That is where the Trucking Companies Dashboard in Power BI becomes a game-changing analytics solution.
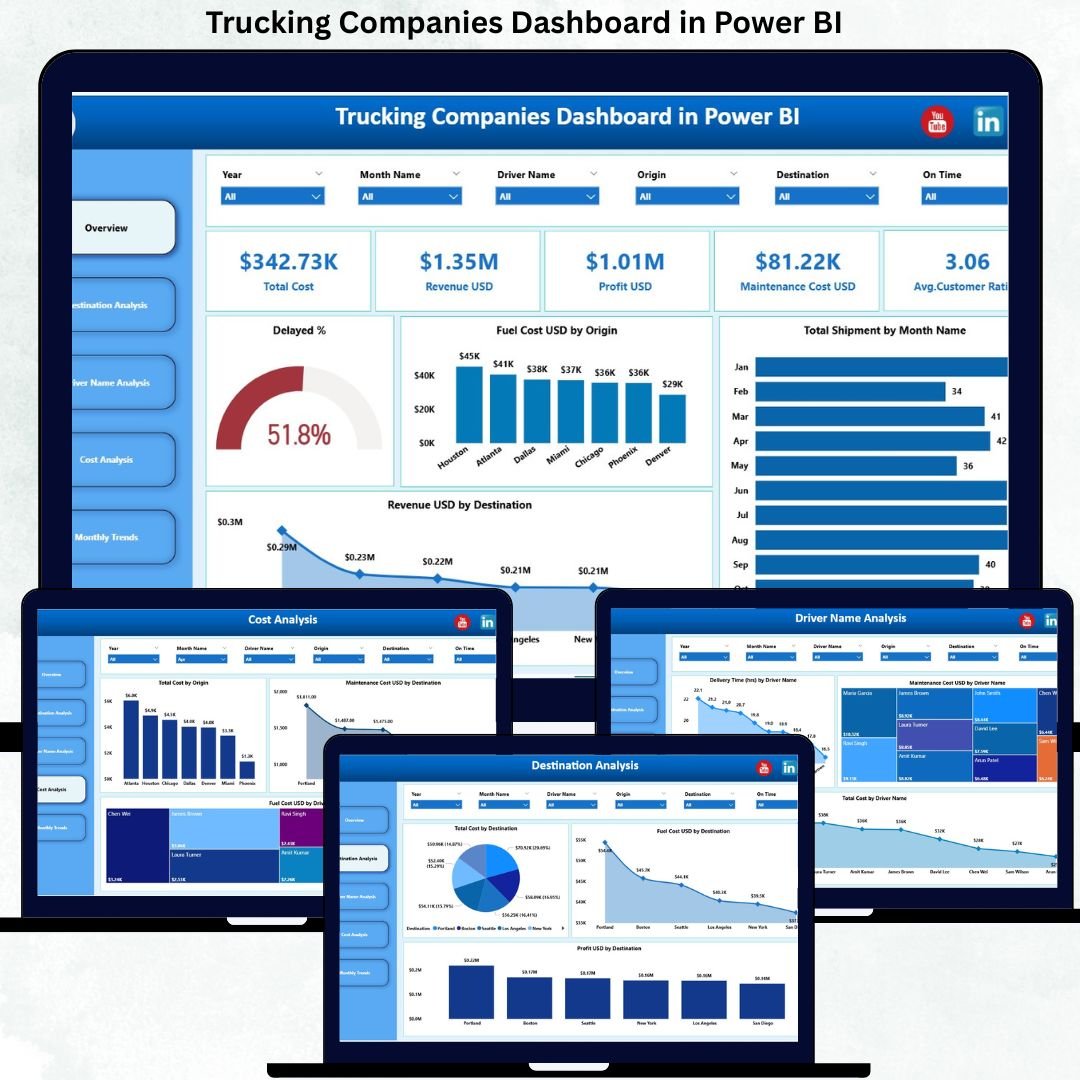
This ready-to-use Power BI dashboard transforms raw trucking data into clear, interactive, and actionable insights. It gives fleet owners, operations managers, and finance teams complete visibility into costs, revenue, shipments, drivers, and profitability—all in one professional dashboard. Instead of guessing or reacting late, you gain the power to make fast, data-driven decisions that directly impact efficiency and profit.
🔑 Key Features of Trucking Companies Dashboard in Power BI
🚚 Centralized Performance Monitoring
Track total cost, revenue, profit, maintenance cost, fuel cost, and customer ratings from a single dashboard.
📊 Interactive KPI Cards & Visuals
Instantly view key metrics through clean KPI cards and dynamic charts for quick understanding.
🎯 Smart Slicers for Deep Analysis
Filter insights by month, destination, driver name, or cost category with just a few clicks.
📍 Destination-Wise Profitability Analysis
Identify high-cost routes, profitable destinations, and fuel-intensive locations easily.
👨✈️ Driver-Level Performance Tracking
Monitor delivery time, maintenance cost, and total cost by driver to improve efficiency.
📈 Monthly Trend Analysis
Track cost movement and profit margin trends over time to spot patterns early.
⚙️ Built in Power BI – Easy to Customize
Modify KPIs, visuals, and slicers as per your business needs without complexity.
📦 What’s Inside the Trucking Companies Dashboard in Power BI
This professional Power BI file includes 5 powerful analytical pages:
📊 Overview Page
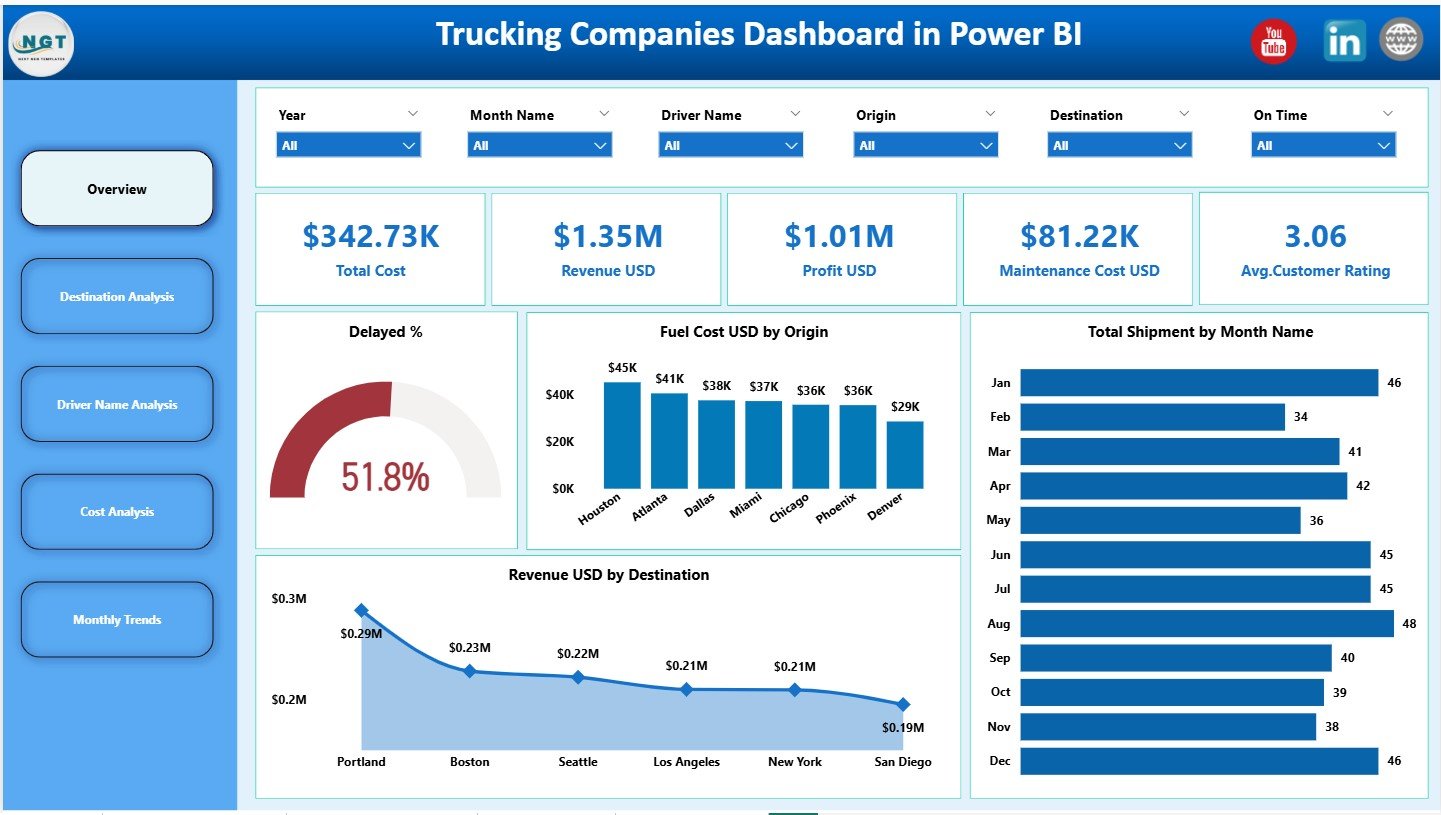
Shows Total Cost, Revenue, Profit, Maintenance Cost, and Average Customer Rating with charts for delayed %, fuel cost, shipments by month, and revenue by destination.
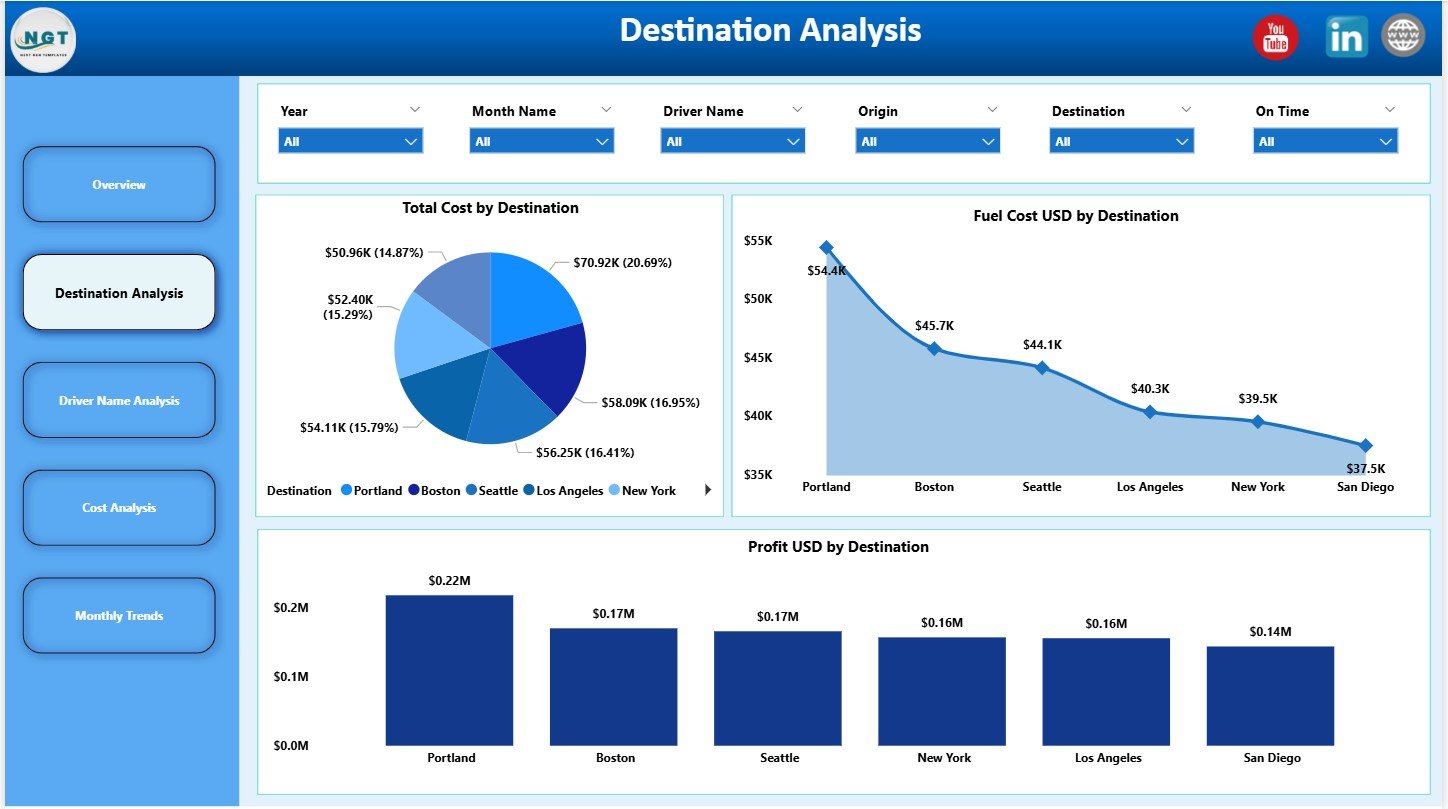
📍 Destination Analysis Page
Displays Total Cost, Fuel Cost, and Profit by destination to support route planning and pricing decisions.
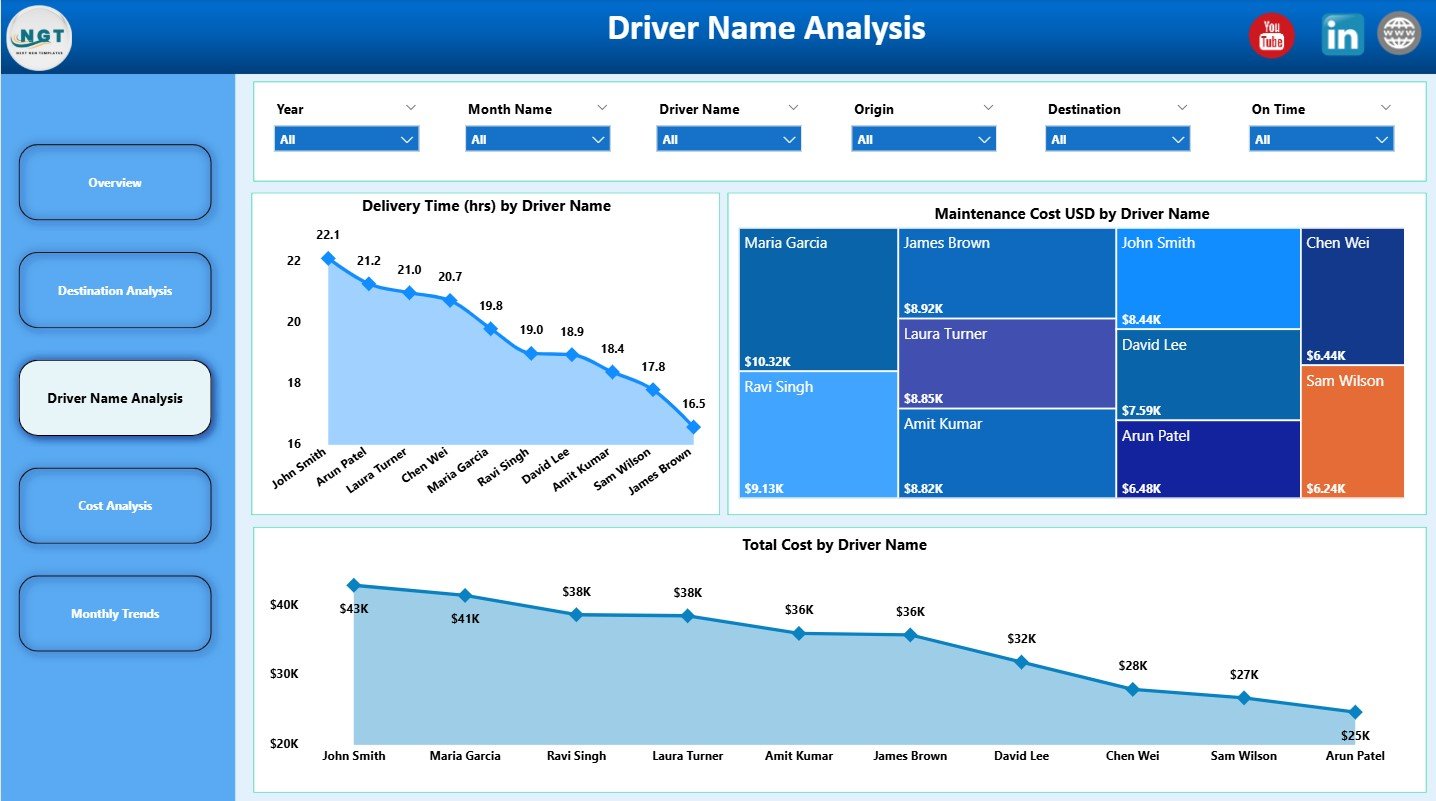
👨✈️ Driver Name Analysis Page
Highlights Delivery Time, Maintenance Cost, and Total Cost by driver for performance evaluation.
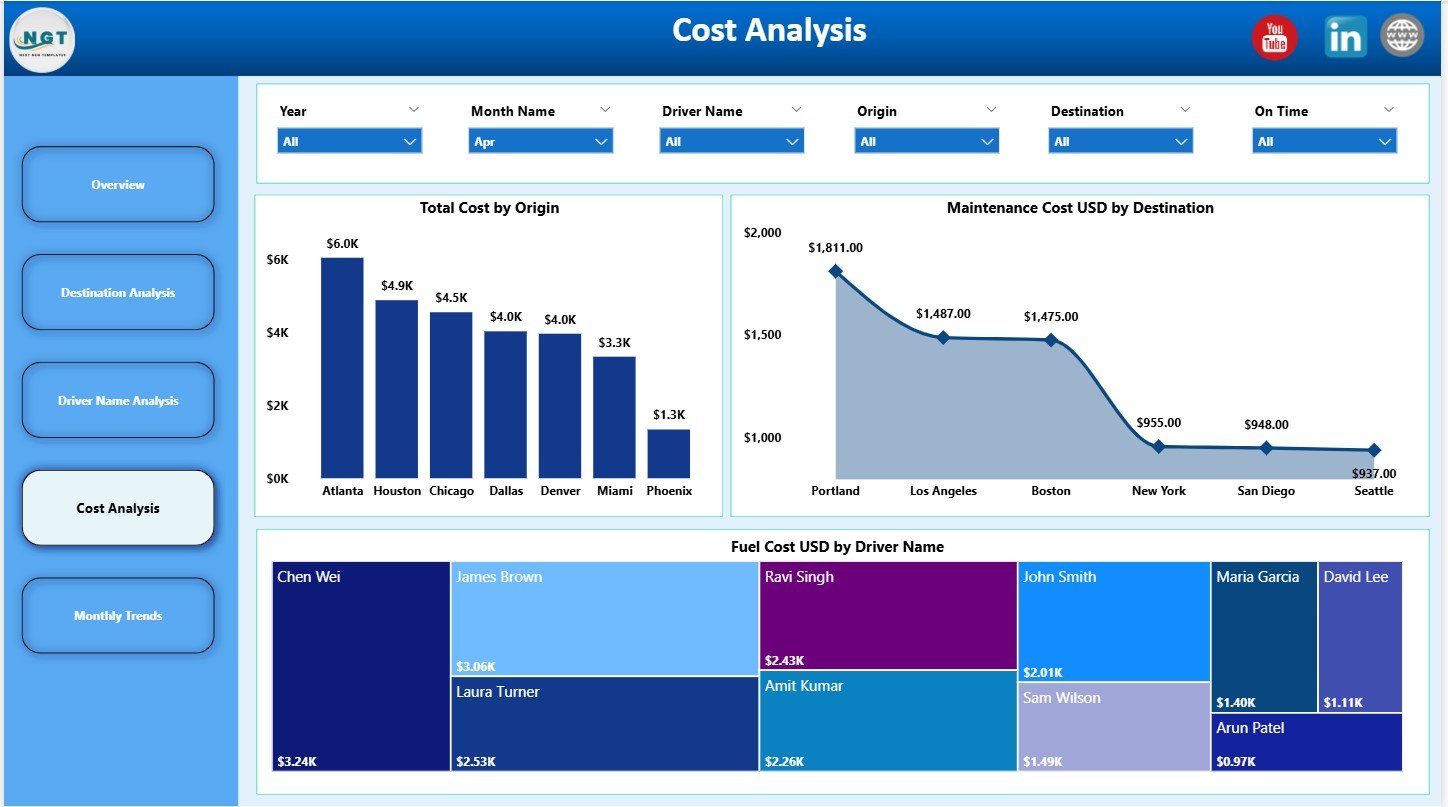
💰 Cost Analysis Page
Breaks down Total Cost by origin, Maintenance Cost by destination, and Fuel Cost by driver.
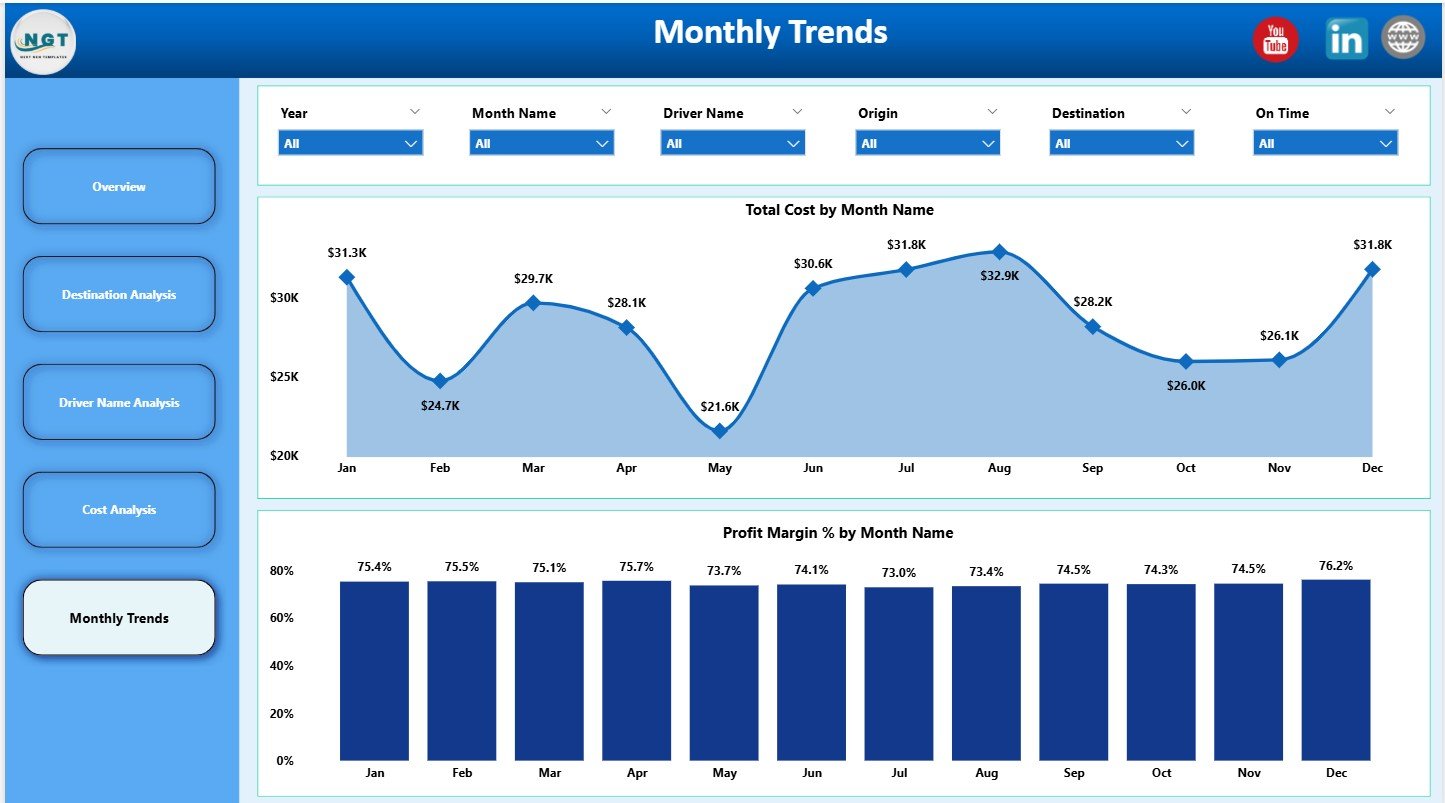
📅 Monthly Trends Page
Tracks Total Cost and Profit Margin (%) month-wise for long-term strategic planning.
Each page is designed to deliver clear insights with minimum effort.
▶️ How to Use the Trucking Companies Dashboard in Power BI
Using this dashboard is simple and practical:
1️⃣ Load your trucking data from Excel or operational systems
2️⃣ Refresh the Power BI file
3️⃣ Use slicers to filter by month, destination, or driver
4️⃣ Review KPI cards for quick performance checks
5️⃣ Analyze charts to identify cost leaks and profit opportunities
6️⃣ Take corrective actions based on insights
No advanced Power BI skills are required—basic knowledge is enough.
🎯 Who Can Benefit from This Trucking Companies Dashboard in Power BI
🚛 Trucking Company Owners – Gain full control over costs and profitability
📦 Fleet Managers – Monitor drivers, routes, and operational efficiency
📊 Operations Managers – Reduce delays and optimize daily performance
💰 Finance Teams – Track expenses, margins, and revenue trends
📈 Logistics Analysts – Perform deep analytical reviews with ease
🏢 Senior Executives – Access professional, decision-ready reports
Whether you manage a small fleet or a large trucking enterprise, this dashboard scales effortlessly.
👉 Click here to read the Detailed Blog Post
🔔 Visit our YouTube channel to learn step-by-step video tutorials
👉 YouTube.com/@PKAnExcelExpert


Reviews
There are no reviews yet.