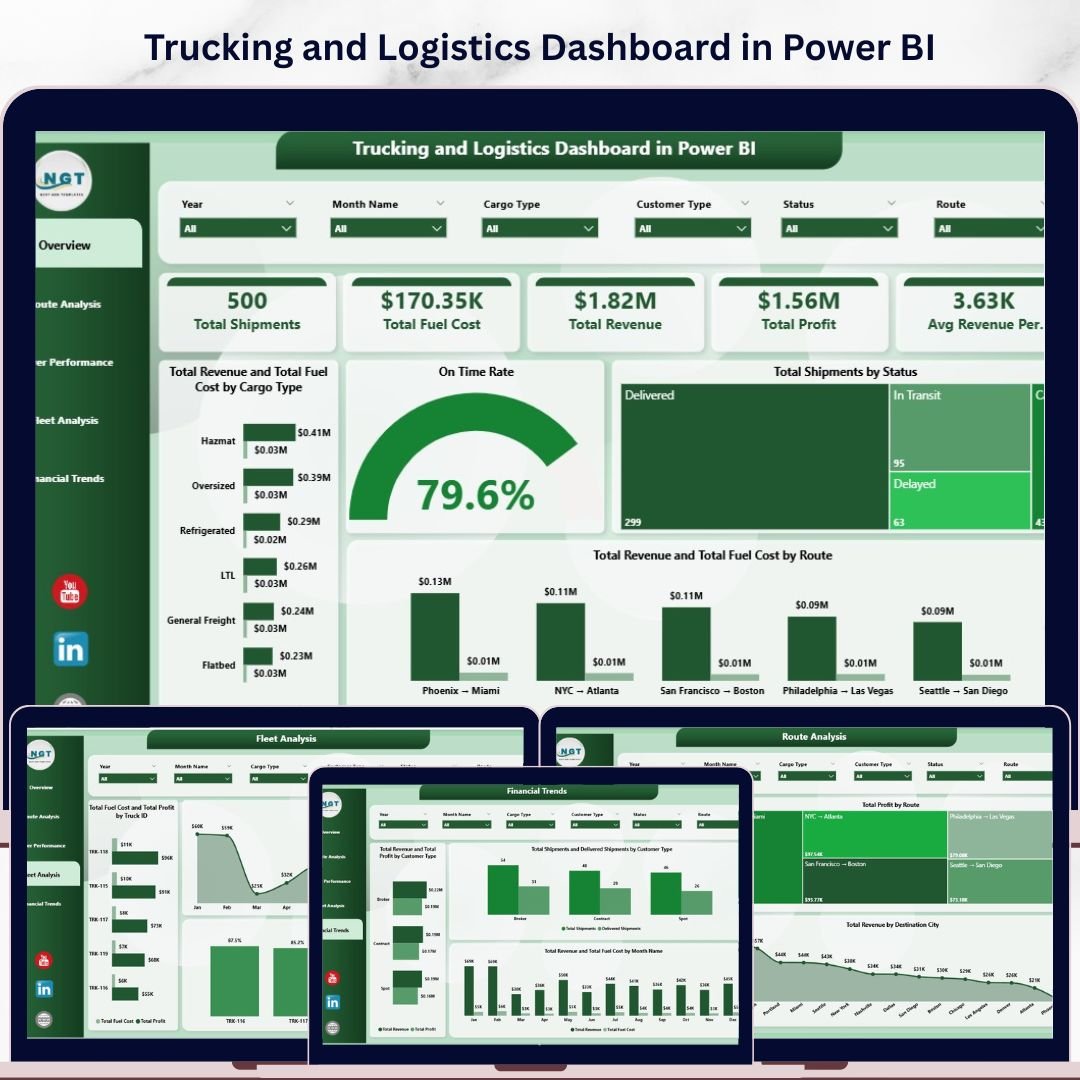
Trucking and Logistics Dashboard in Power BI is a professionally designed, ready-to-use analytics template built for fleet managers, trucking companies, logistics coordinators, and supply chain professionals who need full visibility into revenue, fuel costs, route efficiency, driver performance, and fleet operations — all from one powerful Power BI dashboard. This template features 5 interactive dashboard pages that transform your raw trucking and logistics data into clear, actionable visual insights.
Whether you manage a regional fleet or a large-scale freight operation, this dashboard delivers instant clarity on profitability by route, on-time delivery rates, fuel cost trends, and individual driver performance. Simply connect your data source, hit refresh, and watch every chart and KPI update automatically. If you also work with spreadsheets, check out the Trucking and Logistics Dashboard in Excel for a pivot-powered alternative.
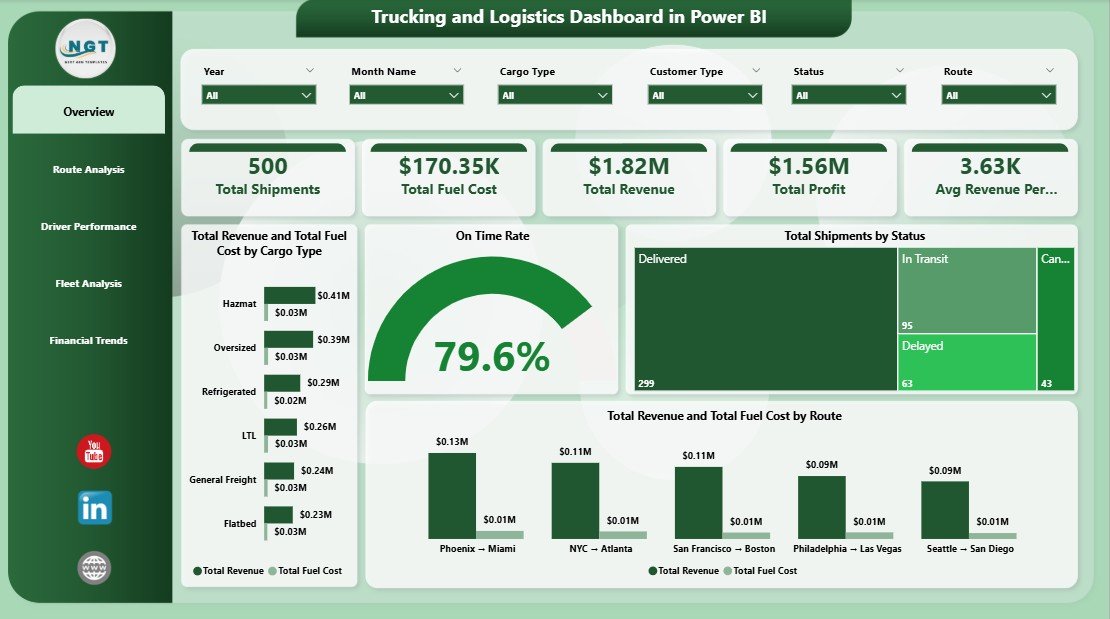
Trucking and Logistics Dashboard in Power BI – Overview Page
🔑 Key Features of the Trucking and Logistics Dashboard in Power BI
📌 5 Interactive Dashboard Pages – Overview, Route Analysis, Driver Performance, Fleet Analysis, and Financial Trends provide a 360-degree view of your trucking and logistics operations in Power BI.
📌 High-Level KPI Cards – The Overview page displays Total Shipments, Total Fuel Cost, Total Revenue, Total Profit, and Avg Revenue Per Shipment at a glance so you can monitor fleet health instantly.
📌 Dynamic Charts and Visuals – Analyze Total Revenue and Total Fuel Cost by Cargo Type, On Time Rate, Total Shipments by Status, and Total Revenue and Total Fuel Cost by Route — all on the Overview page alone.
📌 Route Analysis Page – Deep dive into Total Revenue by Driver Name, Total Profit by Route, and Total Revenue by Destination City to identify your most profitable corridors and underperforming lanes.
📌 Driver Performance Page – Track On Time Rate by Driver Name, Total Profit by Driver Name, and Total Shipments by Destination City to evaluate and reward top-performing drivers.
📌 Fleet Analysis Page – Monitor Total Fuel Cost and Total Profit by Truck ID, Total Profit by Month Name, and On Time Rate by Truck ID to optimize fleet utilization and maintenance scheduling.
📌 Financial Trends Page – Compare Total Revenue and Total Profit by Customer Type, Total Shipments and Delivered Shipments by Customer Type, and Total Revenue and Total Fuel Cost by Month Name for long-term financial planning.
📌 Multiple Slicers for Quick Filtering – Apply filters across the dashboard to drill down by cargo type, route, driver, truck, customer type, and month for targeted analysis.
📌 Plug-and-Play Design – Replace the sample data with your own trucking records, refresh the model, and the entire dashboard updates automatically — no DAX expertise required.
📦 What’s Inside the Trucking and Logistics Dashboard in Power BI
This Power BI template includes 5 fully designed dashboard pages:
📊 Overview Page – High-level KPI cards (Total Shipments, Total Fuel Cost, Total Revenue, Total Profit, Avg Revenue Per Shipment) plus charts for Revenue and Fuel Cost by Cargo Type, On Time Rate, Shipments by Status, and Revenue and Fuel Cost by Route.
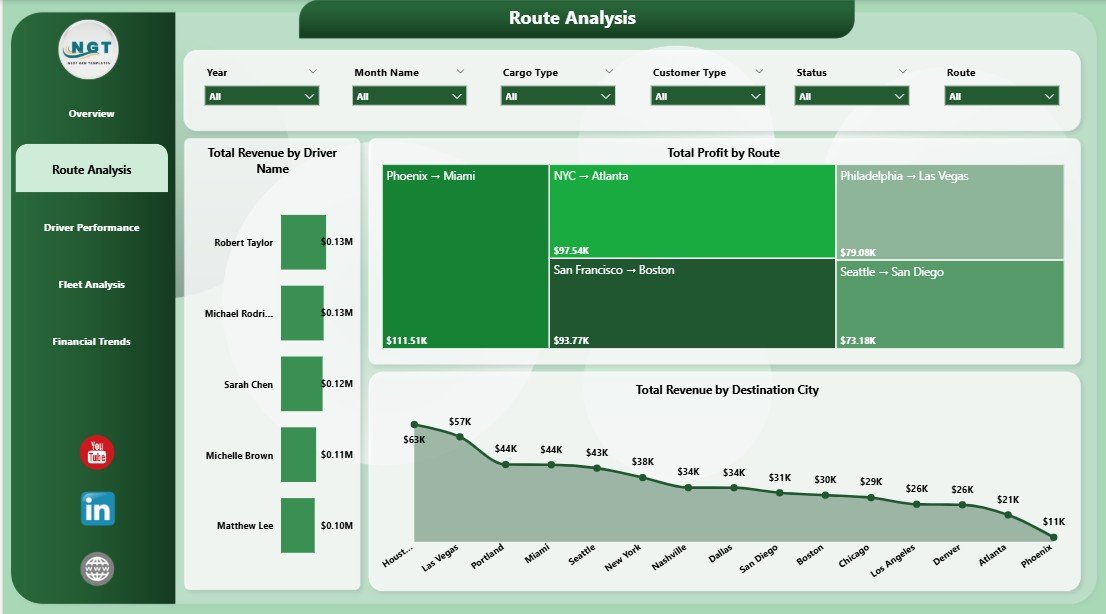
Route Analysis Page
📊 Route Analysis – Total Revenue by Driver Name, Total Profit by Route, and Total Revenue by Destination City.
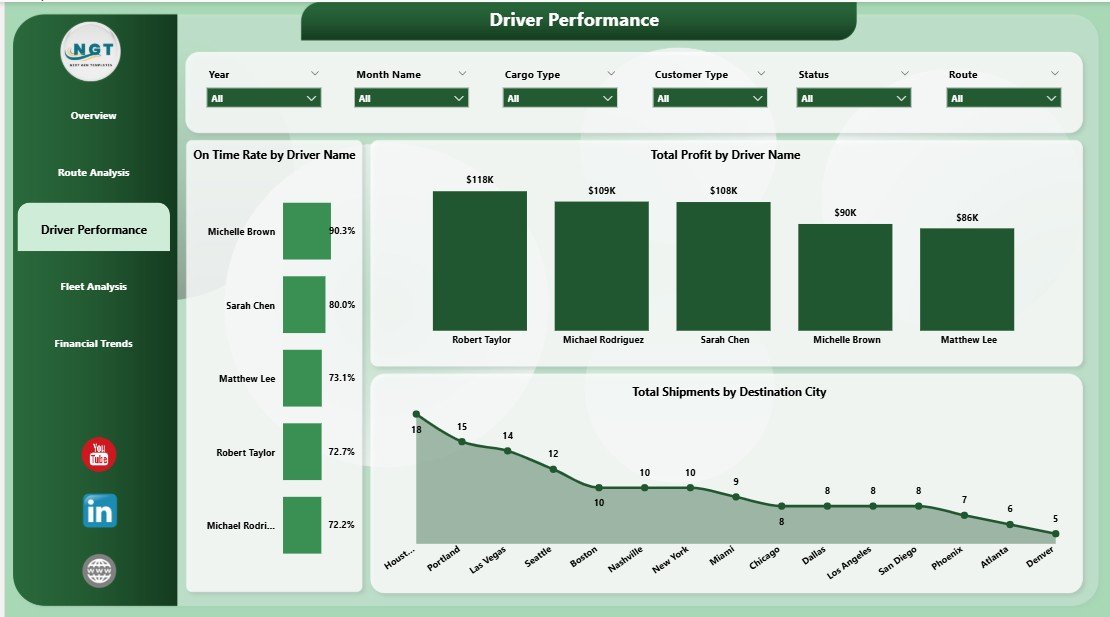
Driver Performance Page
📊 Driver Performance – On Time Rate by Driver Name, Total Profit by Driver Name, and Total Shipments by Destination City.
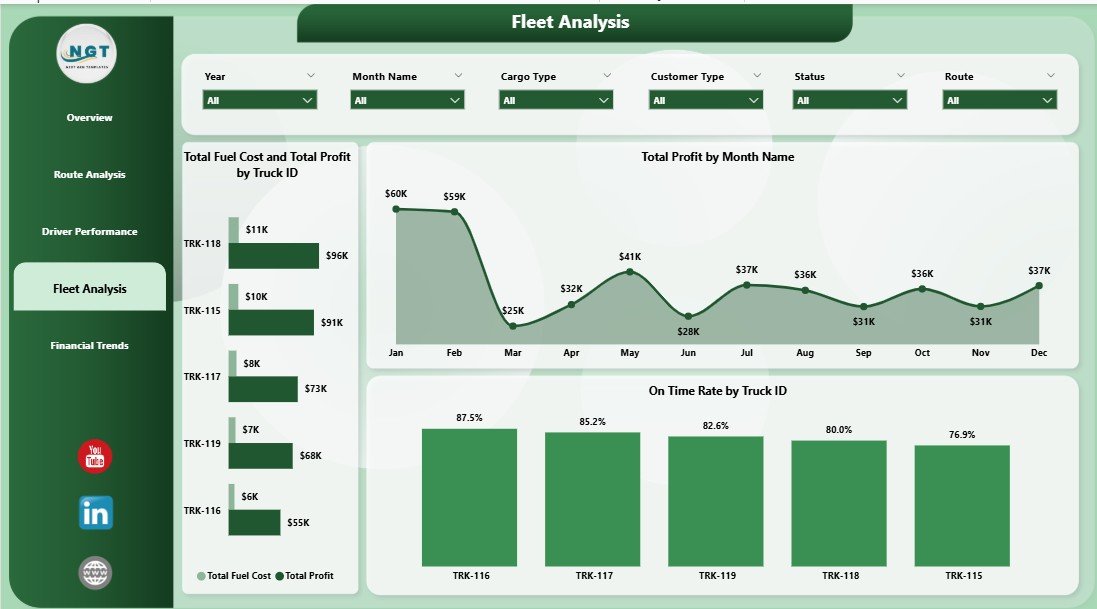
Fleet Analysis Page
📊 Fleet Analysis – Total Fuel Cost and Total Profit by Truck ID, Total Profit by Month Name, and On Time Rate by Truck ID.
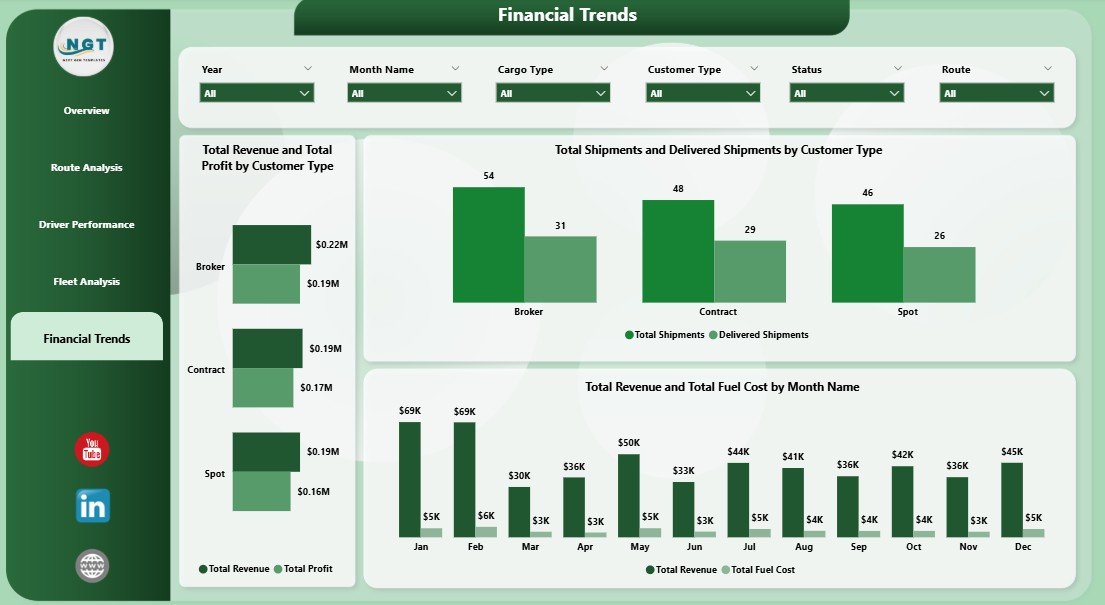
Financial Trends Page
📊 Financial Trends – Total Revenue and Total Profit by Customer Type, Total Shipments and Delivered Shipments by Customer Type, and Total Revenue and Total Fuel Cost by Month Name.
⚙️ How to Use the Trucking and Logistics Dashboard in Power BI
1️⃣ Download and unzip the file, then open the .pbix file in Power BI Desktop (free from Microsoft).
2️⃣ Review the sample data to understand the expected column structure — fields include Shipment ID, Driver Name, Truck ID, Route, Cargo Type, Destination City, Revenue, Fuel Cost, Profit, Status, and Date.
3️⃣ Replace the sample data with your own trucking records by updating the data source connection or pasting into the data model.
4️⃣ Click Refresh to update all visuals, KPI cards, and charts across all 5 pages.
5️⃣ Use slicers on each page to filter by cargo type, route, driver, truck, customer type, or month for focused analysis.
👥 Who Can Benefit from This Trucking and Logistics Dashboard?
📌 Fleet Managers tracking vehicle performance, fuel costs, and on-time delivery rates
📌 Logistics Coordinators monitoring shipment status, route profitability, and destination city trends
📌 Trucking Company Owners analyzing overall revenue, profit margins, and financial trends
📌 Supply Chain Analysts evaluating driver performance, cargo type efficiency, and customer profitability
📌 Operations Managers optimizing fleet utilization and identifying cost-saving opportunities
📌 Finance Teams reviewing monthly revenue trends, fuel cost patterns, and profit by customer type
Explore more analytics solutions in our Supply Chain & Logistics Templates collection.
❓ Frequently Asked Questions
What KPIs does the Trucking and Logistics Dashboard in Power BI track?
The dashboard tracks 5 key performance indicators on the Overview page: Total Shipments, Total Fuel Cost, Total Revenue, Total Profit, and Avg Revenue Per Shipment. Additional analysis across 4 more pages covers route profitability, driver on-time rates, fleet fuel efficiency, and financial trends by customer type.
Do I need advanced Power BI skills to use this template?
No. This is a plug-and-play Power BI template. Simply open the .pbix file in Power BI Desktop, replace the sample data with your own trucking records, and click Refresh. All charts, KPIs, and visuals update automatically.
Can I customize the dashboard to add more pages or metrics?
Yes. Since this is a standard .pbix file, you can add new pages, create additional DAX measures, modify visuals, change color themes, and connect to live data sources like SQL Server, Excel, or SharePoint.
What data format does this trucking dashboard require?
The dashboard expects tabular data with columns such as Shipment ID, Driver Name, Truck ID, Route, Cargo Type, Destination City, Revenue, Fuel Cost, Profit, Status, Date, and Customer Type. A sample dataset is included for reference.
Is this dashboard suitable for small trucking companies?
Absolutely. Whether you manage 5 trucks or 500, this Power BI dashboard scales to your data. The slicers and filters let you drill down to individual trucks, drivers, or routes regardless of fleet size.
🔗 Explore Related Templates
📌 Trucking and Logistics Dashboard in Excel – The same trucking analytics powered by Excel pivot tables and slicers for users who prefer spreadsheets.
📌 Law Firm Performance Dashboard in Power BI – A professional Power BI template for law firms tracking case metrics, billing, and attorney performance.
📌 SaaS Financial Model Dashboard in Power BI – Financial modeling and SaaS metrics visualization in Power BI for startups and finance teams.
📖 Click here to read the Detailed Blog Post about the Trucking and Logistics Dashboard in Power BI
🎥 Visit our YouTube channel to learn step-by-step video tutorials
👉 YouTube.com/@NextGenTemplates


Reviews
There are no reviews yet.