In the logistics world, data drives decisions. Every delivery, mile, and drop of fuel counts toward the success of your supply chain. But when reports are scattered or manually maintained, inefficiencies slip through the cracks. That’s where the Transportation Report in Excel comes to your rescue — a smart, automated, and visually rich reporting tool built for logistics professionals who need insights, not just numbers.
This ready-to-use Excel template provides real-time analytics, clear dashboards, and instant summaries — giving you full control over your transportation performance. Track deliveries, compare fuel costs with budgets, and measure on-time performance — all in one beautifully structured file.
Whether you manage a small delivery fleet or an enterprise-scale logistics operation, this tool helps you streamline performance tracking, reduce costs, and improve operational efficiency.
⚙️ Key Features of Transportation Report in Excel
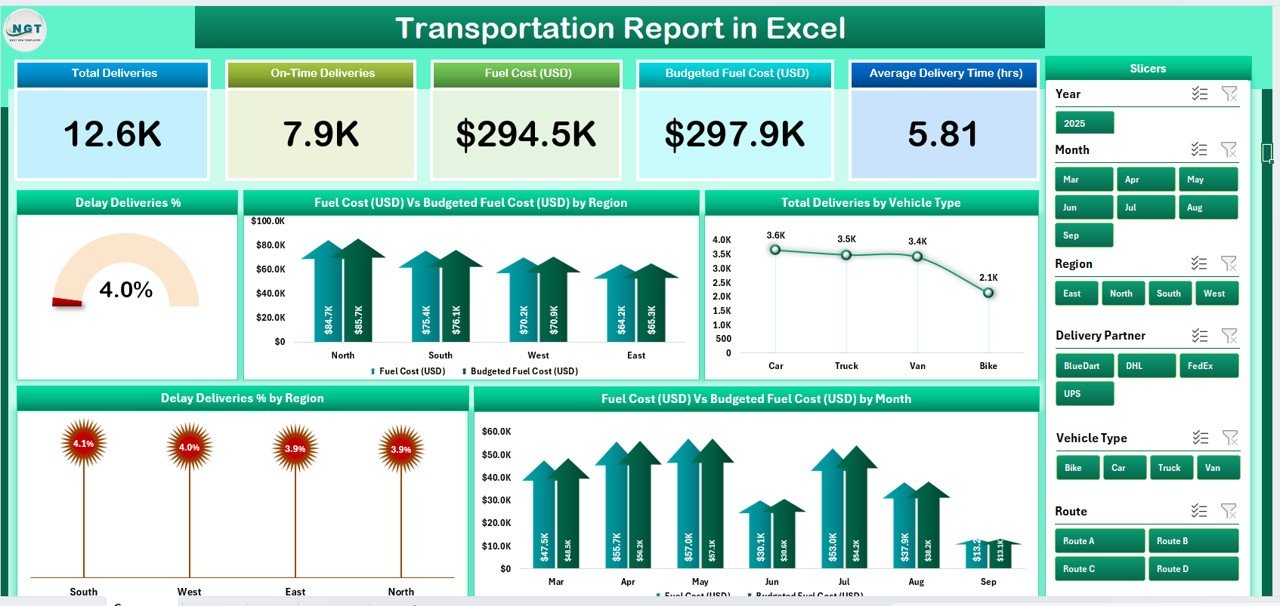
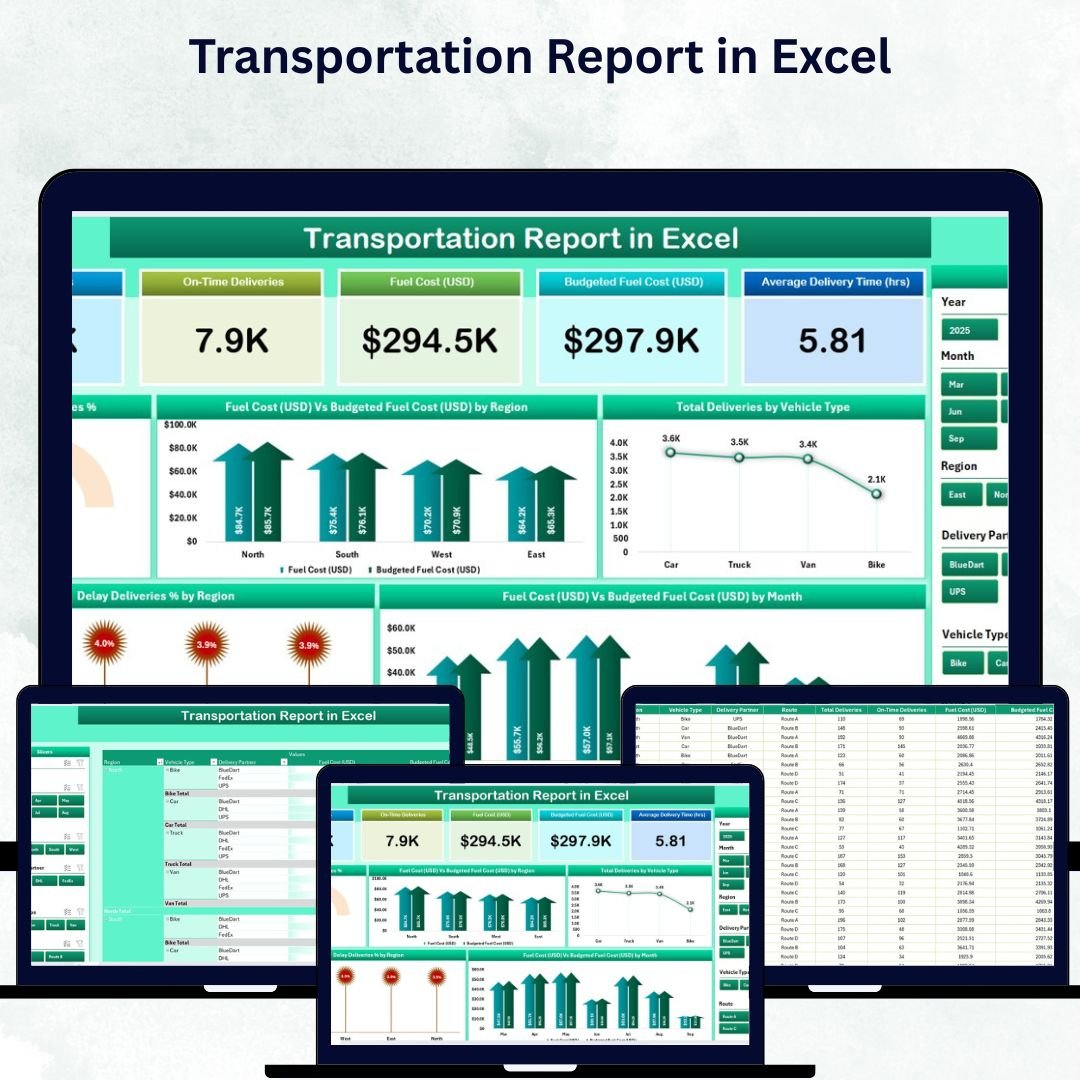
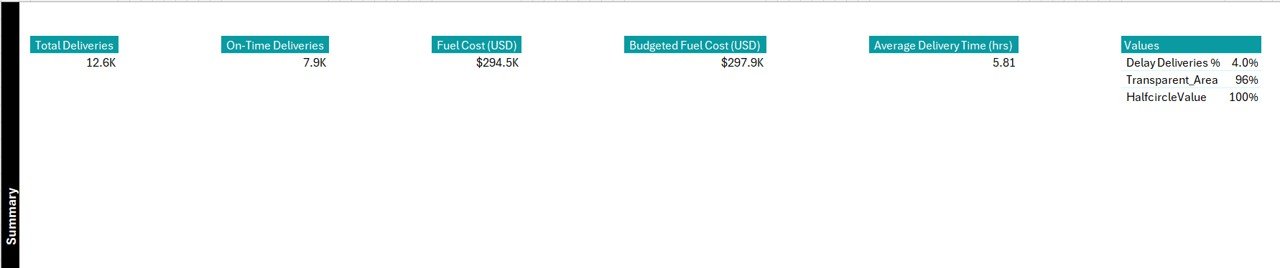
✅ 📊 Summary Dashboard – A visual command center displaying Total Deliveries, Delay %, Fuel Cost, Budget Fuel Cost, and Average Delivery Time in clean KPI cards.
✅ 📈 Interactive Charts – Get five smart visuals, including Fuel Cost vs. Budget, Deliveries by Vehicle Type, Delay % by Region, and more — updated with a single click.
✅ 🎯 Powerful Slicers – Filter by Month, Region, or Vehicle Type to instantly drill into performance data.
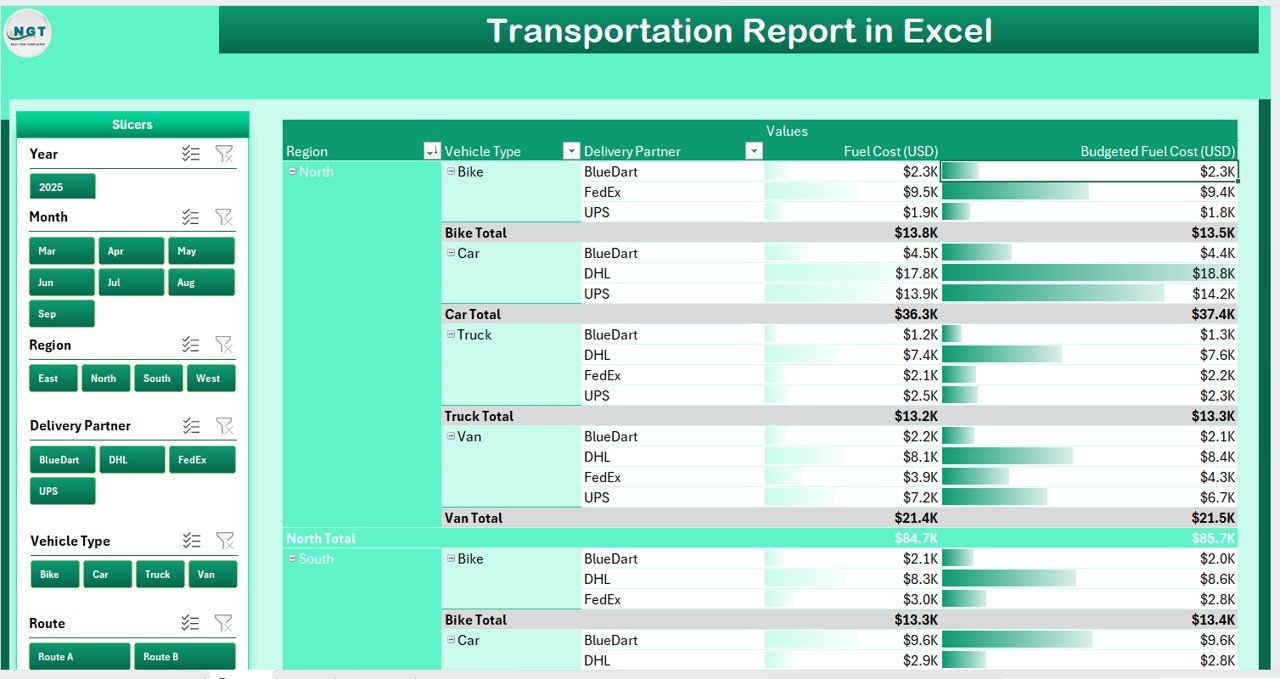
✅ 🧾 Report Page – A detailed sheet with Delivery ID, Origin, Destination, Vehicle Type, Fuel Cost, and Delivery Status for in-depth operational analysis.
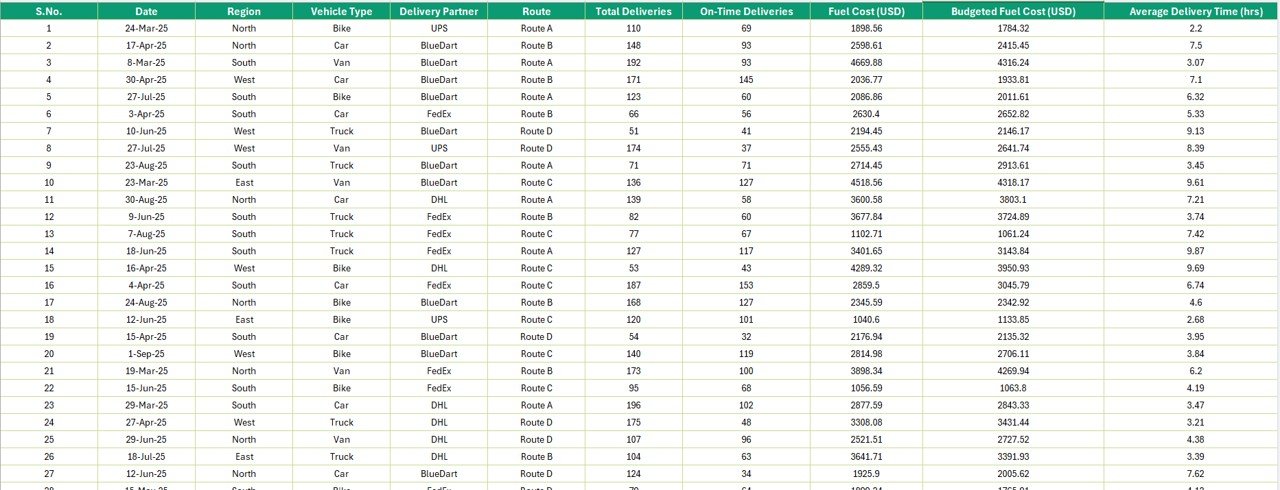
✅ 📂 Data Sheet – The backbone of your report, containing all transactional details. Update once, and watch every dashboard metric refresh automatically.
✅ 🔧 Support Sheet – Houses dropdown lists, budget references, and driver or region data — ensuring accuracy and uniformity.
✅ 💡 Automated Calculations – KPIs like Delay % and Cost Variance are calculated dynamically using Excel formulas and pivot tables.
✅ 🎨 Customizable Design – Modify KPI cards, slicer styles, or chart colors to align with your brand or reporting needs.
✅ 🔍 Real-Time Comparison – Monitor Fuel Cost vs. Budget Cost or Delivery Trends to stay ahead of potential inefficiencies.
✅ 📤 Ready for Presentation – Clean visuals and summaries make this report perfect for sharing in meetings or client reviews.
📋 What’s Inside the Transportation Report in Excel
The template includes four key sheets, each designed for a unique purpose:
📁 Summary Page: The interactive dashboard showing performance KPIs, charts, and slicers for quick insights.
📁 Report Page: A table-based analytical page that helps identify high-cost regions, delayed routes, and performance trends.
📁 Data Sheet: Stores raw transportation data such as Delivery ID, Fuel Cost, Distance, and Delivery Date.
📁 Support Sheet: Contains reference data like Vehicle Type, Region, Driver, and Fuel Budget Values.
Each section is interconnected through Excel formulas and pivot tables — making the entire report refresh automatically when new data is added.
🧭 How to Use the Transportation Report in Excel
1️⃣ Open the file in Microsoft Excel.
2️⃣ Enter new records in the Data Sheet (Delivery Date, Cost, Vehicle Type, etc.).
3️⃣ Go to the Summary Page to view updated KPIs and charts.
4️⃣ Use slicers to analyze by region, month, or vehicle type.
5️⃣ Drill down into the Report Page for detailed delivery-level insights.
6️⃣ Share or export the dashboard as a PDF or image for team meetings.
No coding or Excel expertise required — just plug in your data and get instant, professional results.
👨💼 Who Can Benefit from This Transportation Report
🚛 Logistics Managers: Gain visibility into fleet performance and delivery timelines.
📦 Operations Teams: Identify bottlenecks, delays, and cost overruns.
💰 Finance Departments: Monitor actual vs. budgeted fuel costs.
📈 Executives: Review high-level KPIs for strategic decision-making.
🧮 Analysts: Use pivot-based insights for deeper data exploration.
🏢 Small Businesses: Improve route planning and cost management without expensive software.
If your goal is to optimize transportation performance and improve profitability, this Excel report is your ultimate solution.
🔗 Click here to read the Detailed blog post
📺 Visit our YouTube channel to learn step-by-step video tutorials
👉 YouTube.com/@PKAnExcelExpert


Reviews
There are no reviews yet.