


In a fast-paced global marketplace, accurate communication across languages is key to success. Whether you manage translation projects, oversee localization workflows, or handle multilingual marketing, tracking all performance metrics manually can be challenging. That’s why we created the Translation & Localization Dashboard in Excel — a ready-to-use analytical template that simplifies multilingual project tracking, cost analysis, and performance reporting. 💼📊
This Excel-based dashboard helps you visualize translation costs, proofreading expenses, profit margins, and revenue by language, industry, and project type — all in one central workspace. With dynamic visuals, interactive slicers, and a clean, professional design, it converts raw data into actionable business insights that drive smarter decisions and higher profitability.
🌍 Key Features of the Translation & Localization Dashboard in Excel
📊 5 Analytical Pages:
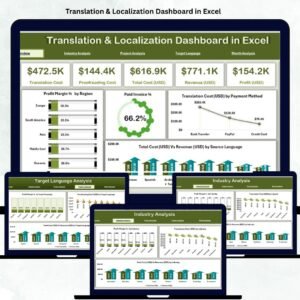
The dashboard includes five dedicated analysis pages — Overview, Industry, Project, Target Language, and Month Analysis — for complete translation performance visibility.
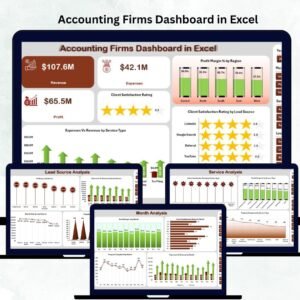
🏠 Overview Page:

Your control center for quick insights. View key KPIs like Total Revenue, Total Cost, Profit Margin %, Paid Invoice %, and Translation Volume.
Four interactive charts help you analyze:
-
Profit Margin % by Region
-
Paid Invoice %
-
Translation Cost (USD) by Payment Method
-
Total Cost vs Revenue by Source Language
🏢 Industry Analysis Page:
Evaluate profitability across sectors such as Legal, Medical, Technical, and Marketing. Discover which industries bring in the most revenue and where costs can be optimized.
📁 Project Analysis Page:
Compare projects by type — from document translation to multimedia localization. Measure Client Satisfaction (1–10), Proofreading Costs, and Profitability by Project Type to identify what’s working best.
🗣️ Target Language Analysis Page:
Analyze performance by language pair. Track Profit Margin %, Proofreading Cost (USD), and Revenue vs Cost by Target Language to pinpoint high-value and high-cost translation pairs.
📅 Month Analysis Page:
Understand seasonal demand and project performance trends with visuals for Translation Cost, Proofreading Cost, and Revenue vs Total Cost by Month. Perfect for forecasting and resource planning.
🧾 Dynamic KPI Cards & Slicers:
Switch views easily using filters for month, year, industry, or language. Each page includes automatic pivot-based visuals that update instantly when new data is added.
📦 What’s Inside the Translation & Localization Dashboard
✅ Overview Page: Central performance view with KPIs and charts.
✅ Industry Analysis: Profitability by business sector.
✅ Project Analysis: Deep dive into project-type efficiency.
✅ Target Language Analysis: Track margins by language pair.
✅ Month Analysis: See trends and seasonality.
✅ Support & Data Sheet: Source data hub that drives all analytics automatically.
All visuals and metrics refresh automatically when the Data Sheet is updated — ensuring accurate, real-time reporting with no manual effort.
🧭 How to Use the Translation & Localization Dashboard in Excel
🪄 Step 1: Enter your data (industry, language, costs, revenue, satisfaction) in the Data Sheet.
🪄 Step 2: Refresh pivots using Data → Refresh All.
🪄 Step 3: Navigate between pages using the left-hand Page Navigator.
🪄 Step 4: Use slicers to filter by month, client, industry, or target language.
🪄 Step 5: Review KPIs and charts to identify high-performing sectors and improvement areas.
Everything updates automatically — no coding or advanced Excel skills required! 💡
👥 Who Can Benefit from This Dashboard
🌐 Translation Agencies: Track translator productivity, revenue, and profitability by project.
💬 Localization Teams: Manage multilingual workflows and control costs efficiently.
🧑💼 Corporate Departments: Monitor internal translation spending across business units.
📚 Freelance Translators: Analyze personal project data, client performance, and profit trends.
This Excel dashboard empowers professionals to make data-backed decisions while improving transparency and accuracy across projects.
🌟 Why Choose This Excel Dashboard
✔️ Ready-to-use — no macros, no setup hassle.
✔️ Real-time data updates with dynamic visuals.
✔️ Fully customizable KPIs and charts.
✔️ Perfect for agencies, freelancers, and global companies.
✔️ Professional design, easy to share, and scalable as your business grows.
The Translation & Localization Dashboard in Excel transforms complex translation data into simple, strategic insights. It’s your go-to solution for accurate reporting, efficient cost control, and smarter localization planning. 🌎📈


Reviews
There are no reviews yet.