The Toy Manufacturing KPI Dashboard moves fast. Trends change overnight. Seasonal demand spikes before holidays. Retail pressure increases every quarter. Therefore, toy manufacturers must monitor production, quality, inventory, and delivery performance in real time to stay competitive.
However, many factories still rely on scattered Excel sheets and manual reports. As a result, managers miss early warning signs. Production delays increase. Defect rates rise. Inventory holding costs grow.
That is exactly why the Toy Manufacturing KPI Dashboard in Power BI becomes a game-changing operational tool 🏭📊.
This ready-to-use Power BI dashboard transforms raw Excel production data into powerful, interactive, and executive-ready insights. Instead of reviewing multiple reports, you track KPIs in one centralized dashboard. With built-in MTD (Month-to-Date) and YTD (Year-to-Date) comparisons, plus Current Year vs Previous Year analysis, you gain full visibility into factory performance.
Because Power BI updates visuals dynamically, leadership teams make faster, data-driven decisions that improve efficiency and profitability.
🔑 Key Features of Toy Manufacturing KPI Dashboard in Power BI
📊 Interactive Summary Page
Get a high-level performance overview with slicers and KPI cards.
📅 MTD & YTD Tracking Logic
Monitor both monthly and cumulative yearly performance clearly.
🎯 Target vs Actual Comparison
Instantly see which KPIs meet or miss targets.
📈 Year-over-Year Performance Analysis
Compare Current Year vs Previous Year trends.
🔺 Visual Performance Indicators
Green ▲ and Red ▼ icons highlight KPI status instantly.
📉 Detailed KPI Trend Page
Analyze monthly movement with combo charts.
🔍 Drill-Through KPI Definition Page
View KPI formulas, logic, and definitions with one click.
📦 What’s Inside the Toy Manufacturing KPI Dashboard in Power BI
This dashboard includes 3 structured analytical pages, each designed for strategic performance monitoring.
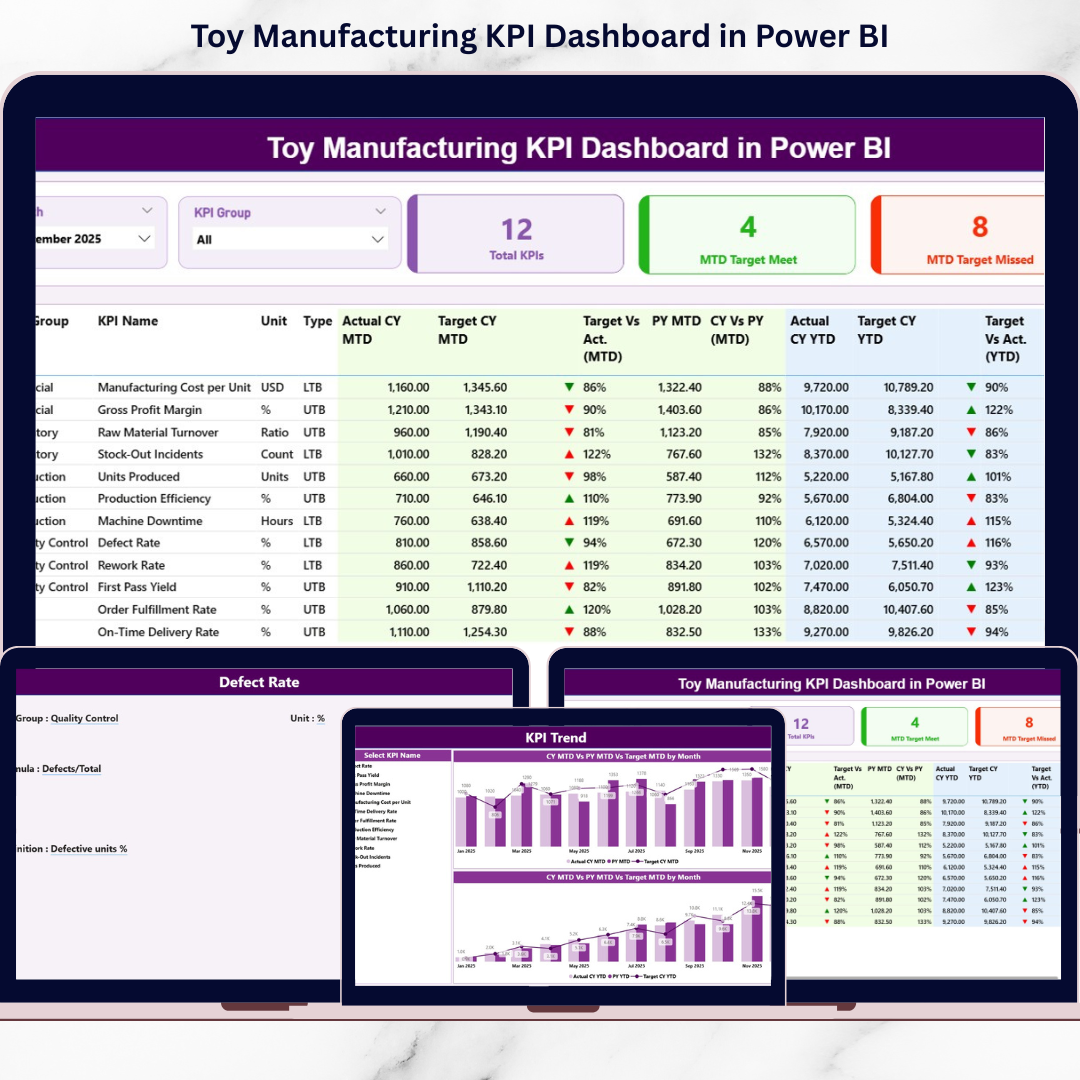
1️⃣ Summary Page – The Control Center
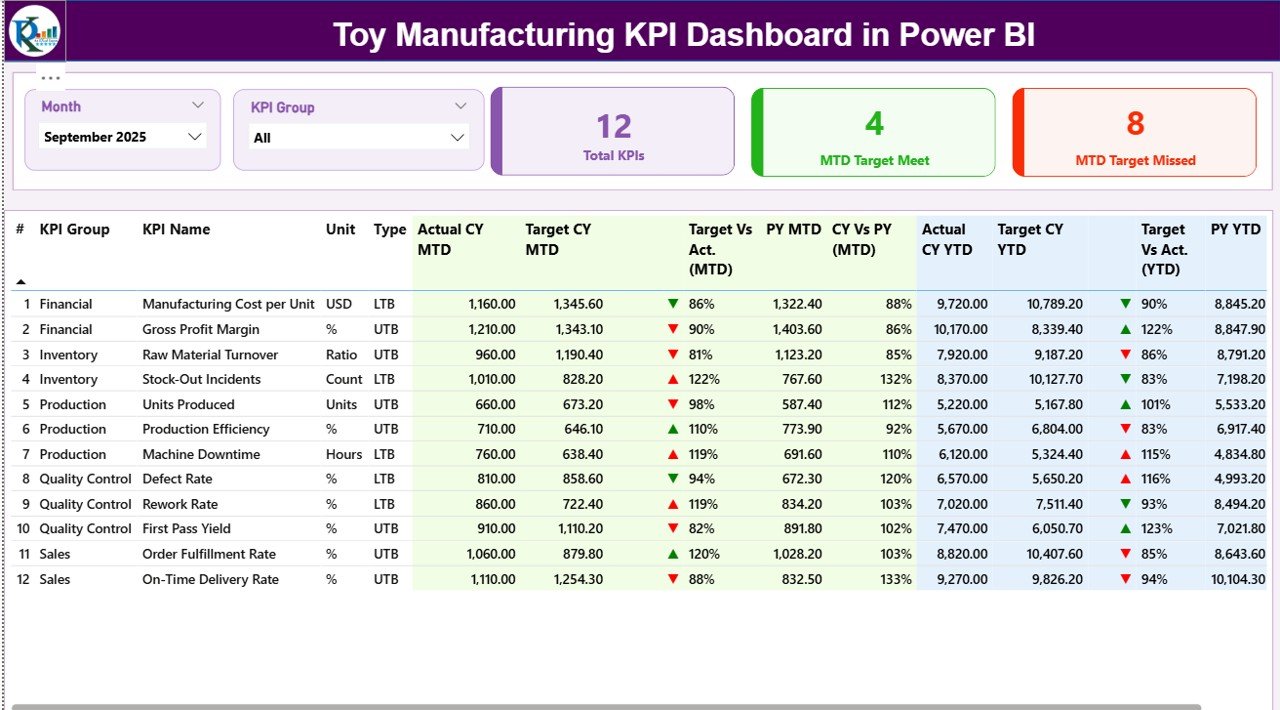
The Summary Page provides an executive overview.
🔹 Top Section Includes:
-
Month slicer
-
KPI Group slicer
-
KPI Cards:
-
Total KPIs Count
-
MTD Target Meet Count
-
MTD Target Missed Count
-
🔹 Detailed KPI Table Includes:
-
KPI Number
-
KPI Group
-
KPI Name
-
Unit
-
Type (LTB / UTB)
MTD Metrics:
-
Actual CY MTD
-
Target CY MTD
-
MTD Icon
-
Target vs Actual (%)
-
PY MTD
-
CY vs PY (%)
YTD Metrics:
-
Actual CY YTD
-
Target CY YTD
-
YTD Icon
-
Target vs Actual (%)
-
PY YTD
-
CY vs PY (%)
Because all comparisons appear in one place, managers identify underperforming KPIs immediately.
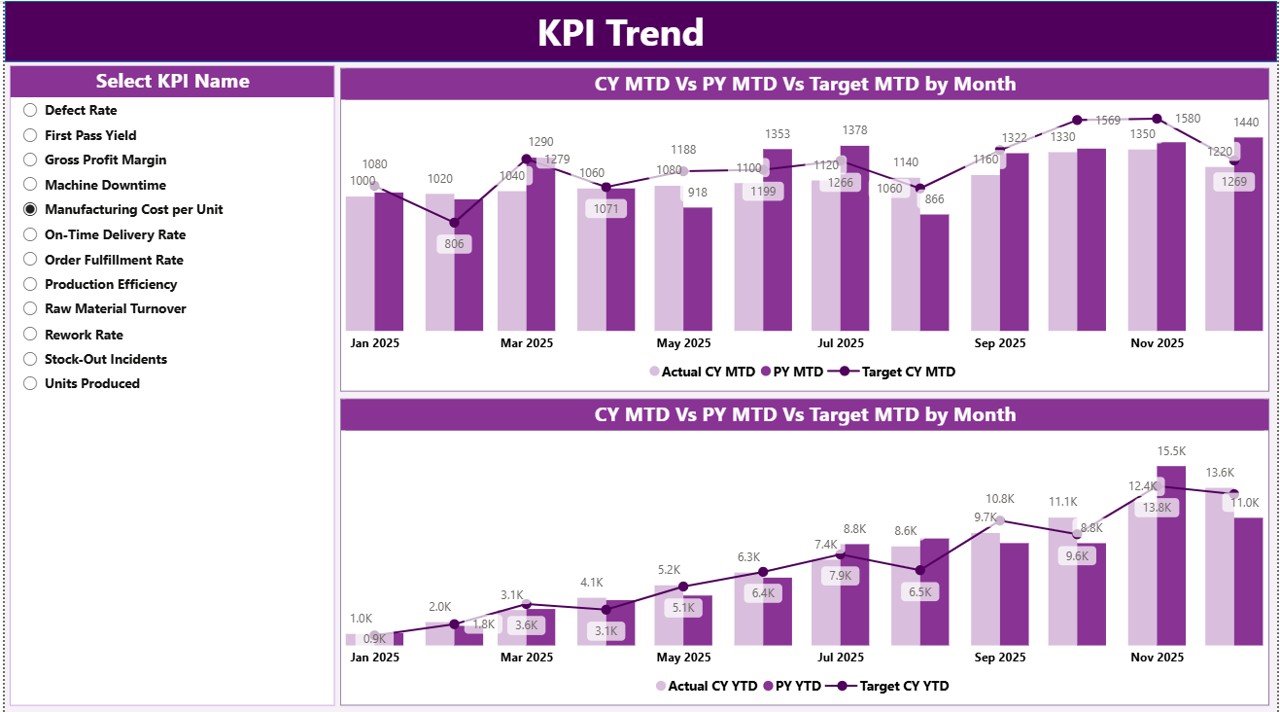
2️⃣ KPI Trend Page – Performance Over Time
This page helps analyze performance movement.
📊 Two Combo Charts Display:
-
Current Year Actual
-
Previous Year Actual
-
Target
For both:
-
MTD Analysis
-
YTD Analysis
With the KPI slicer, users select any KPI and instantly review historical trends. This makes forecasting and capacity planning easier.
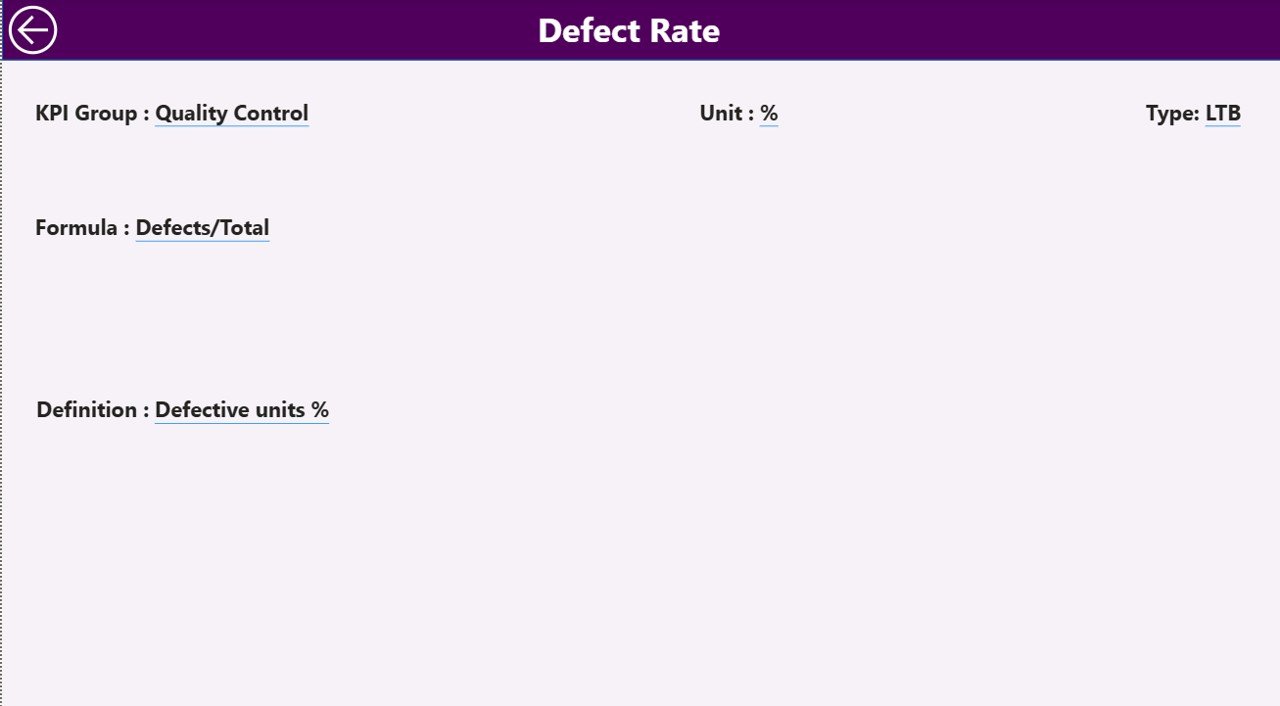
3️⃣ KPI Definition Page – Transparency & Governance
This hidden drill-through page contains:
-
KPI Formula
-
KPI Definition
-
KPI Group
-
Unit
-
KPI Type
Because KPI documentation remains centralized, teams avoid confusion and maintain reporting consistency.
🛠️ How to Use the Toy Manufacturing KPI Dashboard in Power BI
1️⃣ Prepare Excel file (Input_Actual, Input_Target, KPI Definition)
2️⃣ Enter MTD & YTD performance numbers
3️⃣ Define targets and KPI logic
4️⃣ Connect Excel file to Power BI
5️⃣ Refresh dashboard
6️⃣ Use slicers to analyze performance
7️⃣ Review target gaps and trends
8️⃣ Take corrective production actions
Within minutes, your operational data becomes strategic intelligence.
👥 Who Can Benefit from This Toy Manufacturing KPI Dashboard in Power BI
🏭 Toy Factory Owners
📦 Production Managers
🔍 Quality Control Teams
📊 Operations Heads
🚚 Supply Chain Managers
💰 Financial Controllers
If you manage production, quality, inventory, or delivery performance, this dashboard strengthens operational control.