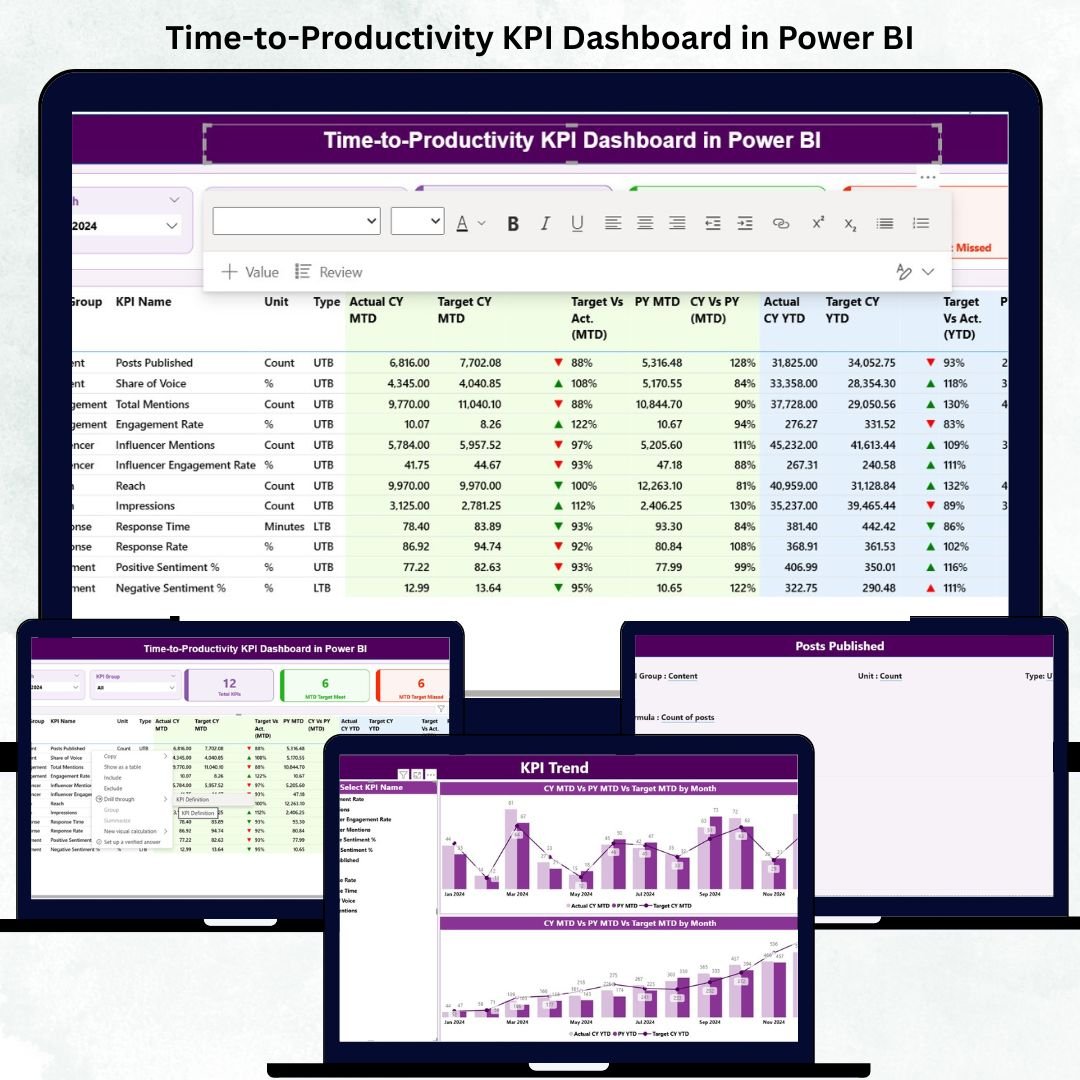

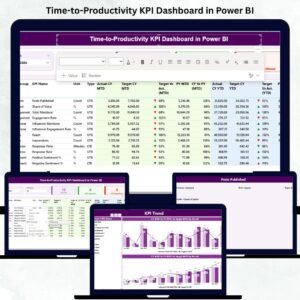
In today’s competitive business environment, time is money — and productivity is the currency that drives growth. ⏱️ The Time-to-Productivity KPI Dashboard in Power BI is your all-in-one solution to measure, visualize, and enhance how quickly new employees reach their full performance potential.
Built with the powerful capabilities of Microsoft Power BI and seamlessly integrated with Excel, this ready-to-use dashboard empowers HR teams, business analysts, and decision-makers to make smarter, faster, and data-backed workforce decisions.
✨ Key Features of Time-to-Productivity KPI Dashboard in Power BI
✅ Interactive Visuals – View all productivity metrics through intuitive visuals like cards, tables, and trend charts. Easily filter data by Month or KPI Group.
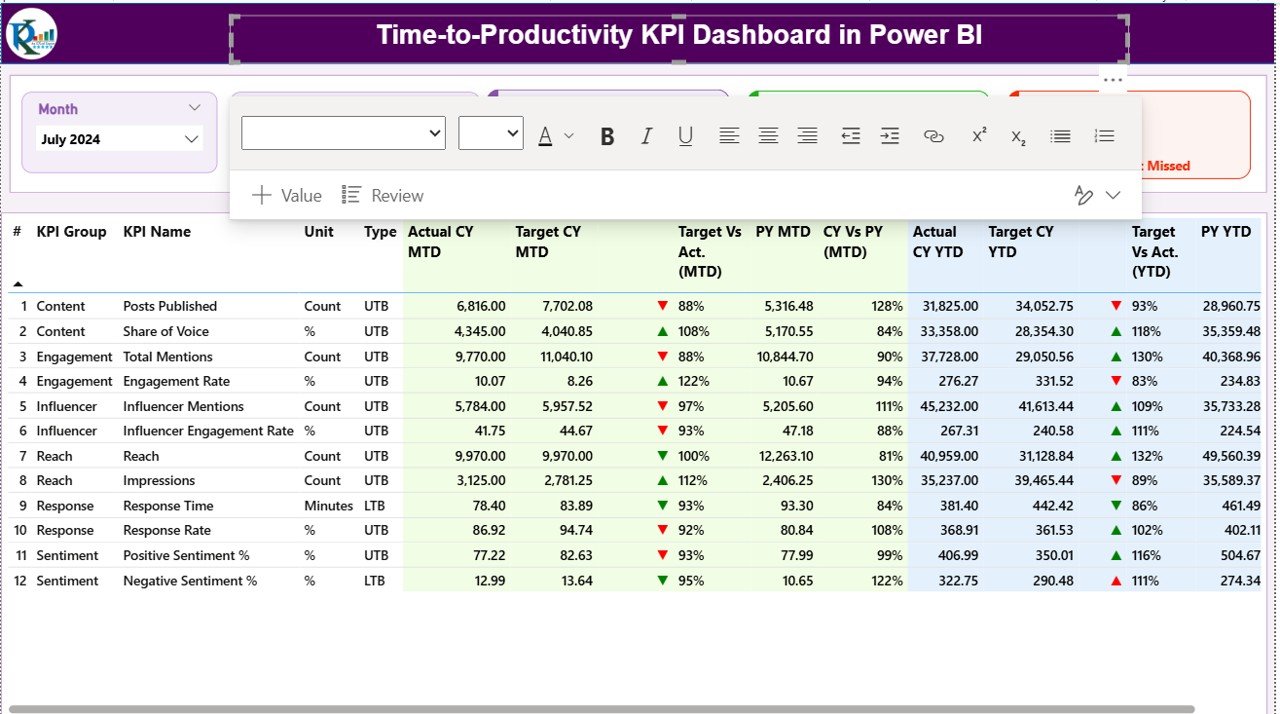
✅ Real-Time Performance Insights – Track Month-to-Date (MTD) and Year-to-Date (YTD) KPIs to instantly see where your teams are excelling or lagging.
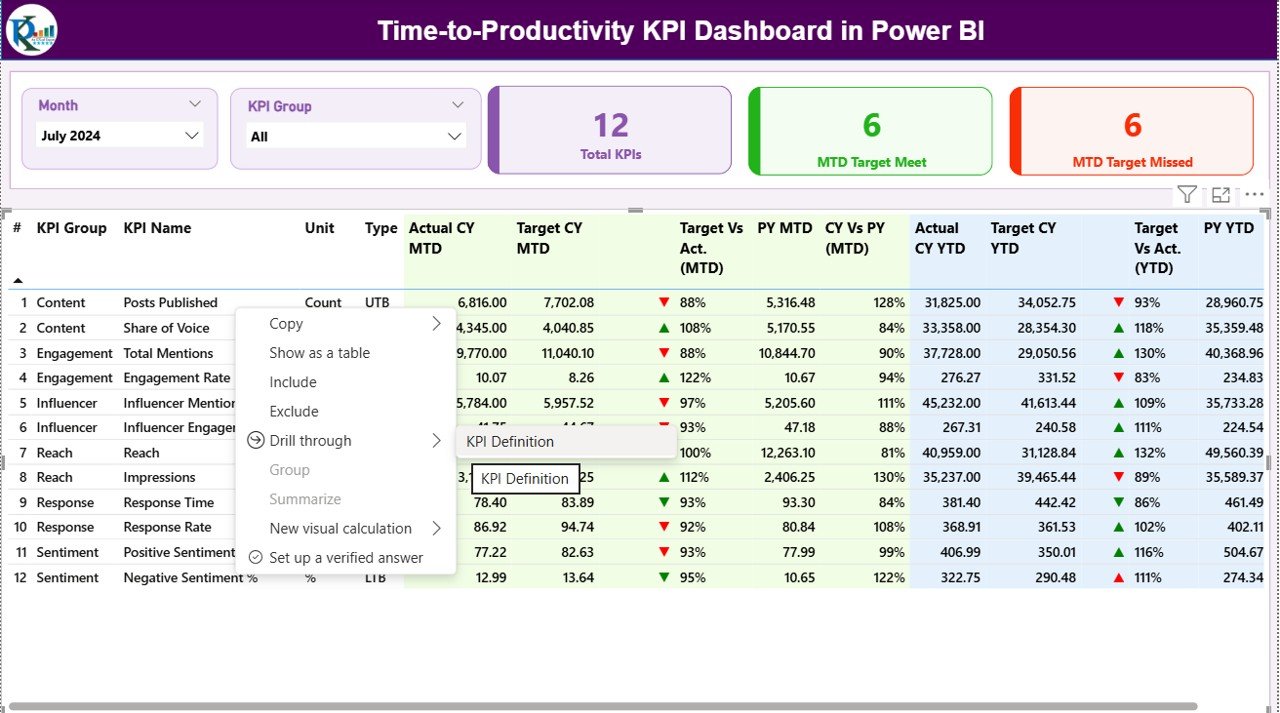
✅ Drill-Through Functionality – Click on any KPI to view its detailed definition, formula, and type — ensuring complete transparency and clarity.
✅ Excel Data Integration – The dashboard connects directly to structured Excel sheets for Actual, Target, and KPI Definitions — making updates simple and error-free.
✅ KPI Comparison Tools – Monitor Current Year vs. Previous Year performance with dynamic visuals to measure improvement over time.
✅ Target Achievement Indicators – Use icons (▲▼) and color-coded visuals to quickly identify which KPIs are meeting or missing targets.
✅ Departmental & Temporal Analysis – Evaluate performance by department, role, or time period to find trends that matter most.
✅ Completely Customizable – Add, edit, or remove KPIs based on your organization’s requirements without any coding.
📦 What’s Inside the Time-to-Productivity KPI Dashboard
Inside this professionally designed Power BI dashboard, you’ll find:
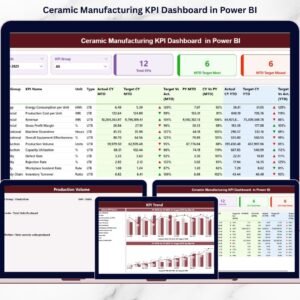
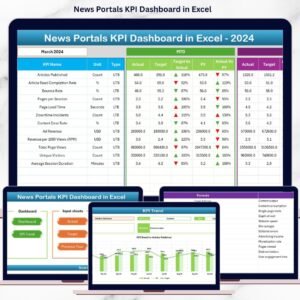
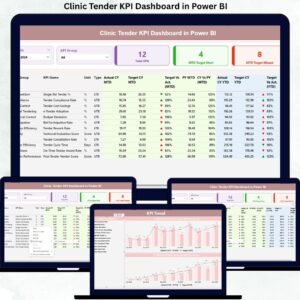
1️⃣ Summary Page – A bird’s-eye view of total KPIs, MTD target achievements, and missed targets — all with slicers for flexible filtering.
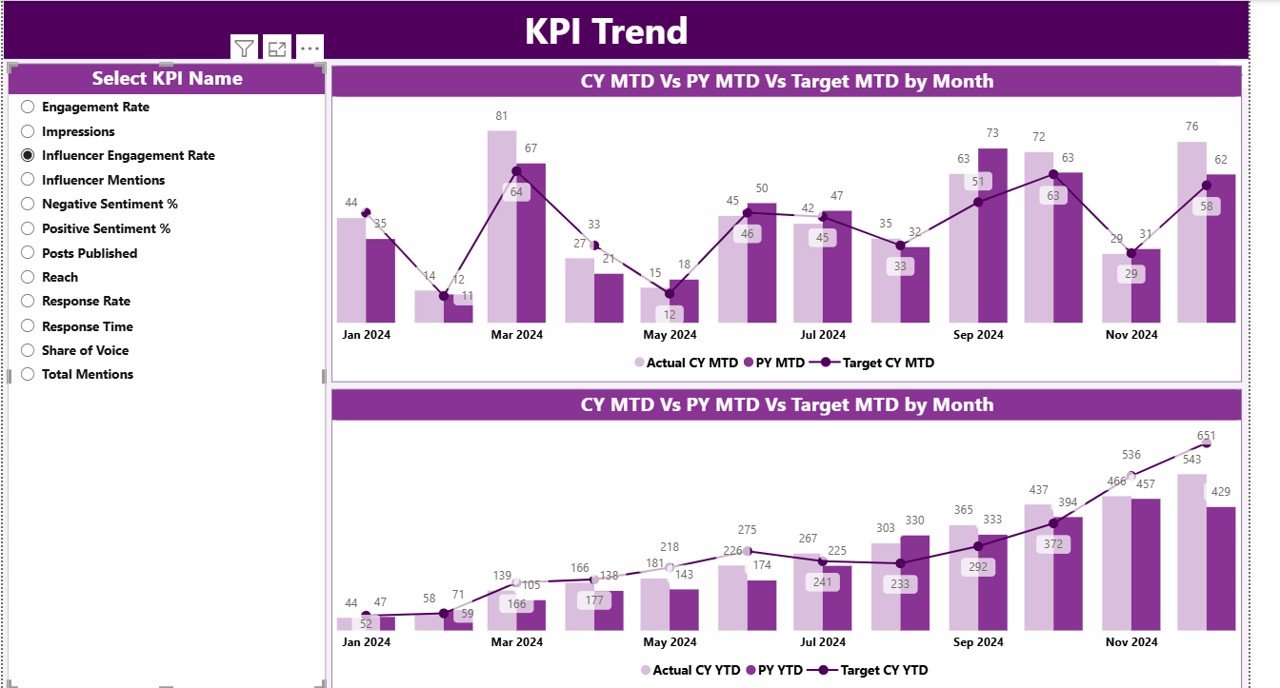
2️⃣ KPI Trend Page – Combo charts that visually compare performance trends (MTD/YTD) against targets for each KPI, enabling deeper insight into performance patterns.
3️⃣ KPI Definition Page – A detailed reference sheet accessible via drill-through that displays KPI name, formula, unit, and type for quick understanding.
📊 Excel Source Sheets Include:
-
Input_Actual Sheet: Stores MTD/YTD actuals by KPI and Month.
-
Input_Target Sheet: Maintains targets with matching structure for performance comparison.
-
KPI Definition Sheet: Holds metadata like KPI Number, Group, Formula, and Type.
Together, these components ensure smooth data flow, dynamic updates, and total transparency — ideal for maintaining data consistency across HR, training, and leadership teams.
⚙️ How to Use the Time-to-Productivity KPI Dashboard
🚀 Step 1: Update your Excel sheets (Actual, Target, KPI Definition) with current month data.
📈 Step 2: Refresh the Power BI dashboard to automatically load new values.
🎯 Step 3: Use slicers to analyze Month, Department, or KPI Group.
🔍 Step 4: Click on any KPI to drill through its definition and measurement logic.
📅 Step 5: Compare Current Year (CY) vs. Previous Year (PY) data to track year-over-year improvement.
💡 Step 6: Use icons and visuals to communicate results instantly to management.
This interactive workflow eliminates manual reporting and helps organizations stay focused on performance improvement rather than data compilation.
👥 Who Can Benefit from This Dashboard
👩💼 HR Professionals: Gain insights into onboarding effectiveness and employee ramp-up timelines.
📊 Business Analysts: Analyze performance metrics to identify improvement opportunities.
🏢 Department Heads: Monitor how quickly new hires in their teams reach expected productivity levels.
💼 Executives and Leadership Teams: View summarized productivity data for strategic workforce planning.
🎓 Training and Development Managers: Evaluate how training programs impact employee efficiency.
Whether you’re managing a small HR team or leading a multinational enterprise, this dashboard transforms data into actionable insight — driving real business outcomes.


Reviews
There are no reviews yet.