Running a thrift store successfully is not just about donations and pricing—it is about tracking the right numbers at the right time. Many thrift store owners struggle because their data lives in scattered spreadsheets, manual reports, and delayed summaries. As a result, profits leak silently, inefficiencies grow, and decisions rely on assumptions instead of facts.
That is exactly why the Thrift Stores KPI Dashboard in Excel is a game-changing solution.
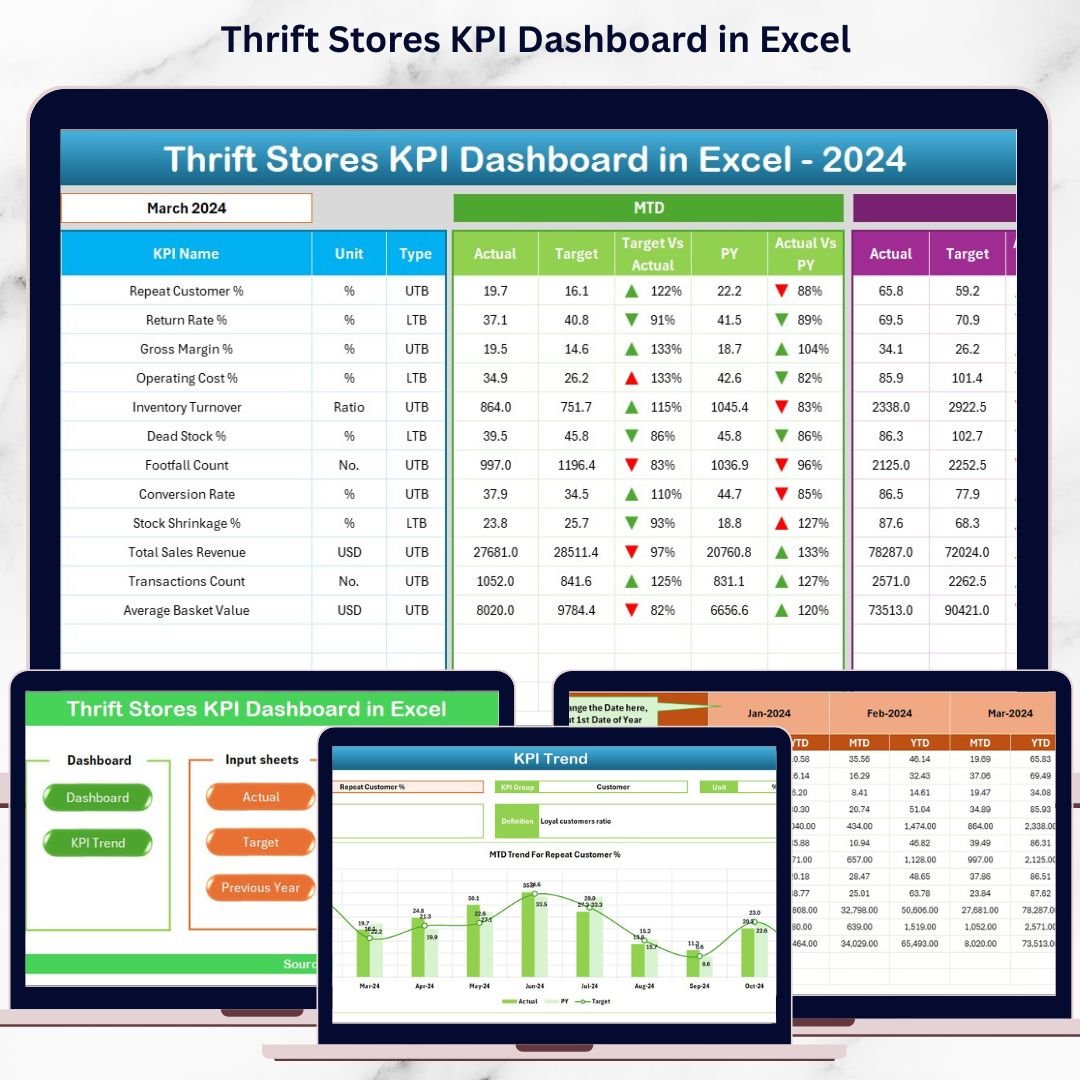
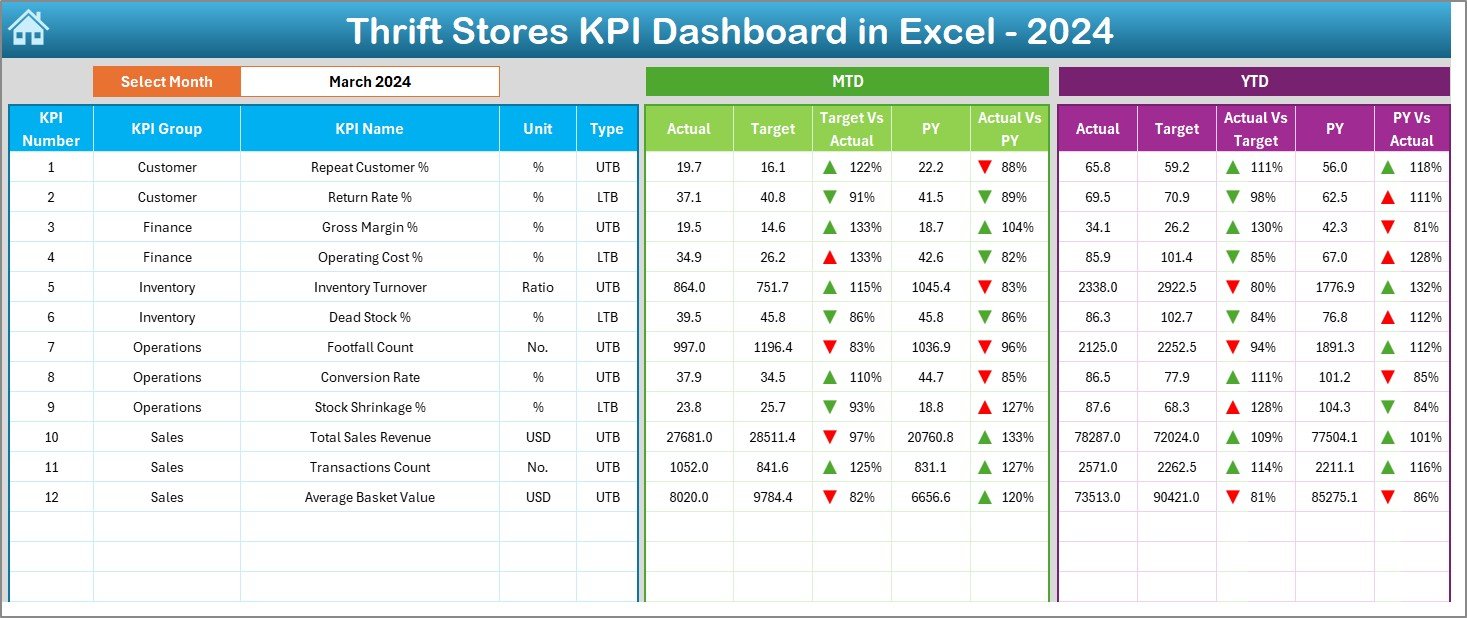
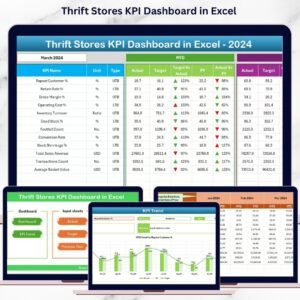
This ready-to-use Excel dashboard converts raw operational data into clear KPIs, visual trends, and performance comparisons—all in one place. Instead of spending hours building reports, you can instantly understand how your store is performing, where targets are missed, and what actions to take next.
Designed for simplicity and power, this dashboard helps thrift store owners, managers, and non-profit retail teams gain clarity, control, and confidence in their decisions—without expensive BI tools or advanced Excel skills.
🔑 Key Feature of Thrift Stores KPI Dashboard in Excel
✨ Centralized KPI Monitoring – Track all critical thrift store KPIs in one structured dashboard.
📅 Monthly & YTD Analysis – Instantly view Month-to-Date and Year-to-Date performance.
🎯 Target vs Actual Comparison – Clearly see gaps between planned targets and real results.
📊 Previous Year Benchmarking – Compare current performance with last year’s numbers.
🚦 Visual Performance Indicators – Conditional formatting with up/down arrows for quick insights.
🧭 Single-Click Navigation – Jump between sheets using an intuitive summary page.
📝 Easy Data Entry – Simple input sheets reduce errors and save reporting time.
⚙️ Fully Customizable in Excel – Modify KPIs, targets, and layouts as your business grows.
📦 What’s Inside the Thrift Stores KPI Dashboard in Excel
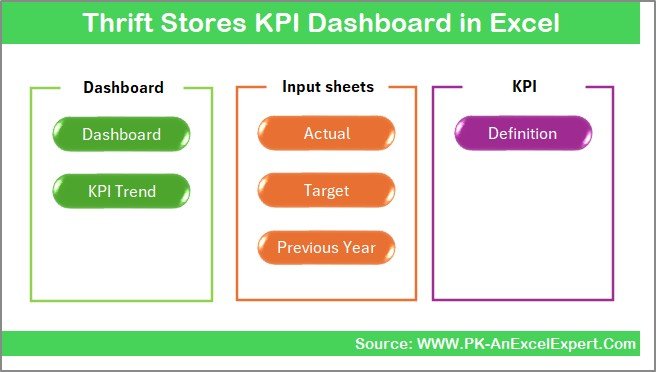
This dashboard includes 7 professionally designed worksheets, each serving a clear business purpose:
📌 Summary Page – Navigation hub with buttons to access all dashboard sections.
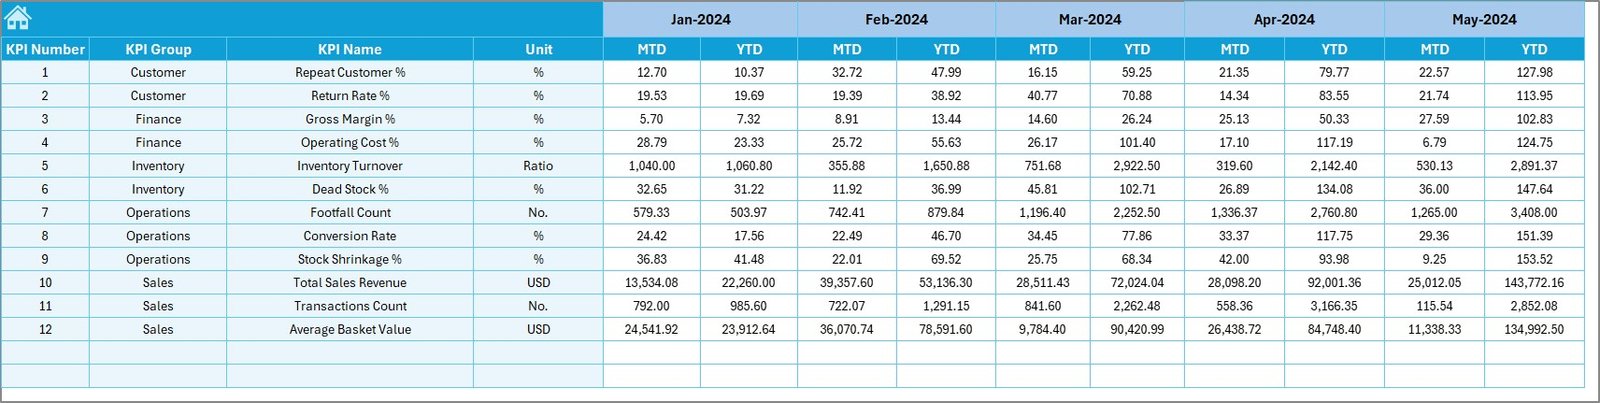
📌 Dashboard Sheet – The main KPI view showing MTD & YTD Actual, Target, and Previous Year values.
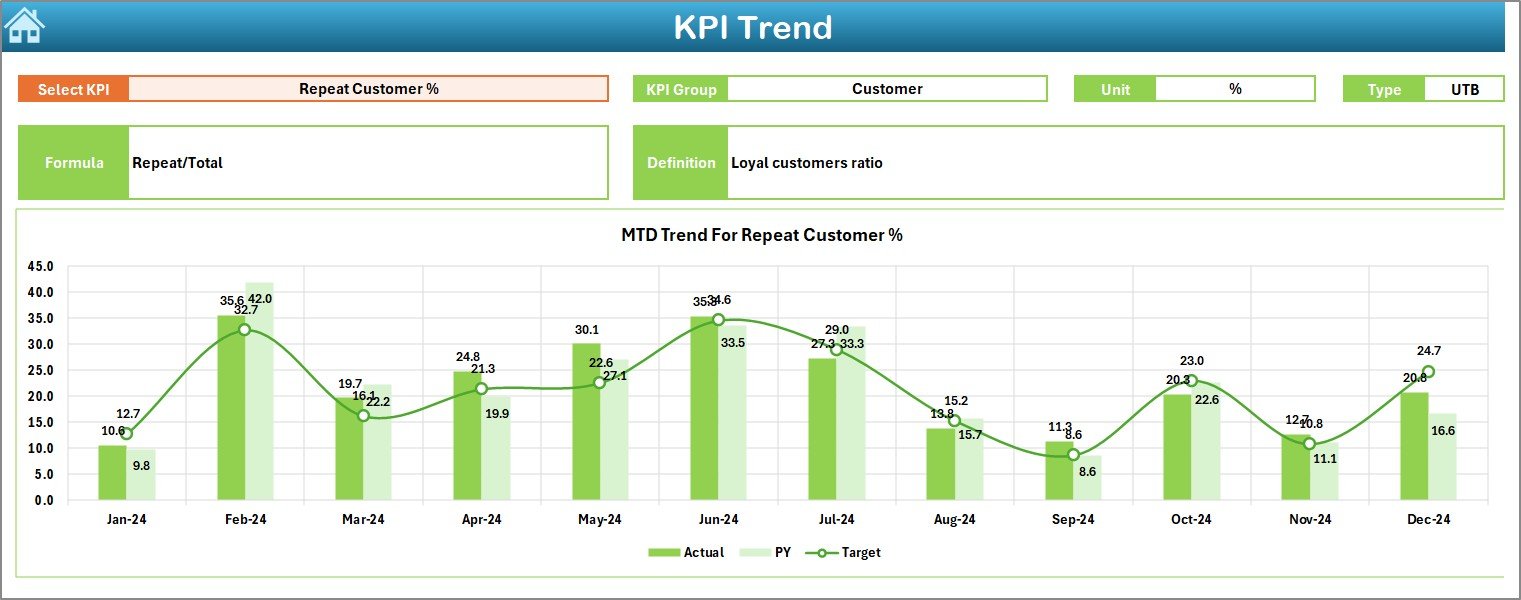
📌 Trend Sheet – KPI-level trend analysis with charts for long-term performance tracking.
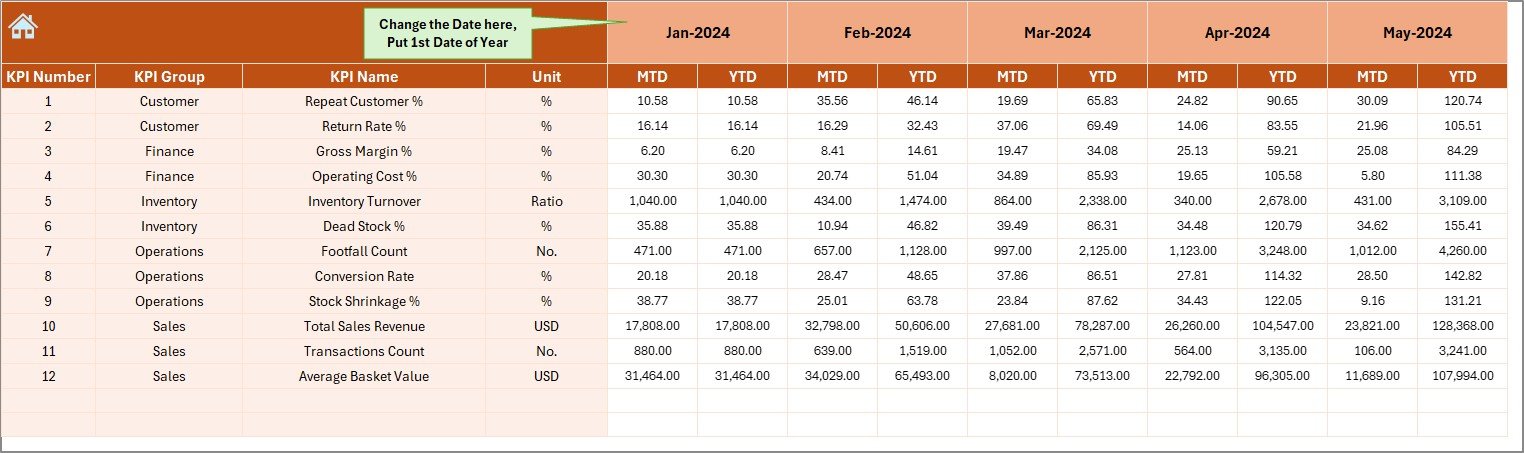
📌 Actual Numbers Sheet – Clean structure for entering monthly and yearly actual values.
📌 Target Sheet – Define and update KPI targets for performance measurement.
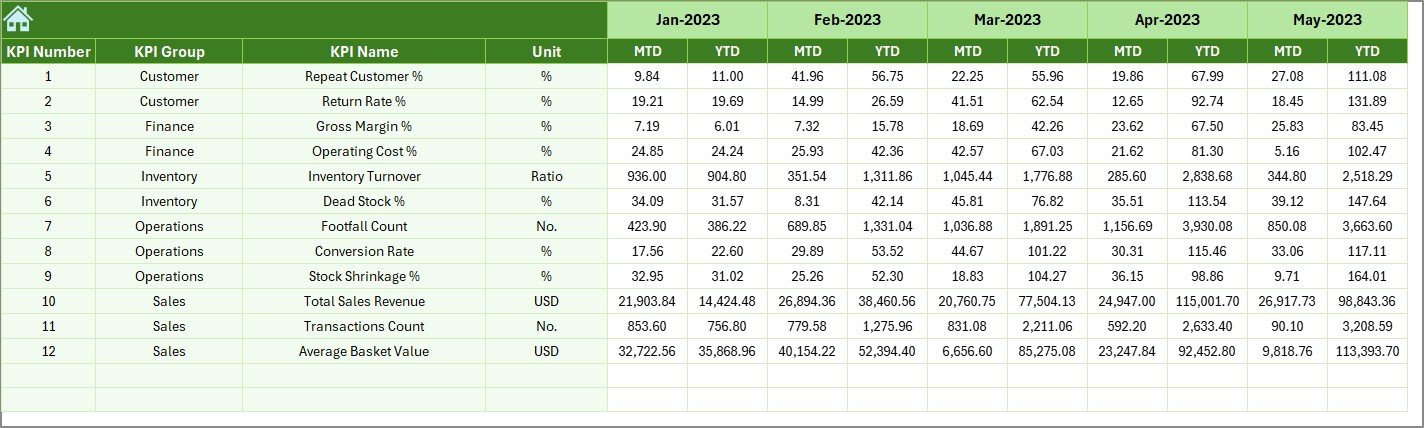
📌 Previous Year Sheet – Store historical KPI data for accurate year-over-year comparison.
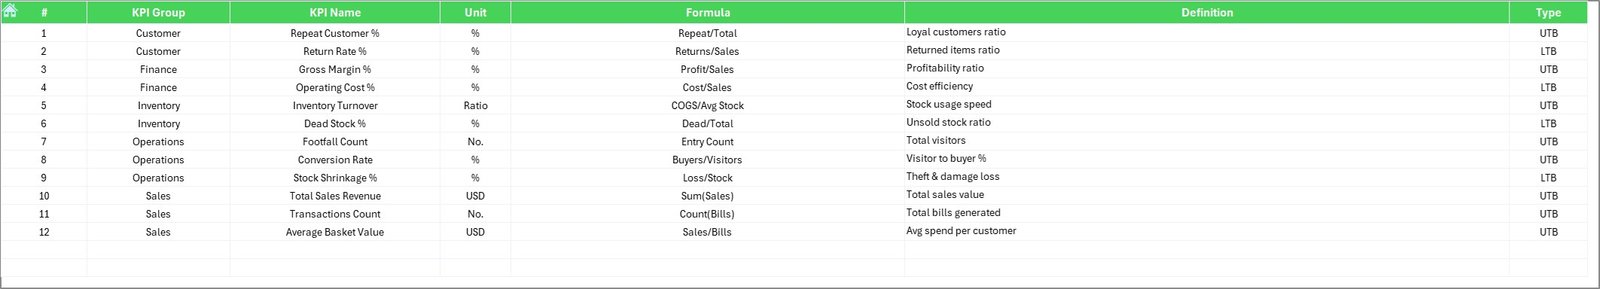
📌 KPI Definition Sheet – Central reference for KPI names, formulas, units, and definitions.
Together, these sheets form a complete thrift store performance management system.
🛠️ How to Use the Thrift Stores KPI Dashboard in Excel
Using this dashboard is simple—even for beginners:
1️⃣ Enter your actual KPI values in the Actual Numbers sheet.
2️⃣ Define monthly or annual targets in the Target sheet.
3️⃣ Add previous year data once for benchmarking.
4️⃣ Select a month from the drop-down on the Dashboard sheet (cell D3).
5️⃣ Instantly view updated KPIs, comparisons, and visual indicators.
6️⃣ Use the Trend sheet to analyze long-term performance patterns.
No formulas to build. No reports to design. The dashboard does the work for you.
👥 Who Can Benefit from This Thrift Stores KPI Dashboard in Excel
🏪 Thrift Store Owners – Gain full visibility into store performance and profitability.
📋 Store Managers – Track KPIs, targets, and trends without manual reporting.
💰 Finance & Accounting Teams – Monitor margins, costs, and efficiency accurately.
📦 Operations Managers – Identify inefficiencies and improve workflow decisions.
🌍 Non-Profit Retail Organizations – Improve accountability and performance transparency.
📊 Excel-Based Businesses – Ideal for teams that prefer Excel over complex BI tools.
Click here to read the Detailed blog post
Watch the step-by-step video tutorial:


Reviews
There are no reviews yet.