The Textiles & Apparel Manufacturing Dashboard industry operates under constant pressure to reduce costs, improve efficiency, and respond quickly to market demand. Every day, manufacturers track production volumes, unit costs, selling prices, regional performance, and monthly trends. However, when this critical data remains spread across multiple spreadsheets, reporting becomes slow, confusing, and unreliable.
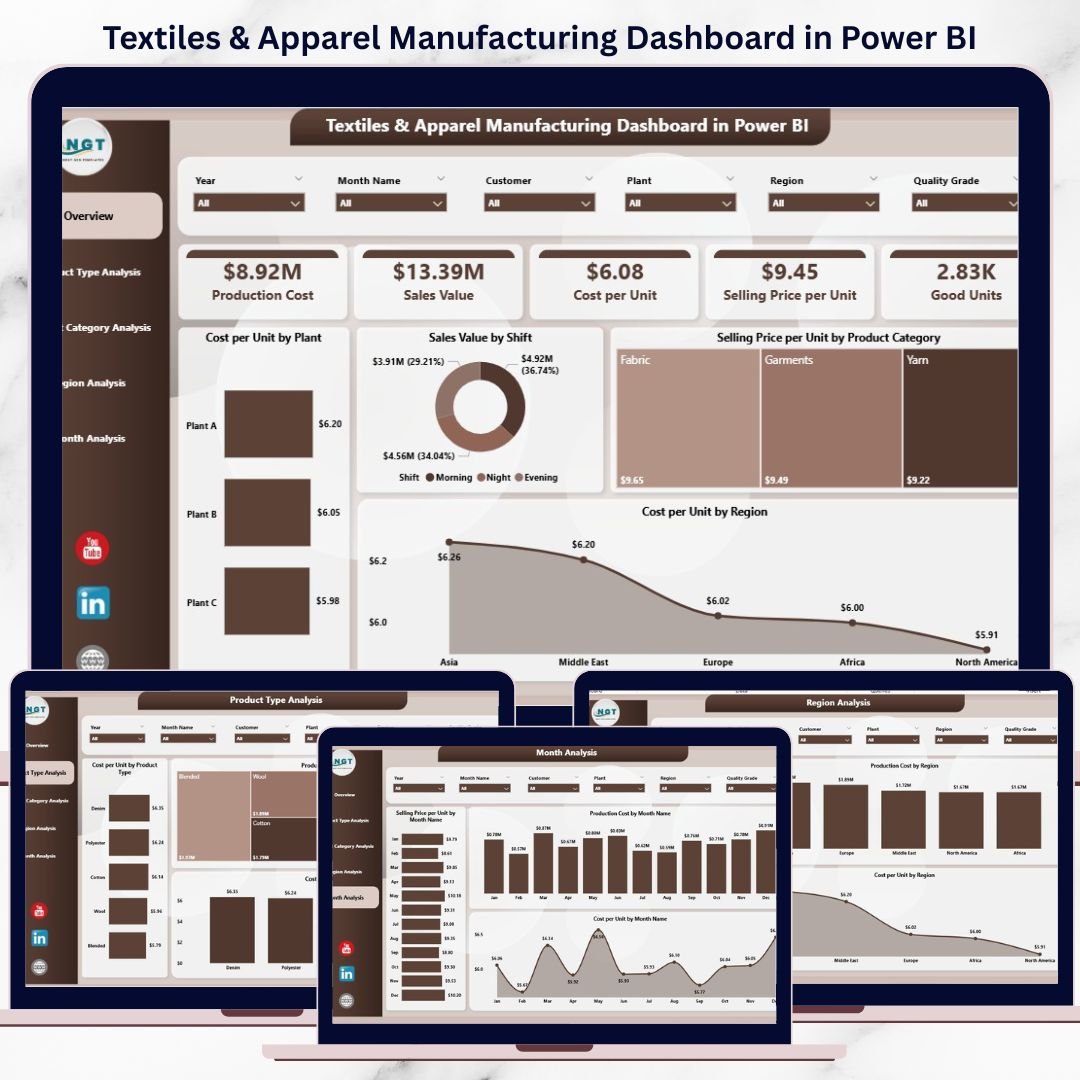
That is where the Textiles & Apparel Manufacturing Dashboard in Power BI delivers exceptional value 🚀. This ready-to-use Power BI dashboard converts raw manufacturing data into interactive visuals, KPI cards, and dynamic analysis pages. Instead of manually preparing reports, decision-makers gain instant visibility into performance and can act faster with confidence.
Built specifically for textile and apparel manufacturers, this dashboard helps businesses control production costs, optimize pricing, and improve profitability using real-time, visual insights.
🔑 Key Features of Textiles & Apparel Manufacturing Dashboard in Power BI
📊 5 Interactive Analytical Pages – Overview, Product Type, Product Category, Region, and Month Analysis
🎯 Advanced Slicers & Filters – Analyze data by plant, product, category, region, and time
📈 Dynamic KPI Cards – Monitor cost per unit, production cost, and selling price instantly
🔍 Drill-Down Analysis – Explore performance at deeper levels without rebuilding reports
⚡ High-Performance Power BI Model – Handles large manufacturing datasets smoothly
🔄 Real-Time & Scheduled Refresh – Always work with the latest data
🌍 Multi-Dimensional Insights – Compare performance across regions and plants
🧩 Scalable & Customizable – Easily extend with additional KPIs and metrics
This dashboard gives manufacturers speed, clarity, and control in one powerful Power BI solution.
📂 What’s Inside the Textiles & Apparel Manufacturing Dashboard
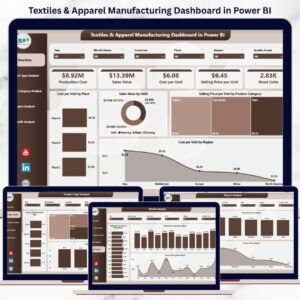
📌 Overview Page
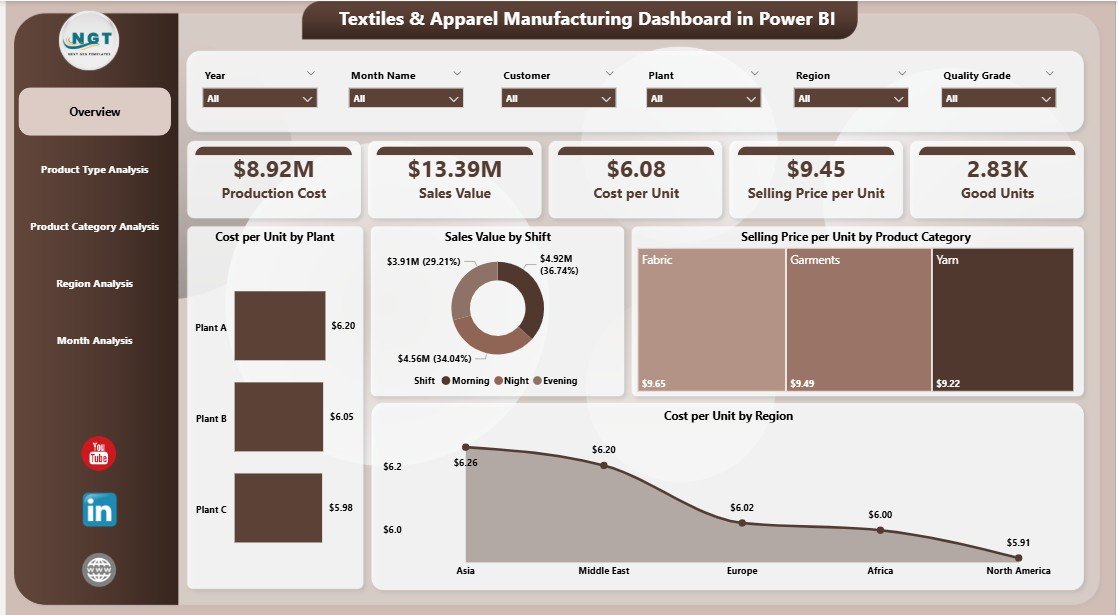
Provides a high-level summary with charts like cost per unit by plant, sales value by shift, selling price by product category, and cost per unit by region.
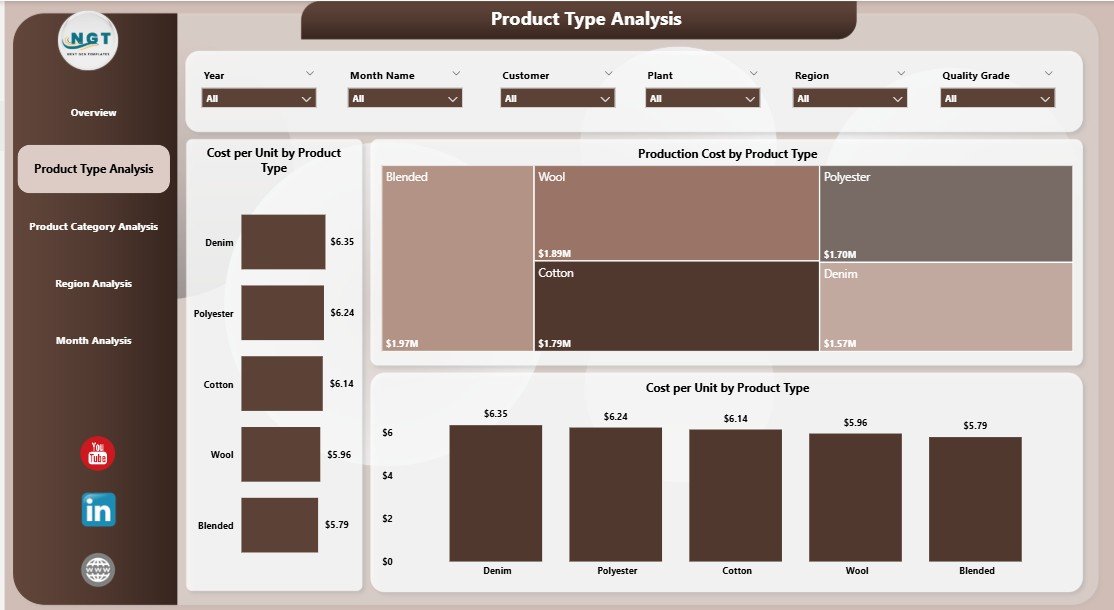
🧵 Product Type Analysis Page
Analyzes production cost and unit cost across product types such as yarn, fabric, garments, or accessories.
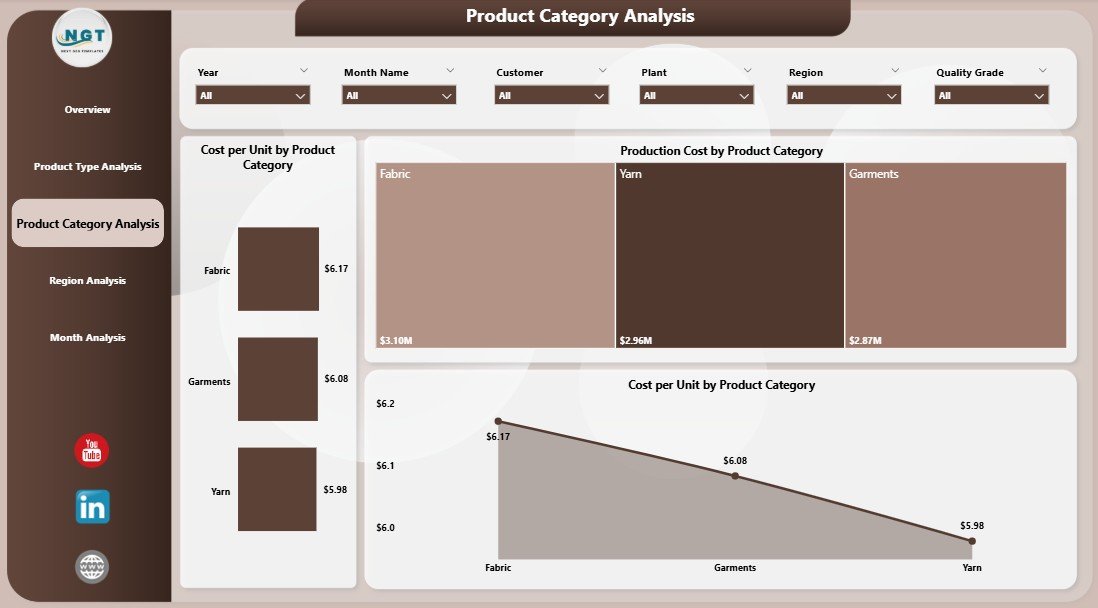
👕 Product Category Analysis Page
Breaks down cost performance by categories to identify high-cost and high-margin segments.
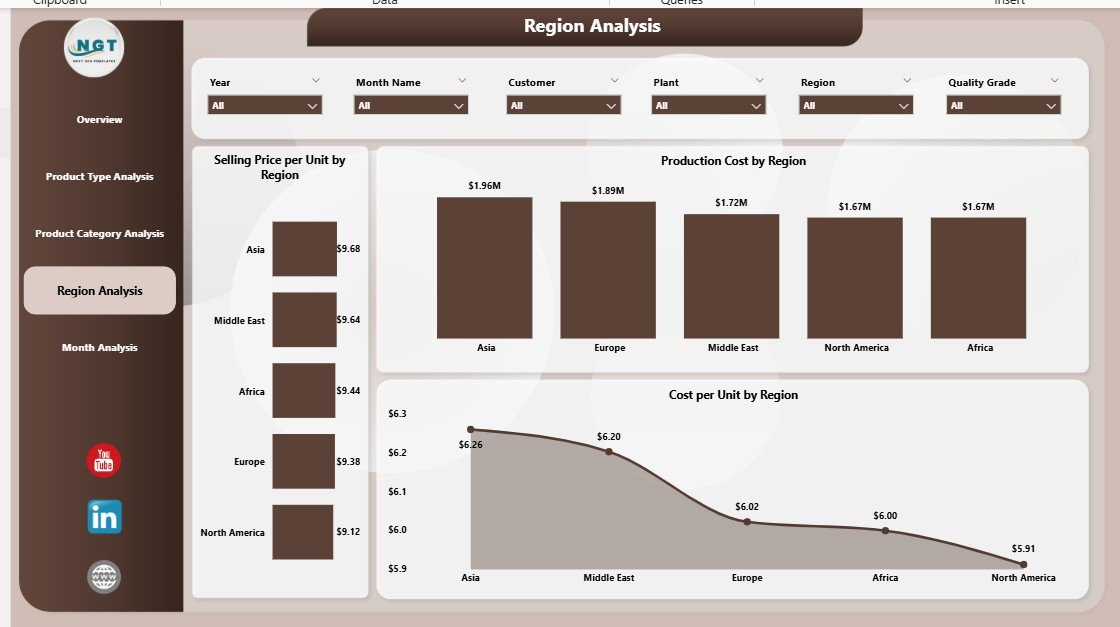
🌍 Region Analysis Page
Compares selling price, production cost, and cost per unit across regions to support pricing and expansion decisions.
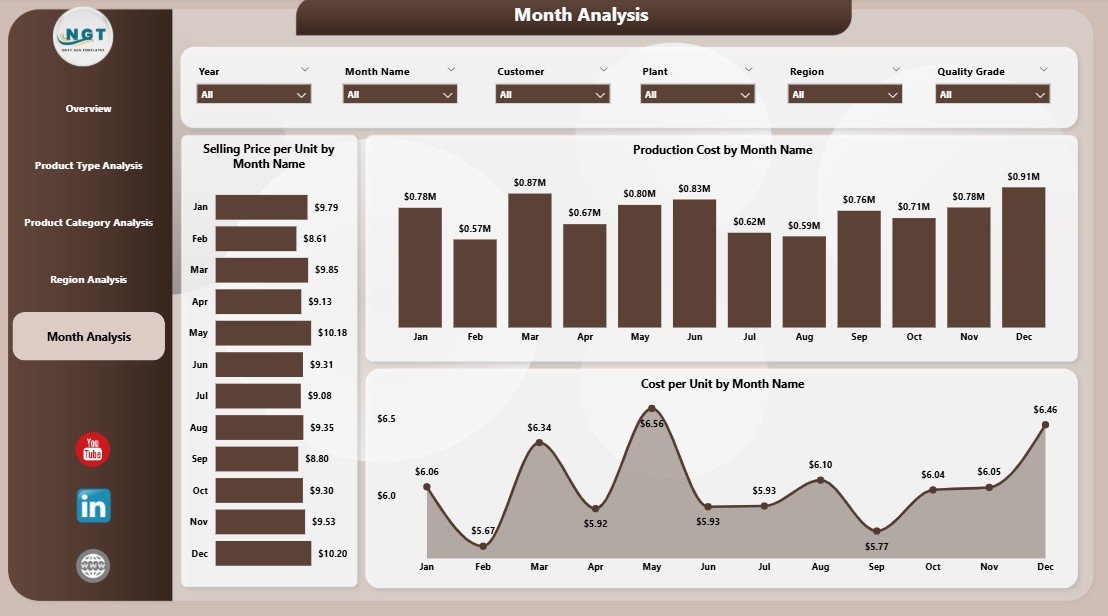
📆 Month Analysis Page
Tracks cost and price trends over time to reveal seasonal patterns and support forecasting.
Each page delivers clear insights with interactive visuals, helping teams move from data to decisions faster.
🛠️ How to Use the Textiles & Apparel Manufacturing Dashboard
✅ Connect your production and cost data
✅ Refresh the dataset in Power BI
✅ Use slicers to filter by product, region, or month
✅ Drill down into visuals for deeper analysis
✅ Share insights securely with stakeholders
No complex setup is required. The dashboard is business-ready and user-friendly, even for non-technical users.
👥 Who Can Benefit from This Textiles & Apparel Manufacturing Dashboard?
🏭 Textile & Apparel Manufacturers
📊 Plant & Production Managers
💰 Finance & Cost Control Teams
📦 Operations & Supply Chain Teams
📈 Business Owners & Executives
Whether you manage one factory or multiple plants, this dashboard scales with your business.
👉 Click here to read the Detailed blog post
▶️ Visit our YouTube channel to learn step-by-step video tutorials
https://youtube.com/@PKAnExcelExpert


Reviews
There are no reviews yet.