

Telecommunications companies operate in one of the most data-intensive industries in the world. Every day, teams track network performance, service quality, customer experience, and revenue metrics. However, when KPIs are scattered across multiple spreadsheets or reviewed through static reports, critical insights get missed. As a result, performance issues remain hidden and decisions are delayed.
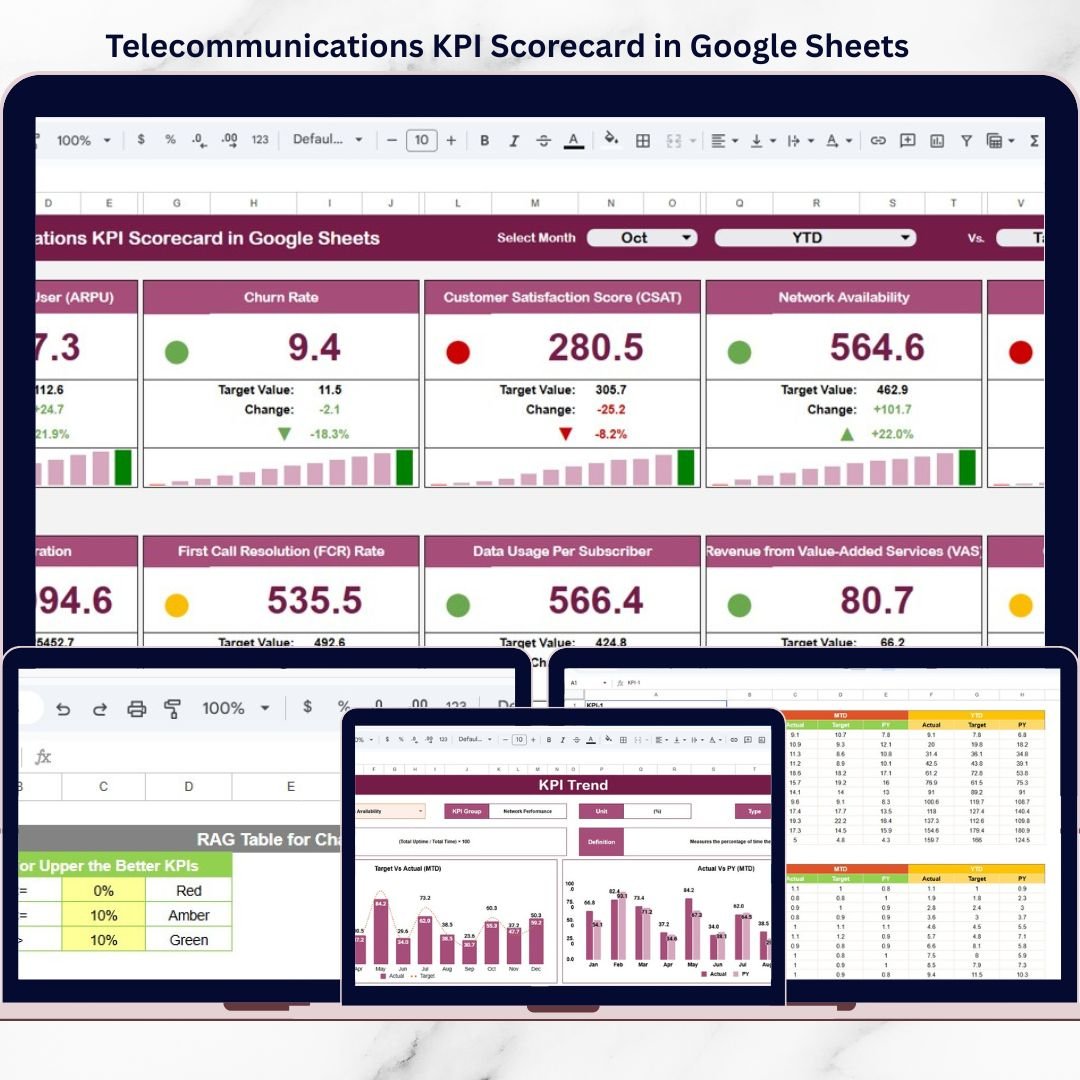
The Telecommunications KPI Scorecard in Google Sheets is a ready-to-use performance tracking solution designed to simplify KPI monitoring, improve visibility, and accelerate decision-making for telecom teams.
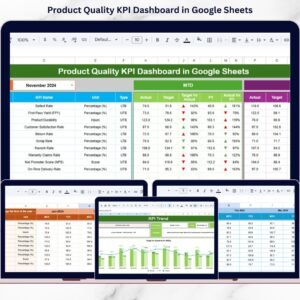
Instead of complex dashboards or expensive BI tools, this scorecard delivers a clean, visual, and automated KPI framework directly inside Google Sheets. With built-in calculations, traffic lights, trend analysis, and MTD/YTD views, teams can instantly understand performance and take action—without technical complexity.
🚀 Key Features of Telecommunications KPI Scorecard in Google Sheets
📊 Monthly & Yearly KPI Tracking – Monitor telecom KPIs using both MTD and YTD views
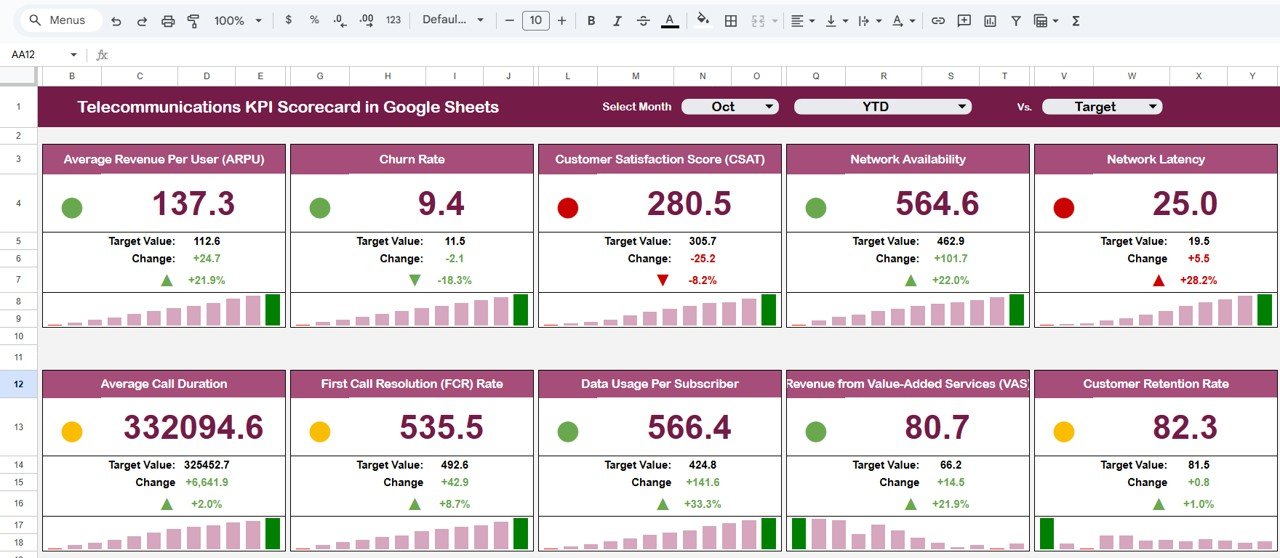
🚦 Dynamic Traffic Light Indicators – Instantly identify good, average, and poor performance
⬆️⬇️ Up & Down Arrows with % Change – Track performance movement at a glance
📅 Month Selection Drop-Down – Switch between months instantly
🔁 Automatic Calculations – No manual formulas or recalculations required
📈 Dedicated Trend Sheet – Analyze KPI performance over time
📘 KPI Definition Sheet – Maintain clarity with standardized KPI definitions
🎨 Custom Color Settings – Align performance thresholds with business rules
☁️ Google Sheets Based – Real-time collaboration and access from anywhere
📦 What’s Inside the Telecommunications KPI Scorecard
This digital product includes a professionally structured Google Sheets template with multiple purpose-built tabs.
🔹 KPI Scorecard Sheet
-
Displays 10 telecom KPIs
-
Month selector for dynamic updates
-
Traffic lights and arrows update automatically
-
One-click switch between MTD and YTD performance
🔹 Trend Sheet Tab
-
KPI selector (Cell C3)
-
Displays:
-
KPI Group
-
KPI Unit
-
KPI Type (Lower the Better / Upper the Better)
-
-
Helps identify performance patterns and long-term trends
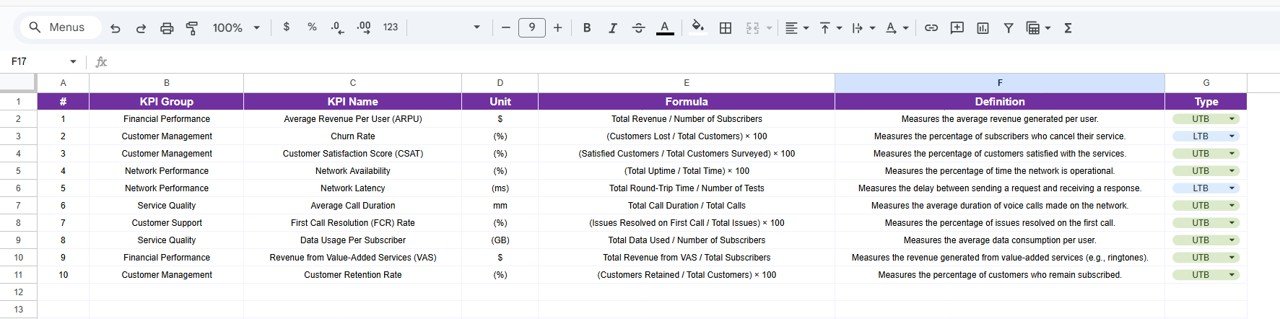
🔹 KPI Definition Sheet
-
Captures:
-
KPI Name
-
KPI Group
-
Unit
-
Formula
-
Definition
-
Ensures consistent KPI interpretation across teams.
🔹 Data Input Sheet
-
Main data entry area
-
Users update KPI values periodically
-
All calculations and visuals update automatically
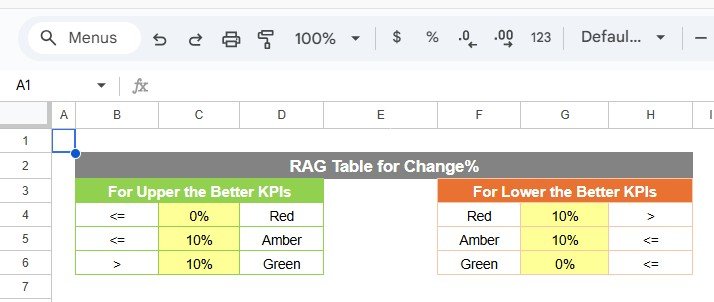
🔹 Color Settings Section
-
Controls traffic light thresholds
-
Allows full customization of performance logic
🧭 How to Use the Telecommunications KPI Scorecard
Using this scorecard is simple and intuitive:
1️⃣ Enter KPI values in the Data Input Sheet
2️⃣ Define KPIs clearly in the KPI Definition Sheet
3️⃣ Select the desired month from the drop-down
4️⃣ Switch between MTD and YTD views
5️⃣ Review traffic lights and arrows to assess performance
6️⃣ Use the Trend Sheet for deeper analysis
No advanced formulas. No dashboards to build. Just clean, actionable insights.
🎯 Who Can Benefit from This Telecommunications KPI Scorecard?
This scorecard is ideal for:
✔ Telecom Operations Teams – Monitor daily and monthly performance
✔ Network Performance Managers – Track reliability and efficiency KPIs
✔ Customer Service Leaders – Analyze service quality trends
✔ Finance & Revenue Teams – Review growth and efficiency metrics
✔ Senior Management – Gain quick, high-level performance visibility
Both technical and non-technical users can use it with ease.
🔗 Click here to read the Detailed blog post
Watch the step-by-step video tutorial:


Reviews
There are no reviews yet.