Telecommunications infrastructure is the foundation of reliable connectivity. Network uptime, capacity utilization, fault resolution, and maintenance performance directly influence service quality and customer trust. However, when infrastructure KPIs are spread across multiple spreadsheets or reviewed through static reports, performance gaps remain hidden and corrective actions get delayed.
The Telecommunications Infrastructure KPI Dashboard in Google Sheets is a ready-to-use, interactive solution designed to centralize infrastructure KPIs, automate performance tracking, and highlight issues before they escalate.
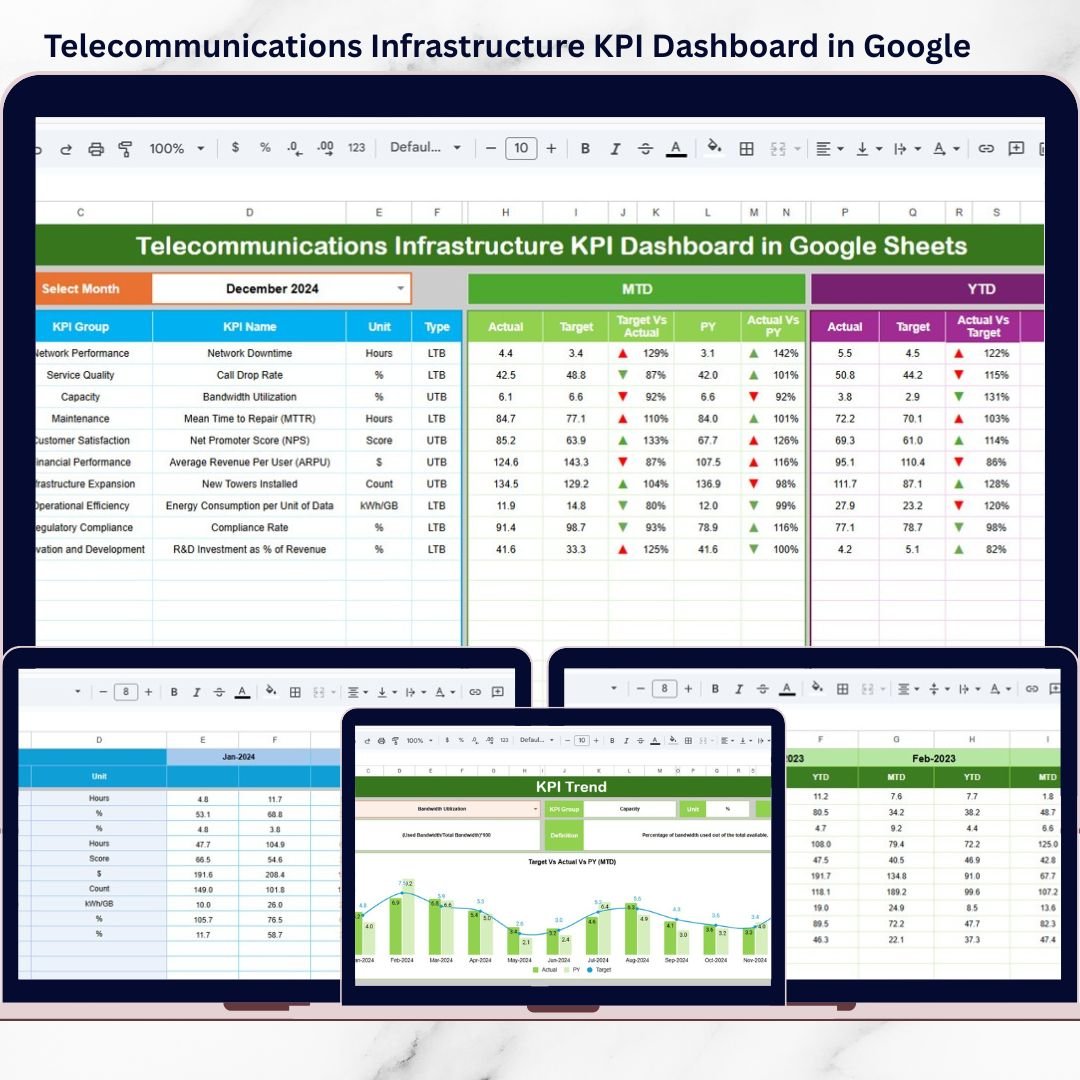
Built entirely in Google Sheets, this dashboard converts raw infrastructure data into clear KPIs, trend insights, and visual indicators. Instead of manual consolidation and guesswork, telecom teams gain real-time visibility into MTD and YTD performance, supported by targets and previous-year comparisons. As a result, infrastructure monitoring becomes structured, proactive, and data-driven.
🚀 Key Features of Telecommunications Infrastructure KPI Dashboard in Google Sheets
📊 Centralized Infrastructure KPI Monitoring – Track all critical network KPIs in one dashboard
📅 MTD & YTD Performance Views – Analyze short-term and long-term infrastructure performance
🎯 Target vs Actual Comparison – Instantly identify underperforming KPIs
📈 Previous Year Comparison – Measure improvement or decline year over year
⬆️⬇️ Conditional Formatting & Arrows – Spot trends and deviations at a glance
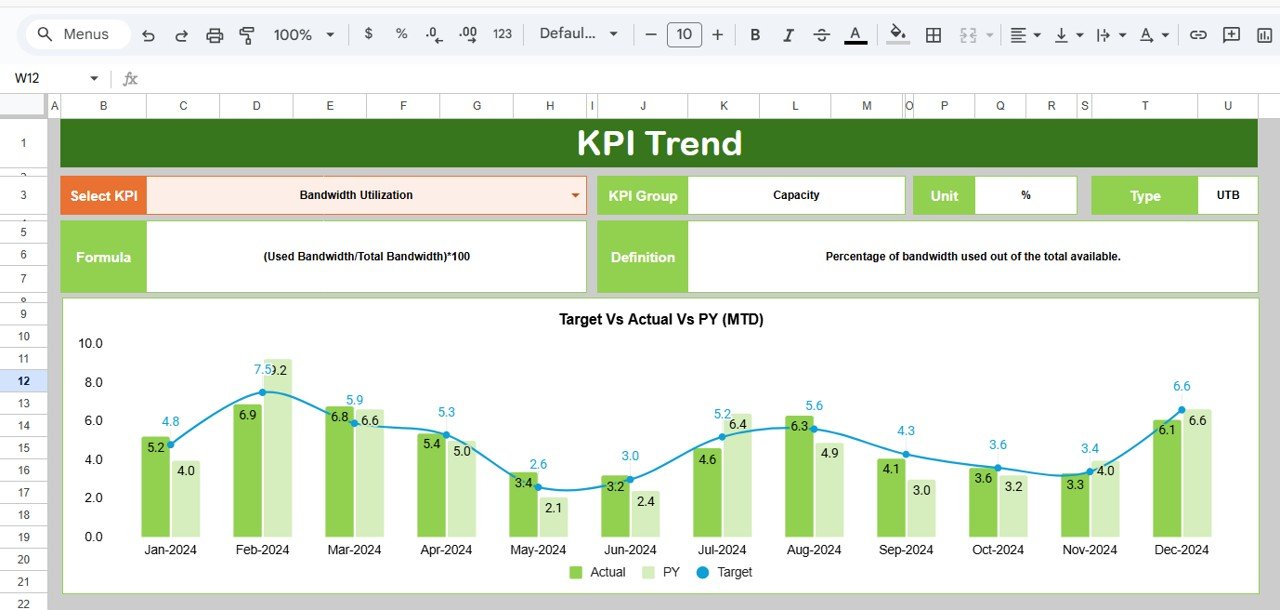
📉 Dedicated KPI Trend Analysis – Understand KPI behavior over time
📘 Built-In KPI Definitions – Clear unit, formula, definition, and KPI type
☁️ Google Sheets Based – Real-time collaboration and cloud access
⚙️ Fully Customizable Structure – Adapt KPIs, targets, and logic easily
📦 What’s Inside the Telecommunications Infrastructure KPI Dashboard
This digital product includes a professionally structured Google Sheets template with 6 purpose-built worksheets, designed specifically for telecom infrastructure teams.
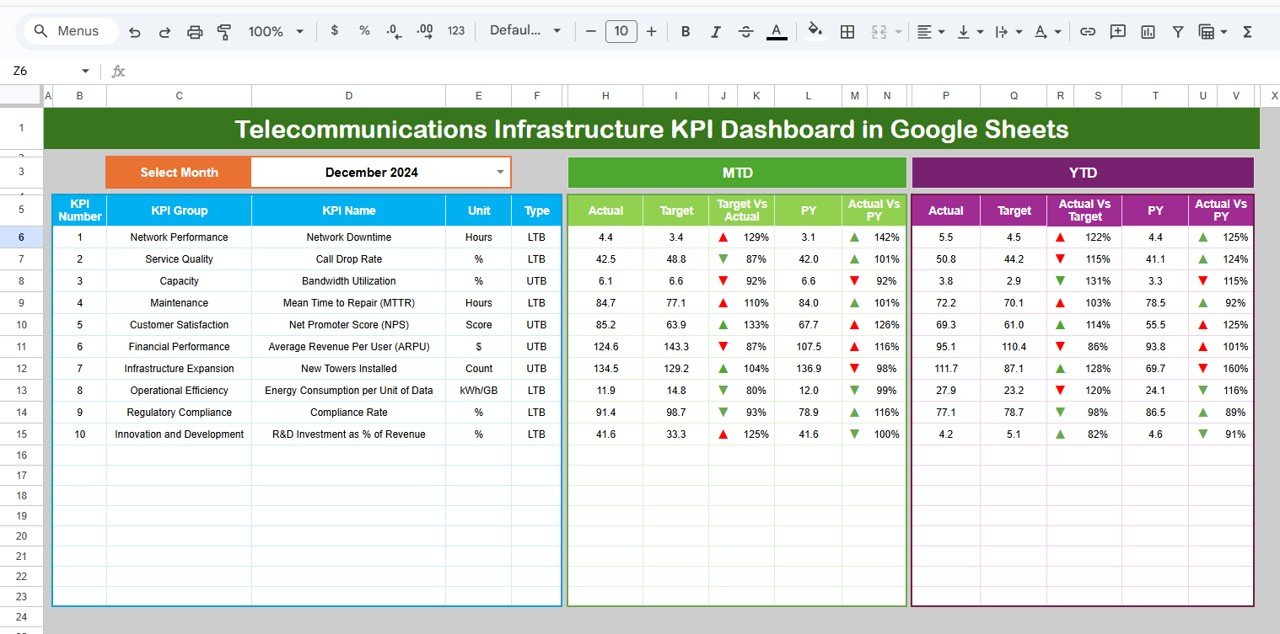
🔹 Dashboard Sheet Tab
-
Month selection drop-down (Cell D3)
-
Automatic KPI updates based on selected month
-
MTD & YTD sections showing:
-
Actual
-
Target
-
Previous Year
-
Target vs Actual
-
Previous Year vs Actual
-
-
Visual arrows and indicators for quick interpretation
🔹 KPI Trend Sheet Tab
-
KPI selector (Cell C3)
-
Displays:
-
KPI Group
-
KPI Unit
-
KPI Type (Lower the Better / Upper the Better)
-
KPI Formula
-
KPI Definition
-
Helps analyze individual KPI movement and long-term trends.
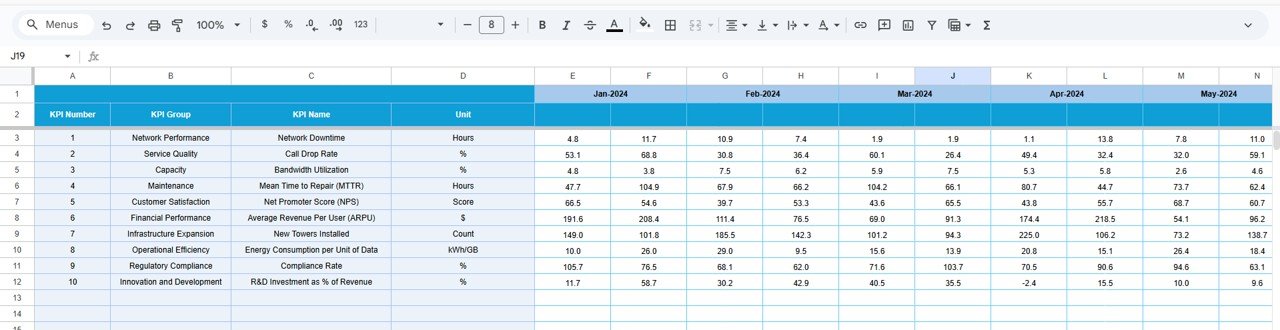
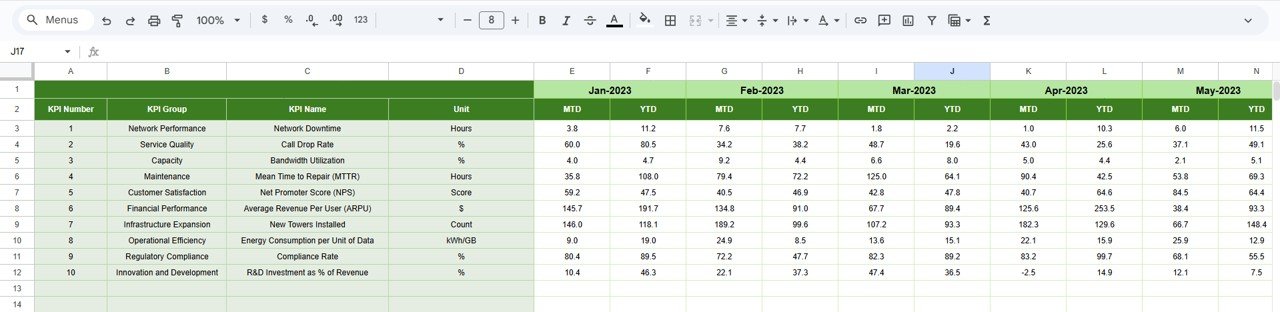
🔹 Actual Number Sheet Tab
-
Main data entry area
-
Enter MTD and YTD actual values
-
Select starting month of the year (Cell E1)
-
Protected formulas ensure data integrity
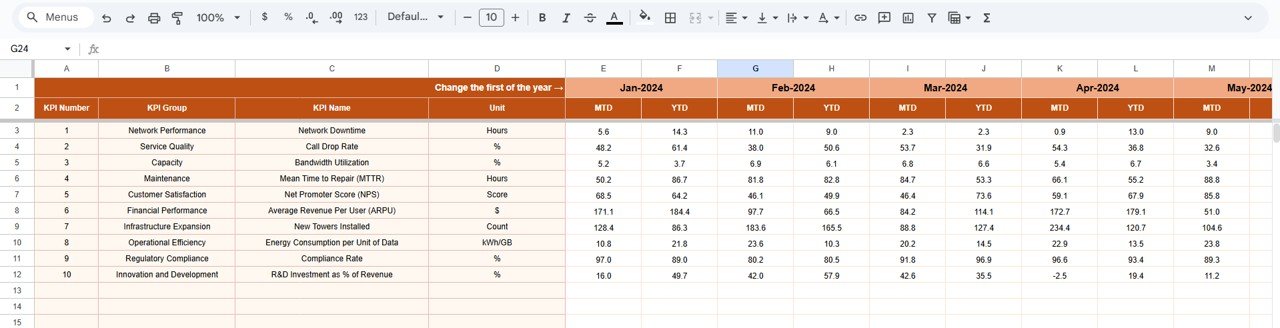
🔹 Target Sheet Tab
-
Define MTD and YTD performance targets
-
Align infrastructure KPIs with operational benchmarks
🔹 Previous Year Number Sheet Tab
-
Stores historical KPI values
-
Enables accurate year-over-year comparison
-
Supports audits and performance reviews
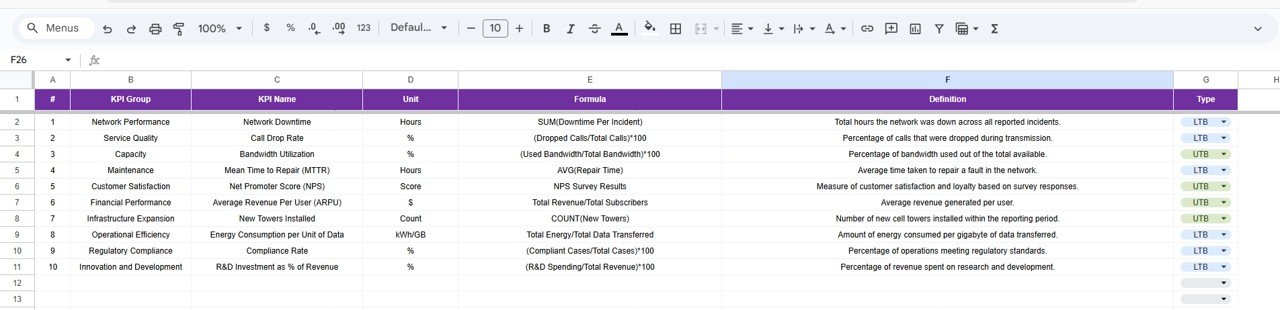
🔹 KPI Definition Sheet Tab
-
Central reference for:
-
KPI Name
-
KPI Group
-
Unit
-
Formula
-
KPI Definition
-
Ensures consistent KPI interpretation across teams.
🧭 How to Use the Telecommunications Infrastructure KPI Dashboard
Using this dashboard is simple and efficient:
1️⃣ Enter actual KPI values in the Actual Number Sheet
2️⃣ Define targets in the Target Sheet
3️⃣ Maintain historical data in the Previous Year Sheet
4️⃣ Select the desired month from the dashboard
5️⃣ Review MTD and YTD performance instantly
6️⃣ Use the KPI Trend Sheet for deeper analysis
No complex formulas to manage. No dashboards to build. Just clear infrastructure performance insights.
🎯 Who Can Benefit from This Telecommunications Infrastructure KPI Dashboard?
This dashboard is ideal for:
✔ Telecom Infrastructure Teams – Monitor network health and reliability
✔ Network Operations Managers – Track uptime, downtime, and capacity
✔ Engineering & Maintenance Teams – Analyze repair and compliance KPIs
✔ Performance & Analytics Teams – Evaluate trends and benchmarks
✔ Senior Management – Gain high-level infrastructure visibility
Both technical and non-technical users can use it confidently.
🔗 Click here to read the Detailed blog post
Watch the step-by-step video tutorial:


Reviews
There are no reviews yet.