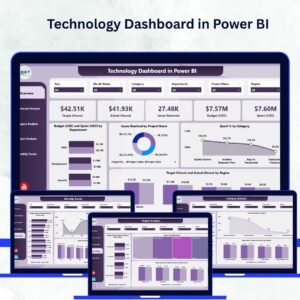
In the age of digital transformation, technology teams need more than raw data — they need clarity, control, and insight. The Technology Dashboard in Power BI provides just that. It’s a ready-to-use, interactive solution that consolidates IT and technology performance data into one visually dynamic workspace.
Whether you’re managing budgets, monitoring workloads, or tracking issue resolution, this dashboard empowers IT leaders, analysts, and executives to make smarter, data-driven decisions — all in real time.
Built on Microsoft Power BI and integrated with Excel or database sources, the dashboard automatically updates visuals, KPIs, and performance metrics. It’s the ultimate tool for turning complex datasets into actionable intelligence.
⚙️ Key Features of the Technology Dashboard in Power BI
💡 Five Interactive Pages:
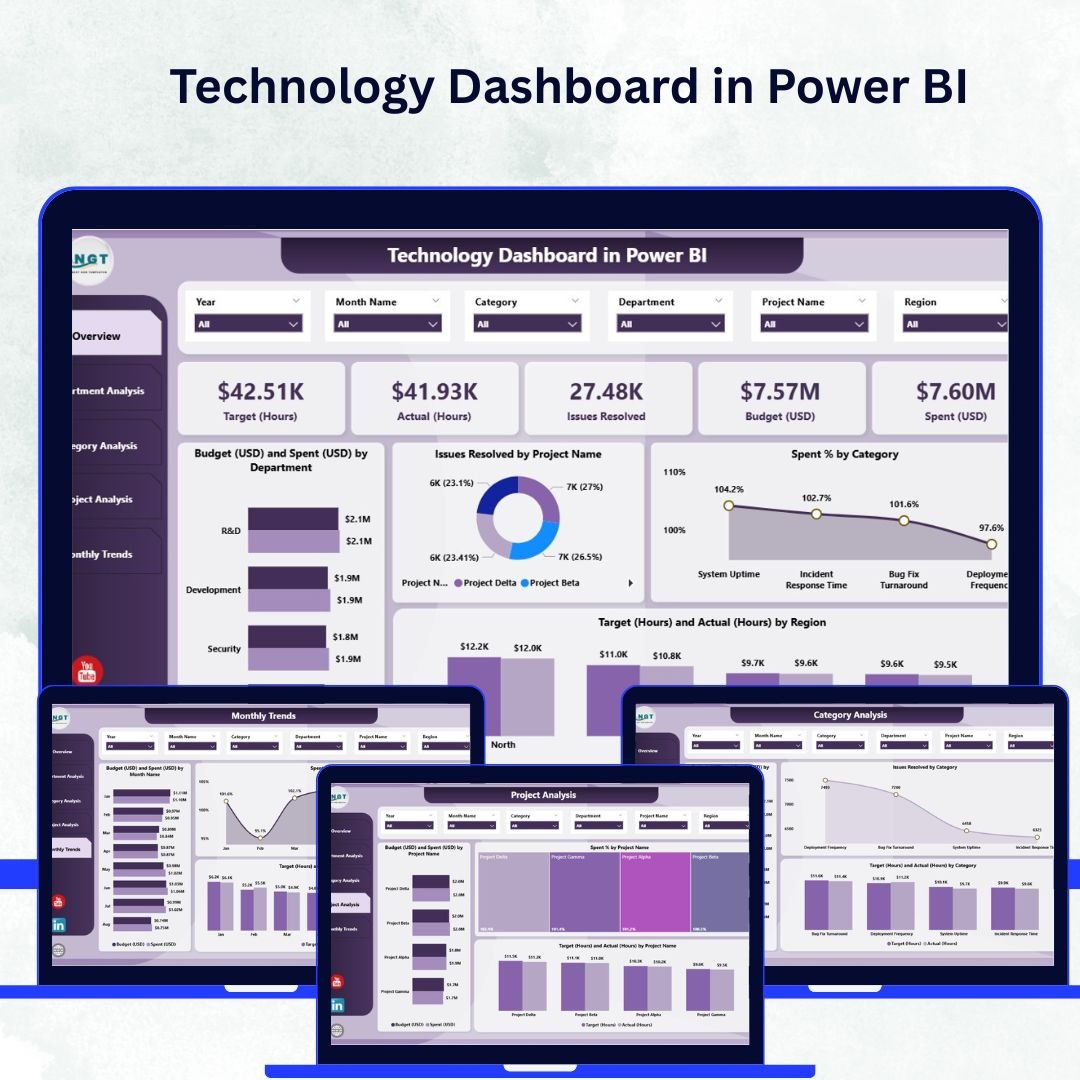
Includes Overview, Department Analysis, Category Analysis, Project Analysis, and Monthly Trends — each offering a unique perspective on technology operations.
📊 Dynamic KPI Cards:
Monitor vital metrics such as Total Budget, Total Spend, Total Hours Worked, Average Issue Resolution Time, and Spending Efficiency — all in one glance.
💰 Budget vs. Spend Analysis:
Compare planned and actual budgets across departments, projects, or categories to improve cost control and forecasting accuracy.
📈 Interactive Slicers and Filters:
Drill down by department, project, region, or month to uncover trends and patterns instantly.
🧩 Departmental Insights:
Evaluate departmental productivity, workload utilization, and spending distribution to enhance accountability and performance.
🧮 Category and Project Tracking:
Analyze where your technology investments go — from software and hardware to cloud services and infrastructure projects.
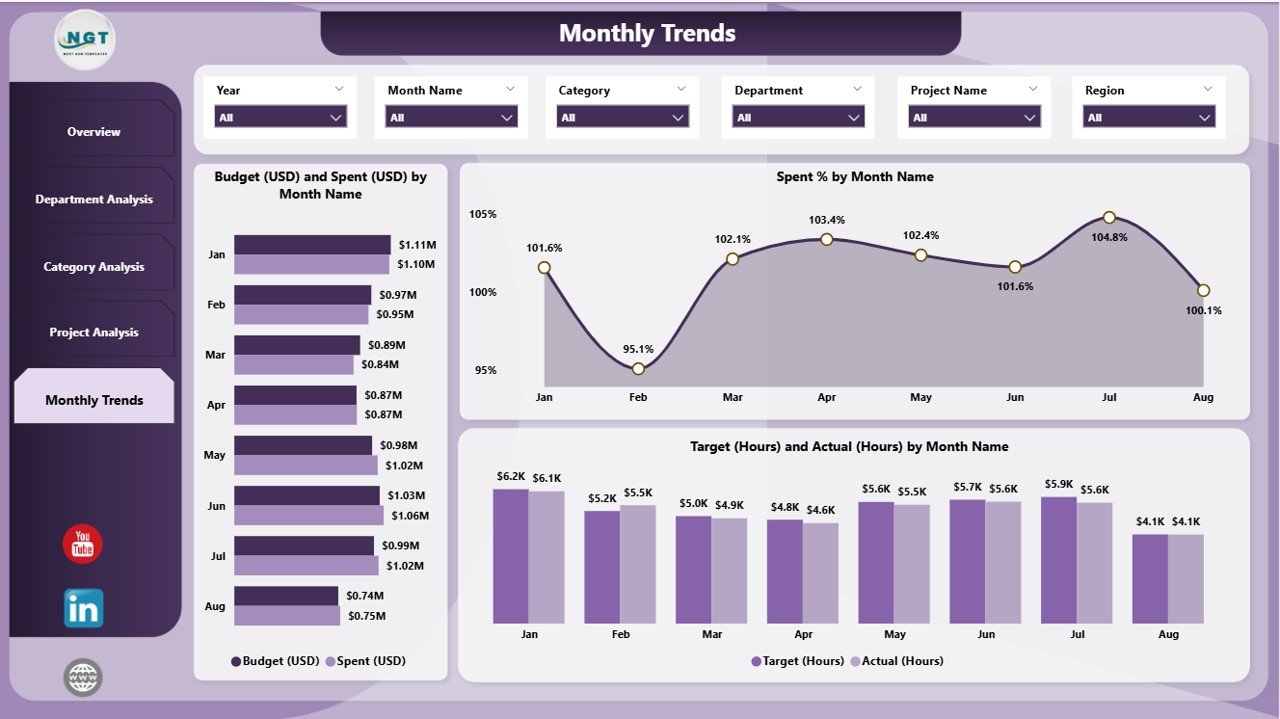
📅 Monthly Trend Visualization:
Identify performance shifts, spending patterns, and efficiency metrics over time using trend charts and timelines.
🔄 Excel Integration:
Easily update your data by refreshing the linked Excel file — no need to rebuild reports or visuals.
🔐 User-Friendly & Secure:
Built for both managers and analysts, this dashboard requires no coding knowledge and supports secure access control via Power BI Service.
🗂️ What’s Inside the Technology Dashboard in Power BI
The dashboard file includes five structured pages, each built to deliver clarity, precision, and insight:
1️⃣ Overview Page:
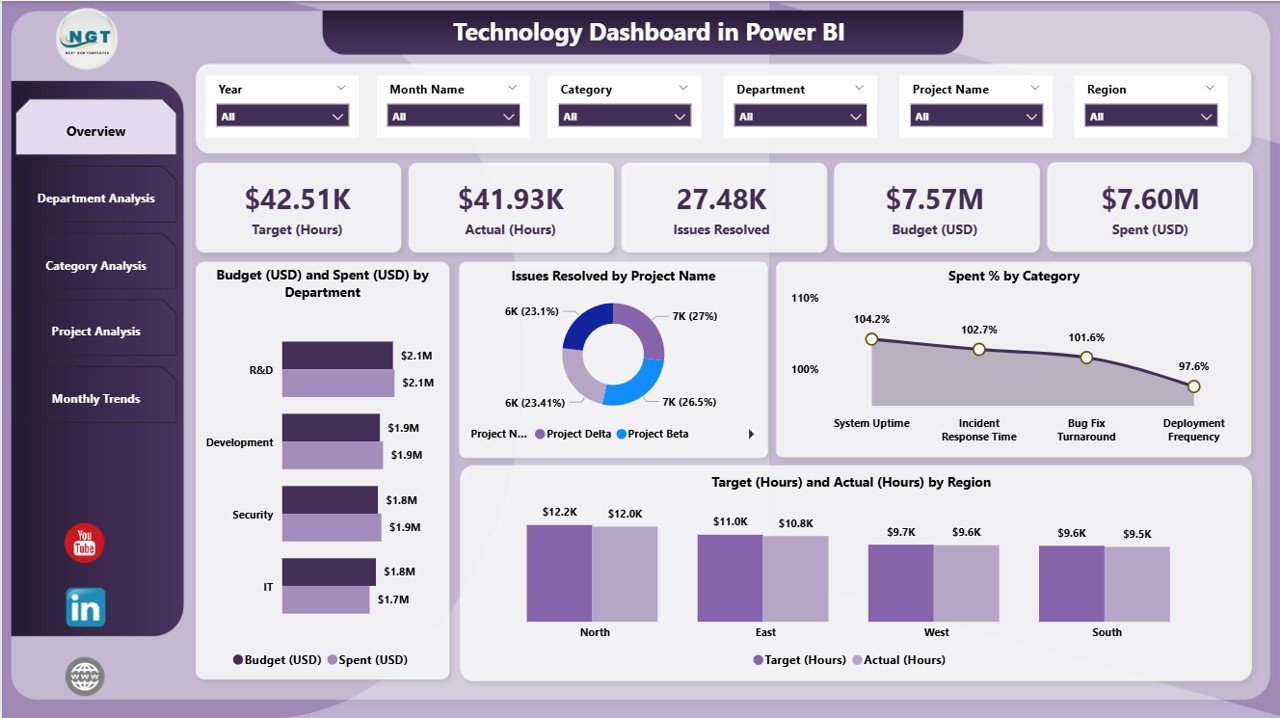
Get a bird’s-eye view of the entire technology ecosystem — from budgets to project performance. Includes summary cards, charts for spend analysis, and visuals for issue tracking.
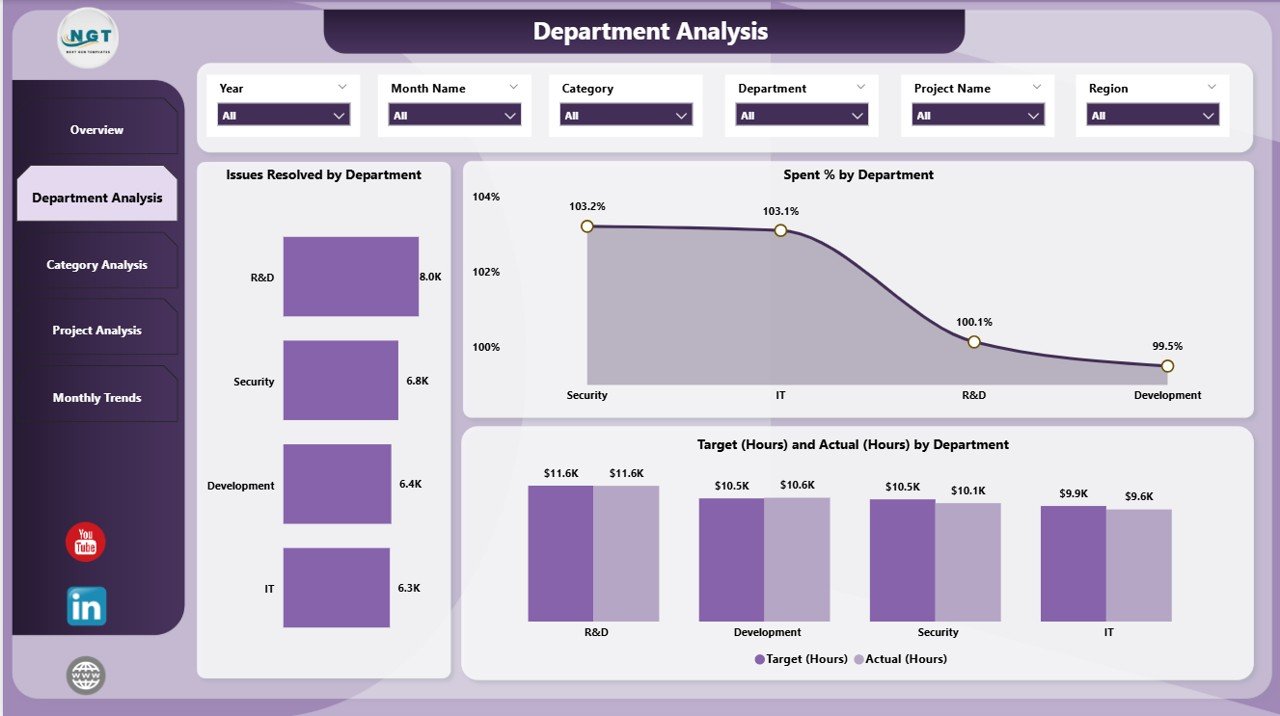
2️⃣ Department Analysis Page:
Monitor departmental productivity and resource allocation. Identify which departments are meeting goals and which need optimization.
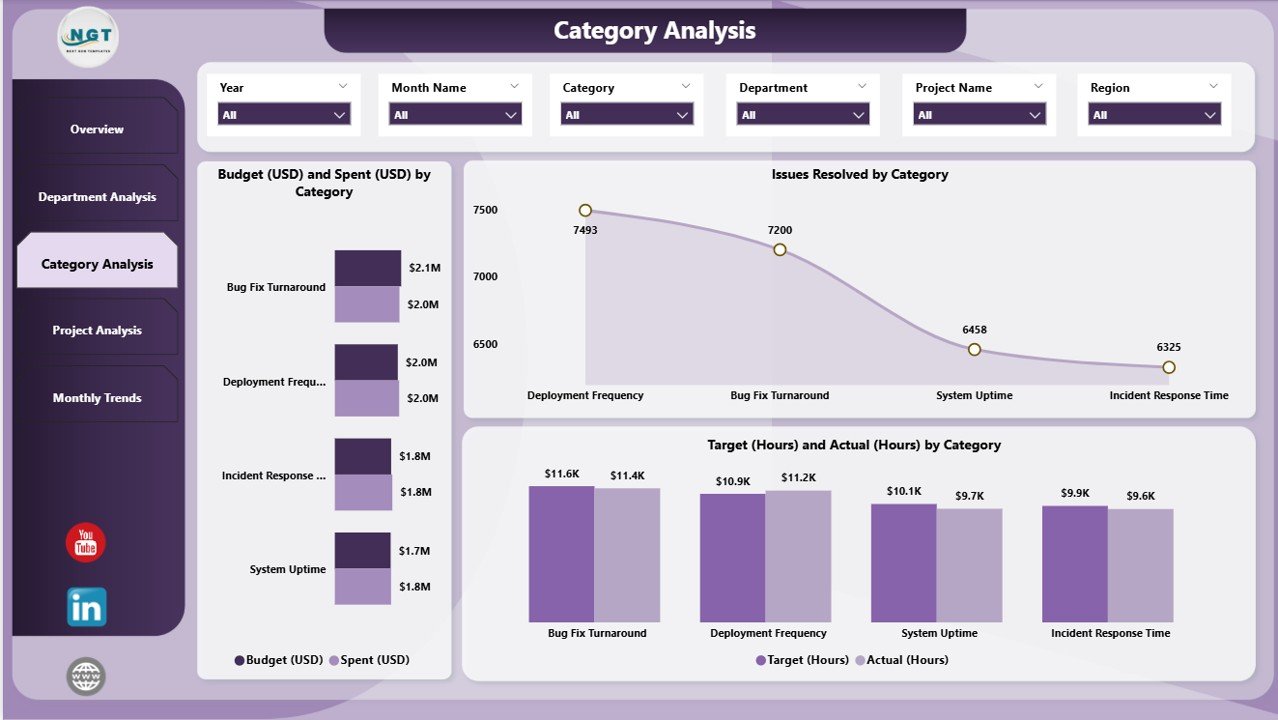
3️⃣ Category Analysis Page:
Understand how spending is distributed across hardware, software, and services to improve financial transparency.
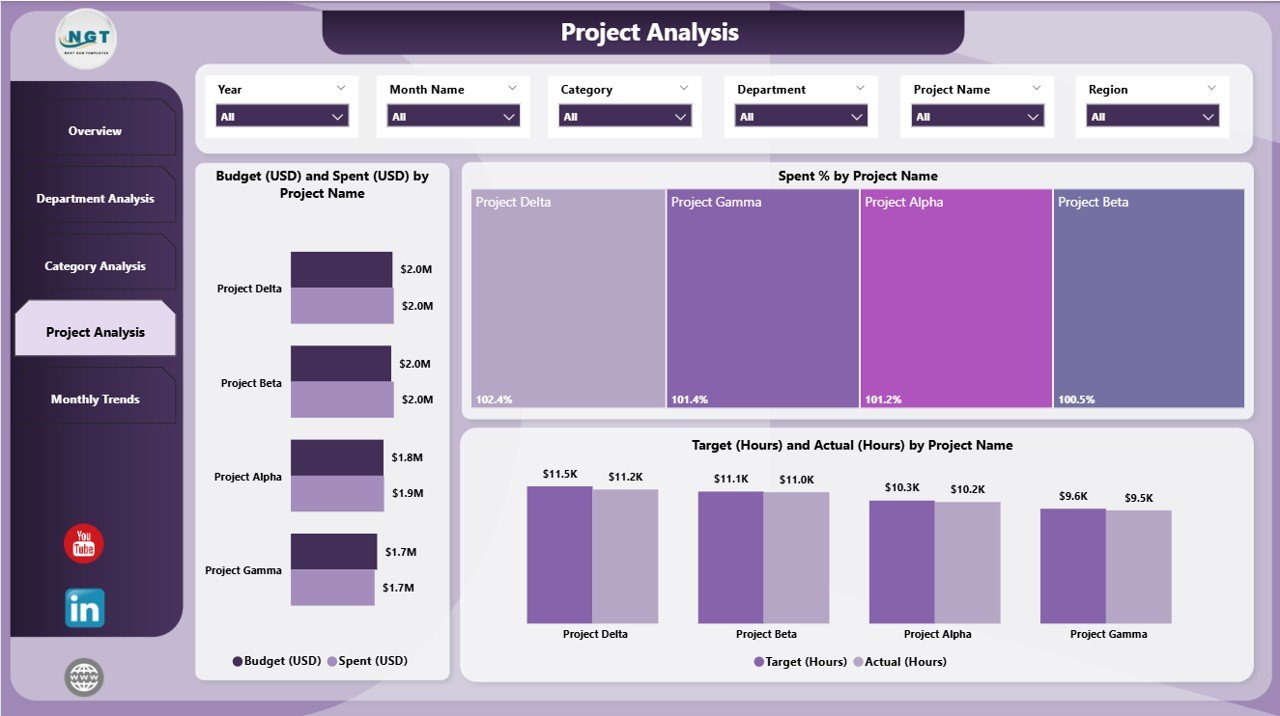
4️⃣ Project Analysis Page:
Track project efficiency, budget adherence, and workload distribution across active and completed initiatives.
5️⃣ Monthly Trends Page:
View performance evolution month over month — perfect for quarterly reports and management reviews.
All visuals are connected to a clean Excel data source, ensuring updates are seamless and maintenance is minimal.
🧭 How to Use the Technology Dashboard in Power BI
✅ Step 1: Connect your Excel or database source to update the underlying data.
✅ Step 2: Open the dashboard in Power BI Desktop and click Refresh to update visuals.
✅ Step 3: Use the slicers to filter results by department, project, or month.
✅ Step 4: Explore each page — Overview, Department, Category, Project, and Monthly Trends — for detailed insights.
✅ Step 5: Share reports securely with stakeholders through Power BI Service for collaboration and decision-making.
Within minutes, you’ll have a live, interactive technology performance dashboard ready to guide your IT strategy.
👥 Who Can Benefit from the Technology Dashboard in Power BI
💼 IT Managers: Gain full visibility into budgets, workloads, and performance efficiency.
🧮 Finance Teams: Monitor technology spending and identify cost-saving opportunities.
🧑💻 Project Managers: Track time, cost, and deliverables across multiple projects.
🔐 Executives & CIOs: Access strategic insights for planning and resource allocation.
🏢 Technology Consultants: Deliver powerful analytics reports for clients and teams.
No matter your industry, this Power BI dashboard helps you align technology initiatives with business outcomes.
🔗 Click here to read the Detailed Blog Post
🎥 Visit our YouTube channel to learn step-by-step video tutorials
🔗 YouTube.com/@PKAnExcelExpert


Reviews
There are no reviews yet.