In today’s competitive business environment, tracking team performance is no longer optional—it’s essential. Whether you’re leading a small department or managing a large, multi-location workforce, you need real-time visibility into task completion, efficiency, and productivity. Our Team Performance Dashboard in Excel is the ultimate tool to help you achieve just that!
This ready-to-use template combines powerful data analysis with a user-friendly interface, making it perfect for managers, HR professionals, and executives who want accurate insights at their fingertips. With interactive charts, dynamic KPIs, and easy navigation, you’ll always know exactly how your teams are performing—so you can make better, faster decisions.
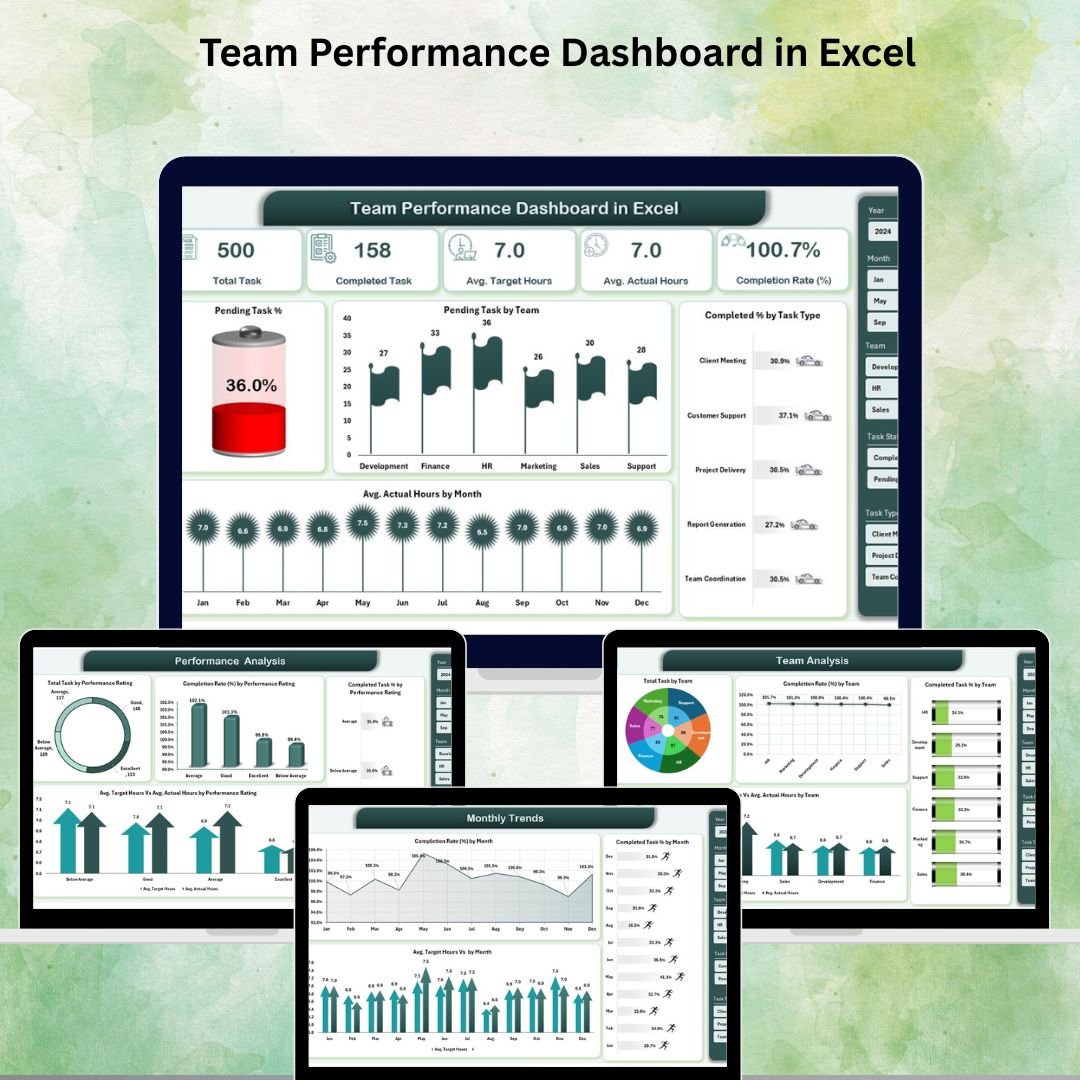
✨ Key Features of the Team Performance Dashboard in Excel
✅ Five Analytical Pages – Includes Overview, Team Analysis, Task Analysis, Performance Analysis, and Monthly Trends.
✅ KPI Cards for Quick Insights – See critical stats like task completion rates, pending percentages, and average hours instantly.
✅ Interactive Filters – Use slicers to view data by team, task type, performance rating, or month.
✅ Clear Visuals – Professionally designed charts make performance trends easy to understand.
✅ Dynamic Data Updates – Automatically refreshes when you add new data to the Data Sheet.
✅ Full Customization – Modify KPIs, add charts, or change visuals to match your needs.
📦 What’s Inside the Team Performance Dashboard
When you download this Excel template, you get a fully functional performance monitoring system designed for efficiency:
-
Page Navigator – Located on the left side for quick access to all pages.
-
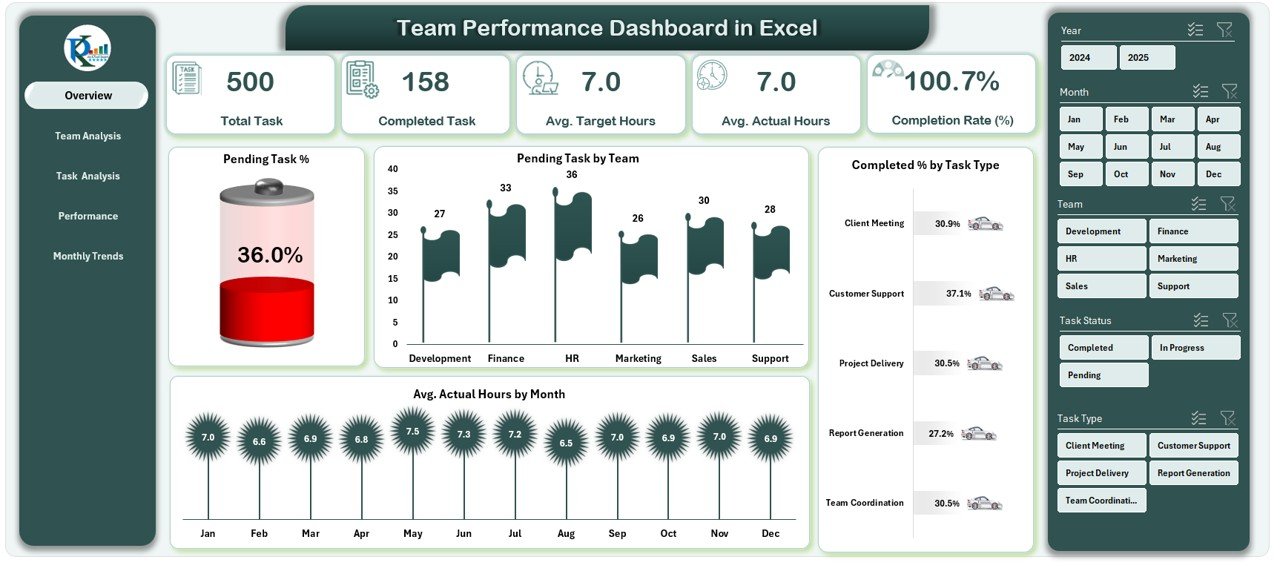
Overview Page – 5 KPI cards + charts showing pending tasks, completion rates, and average hours.
-
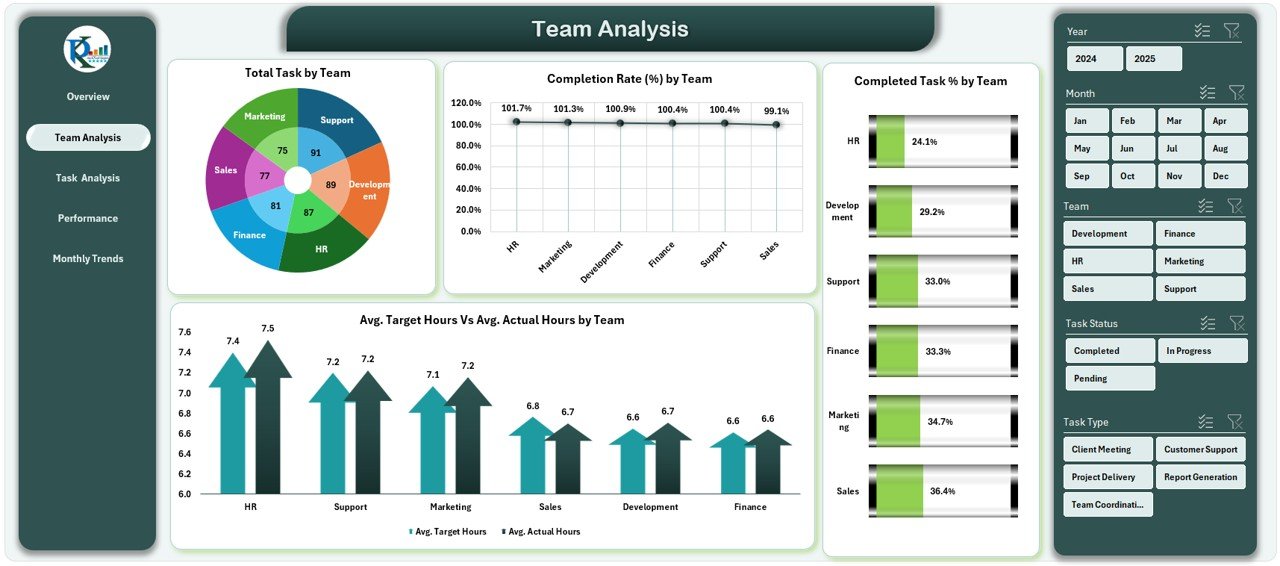
Team Analysis Page – Compare performance across different teams.
-
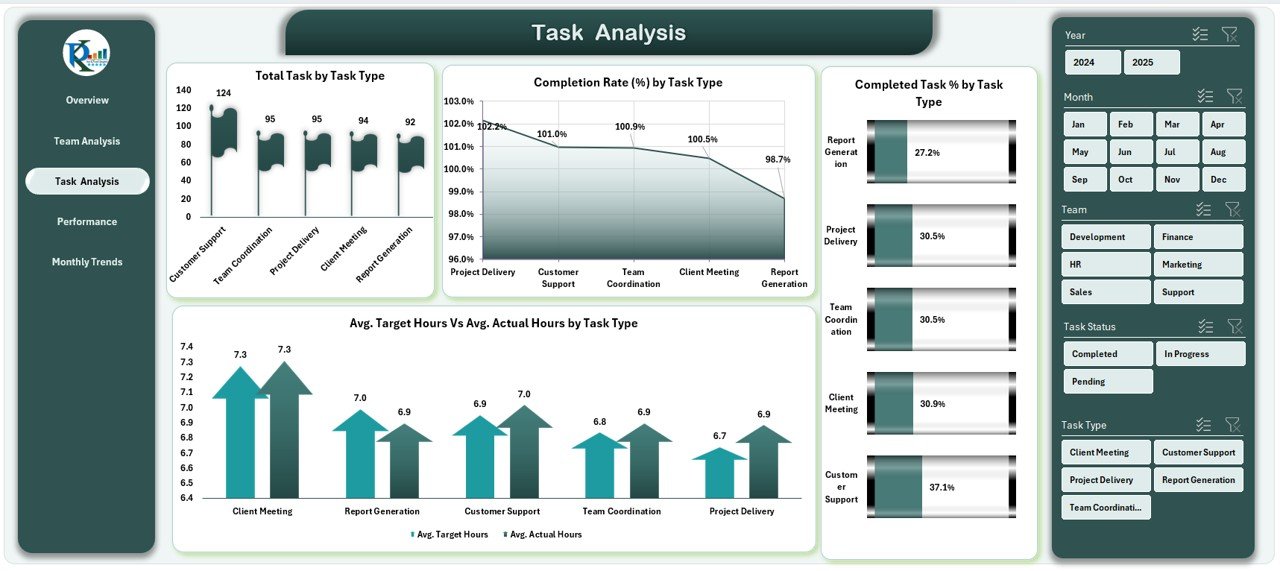
Task Analysis Page – Track performance by task category and workload distribution.
-
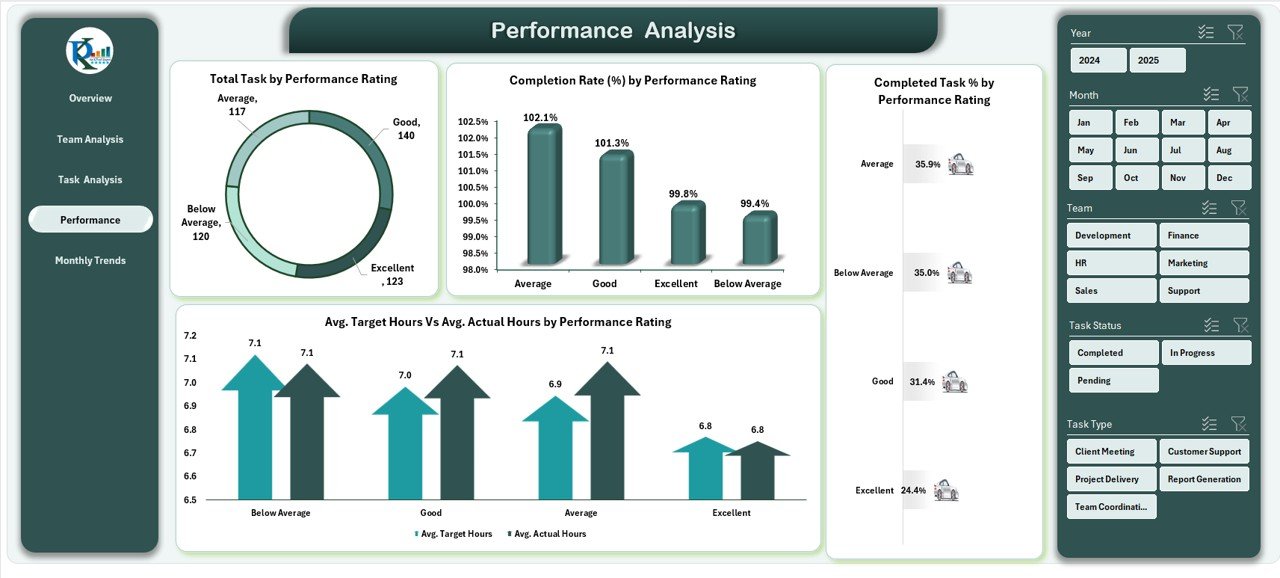
Performance Analysis Page – View results based on performance ratings.
-
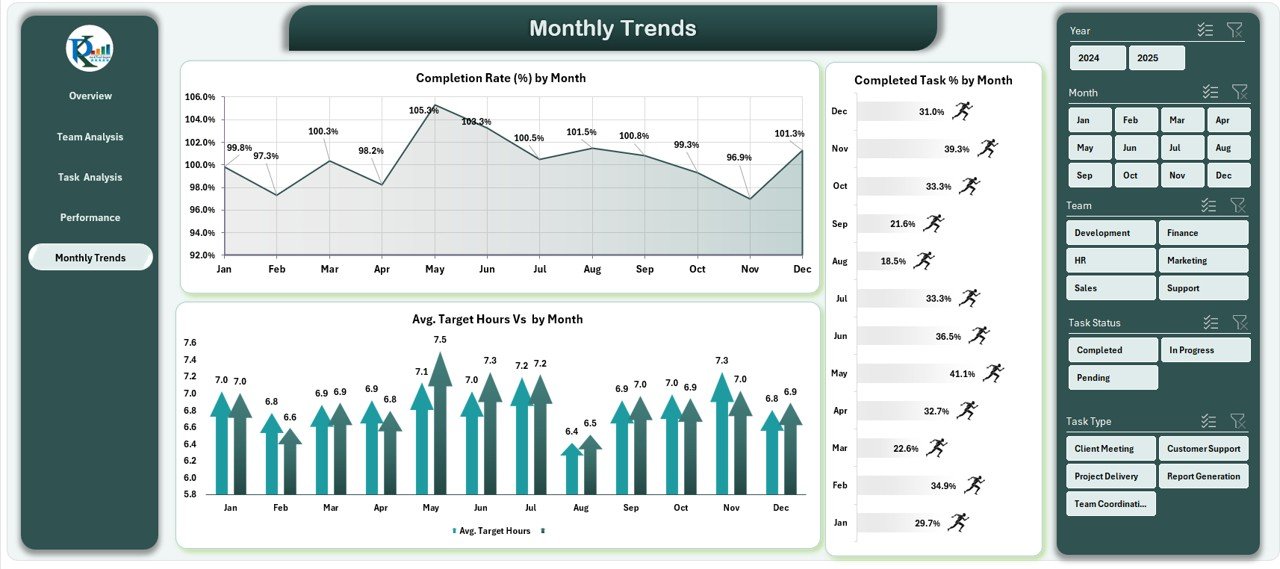
Monthly Trends Page – Identify seasonal patterns and recurring productivity dips.
-
Data Sheet – The backbone of the dashboard for storing raw performance data.
-
Support Sheet – Contains lookup tables and formulas to keep your dashboard dynamic.
🛠 How to Use the Team Performance Dashboard in Excel
1️⃣ Enter Data in the Data Sheet – Add task names, teams, start & completion dates, target hours, and actual hours.
2️⃣ Refresh PivotTables – Instantly update all charts with the latest figures.
3️⃣ Apply Slicers – Filter results by date, team, task type, or performance rating.
4️⃣ Analyze Trends – Spot performance gaps, workload imbalances, or high-achieving teams.
5️⃣ Share Insights – Export charts or share the Excel file with decision-makers.
👥 Who Can Benefit from This Dashboard?
💼 Team Leaders & Managers – Track and improve team productivity.
🏢 HR Professionals – Monitor workload distribution and performance patterns.
📊 Executives – Get a high-level view of organizational efficiency.
🛠 Project Managers – Keep projects on track with clear performance metrics.
🎯 Small Business Owners – Optimize resource allocation and boost efficiency.
💡 Why Choose Our Team Performance Dashboard?
With this template, you’re not just getting an Excel file—you’re getting a complete performance management solution. The combination of KPIs, visual charts, and interactive features ensures that you’ll never miss a productivity insight again. It’s simple, effective, and ready to use from day one.


Reviews
There are no reviews yet.