


In today’s ESG-driven world, sustainability is no longer optional—it’s essential. Whether you’re a sustainability officer, an ESG reporting analyst, or a forward-thinking executive, tracking your organization’s environmental, social, and governance impact is mission critical. That’s why we created the Sustainability Reporting KPI Dashboard in Power BI—a robust, ready-to-use tool that transforms complex ESG data into visual stories that drive impact. 📊🌱
This dynamic dashboard helps organizations monitor emissions, waste, water, energy, social contributions, and ethical governance—all from a single interactive platform powered by Microsoft Excel and Power BI.
🛠️ Key Features of Sustainability Reporting KPI Dashboard in Power BI
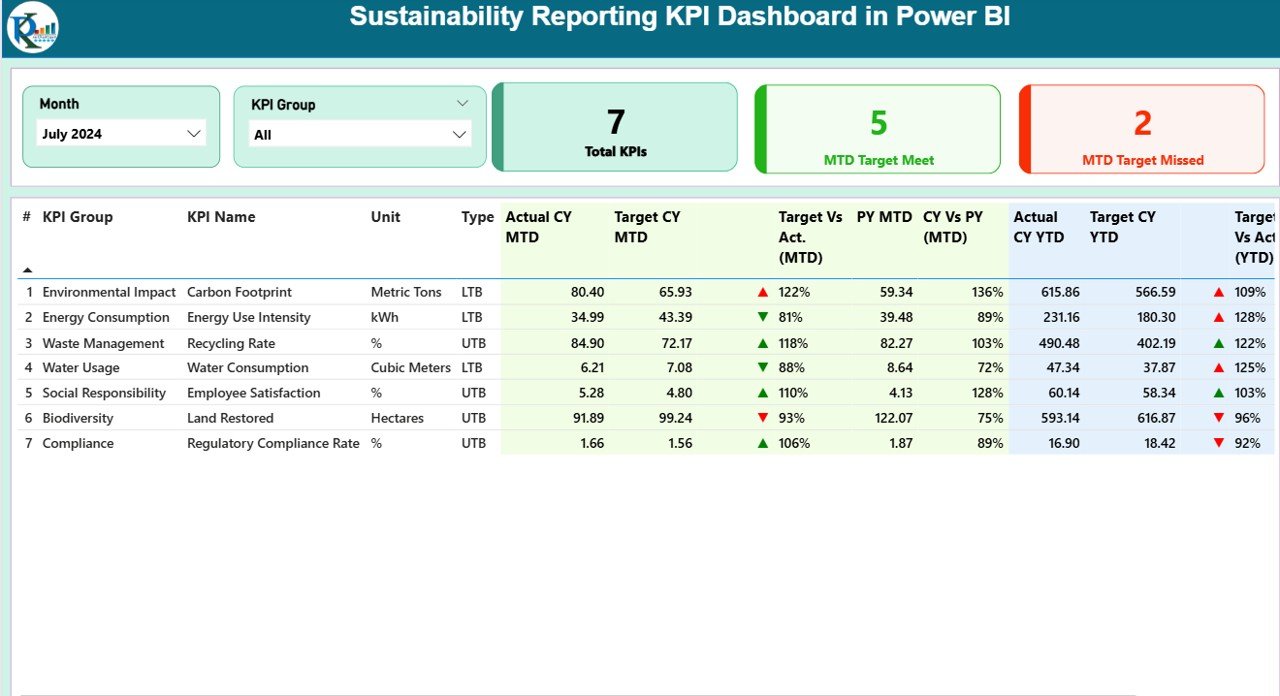
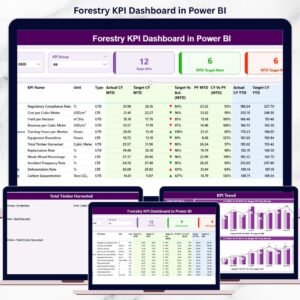
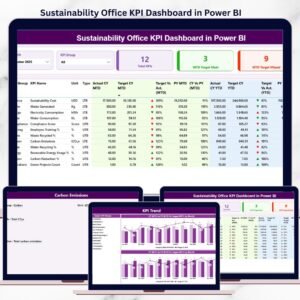
📋 Summary Page – Track Your Progress at a Glance
-
🎯 Slicers: Filter by Month and KPI Group for focused analysis
-
📌 KPI Cards: View Total KPIs, MTD Target Met, MTD Target Missed
-
🧮 Interactive KPI Table:
-
KPI Number, Name, Group, Unit, Type (UTB / LTB)
-
MTD & YTD Actual vs Target
-
% Achievement
-
CY vs PY (Current Year vs Previous Year) Metrics
-
Status Icons: ▲ Green = On Track, ▼ Red = Needs Attention
-
📈 KPI Trend Page – Understand the Bigger Picture
-
📊 Combo Charts:
-
Current vs Previous Year Actuals
-
MTD and YTD Target Comparisons
-
-
🎛️ KPI Slicer: Deep-dive into individual KPI performance over time
🔍 KPI Definition Page (Drill-Through)
Click any KPI in the summary to:
-
📘 View formula, unit, definition, and classification (UTB or LTB)
-
🧠 Understand how each KPI is calculated and what it means
📦 What’s Inside the Dashboard System?
Your dashboard connects to a structured Excel backend with three key data sheets:
📥 Input_Actual
-
Fields: KPI Name, Month, MTD Actual, YTD Actual
-
✍️ Enter raw performance data monthly
🎯 Input_Target
-
Fields: KPI Name, Month, MTD Target, YTD Target
-
🎯 Define your sustainability goals clearly and consistently
📚 KPI_Definition
-
Fields: KPI Number, Group, Name, Unit, Formula, Definition, Type
-
✅ Creates a centralized “data dictionary” for team clarity
Just hit Refresh in Power BI and the visuals instantly update!
📌 How to Use the Dashboard
✔️ Step 1: Define KPIs in the KPI Definition Sheet
✔️ Step 2: Enter actual & target values monthly
✔️ Step 3: Open Power BI and click Refresh
✔️ Step 4: Use slicers to filter and explore
✔️ Step 5: Click any KPI to drill down into its definition
✔️ Step 6: Share insights with your ESG or leadership team
👥 Who Should Use This Dashboard?
✅ Sustainability Managers – Align operations with ESG goals
✅ Compliance Officers – Ensure regulatory reporting compliance
✅ CSR Teams – Track impact of social and ethical initiatives
✅ Business Executives – Make data-driven sustainability decisions
✅ Consulting Firms – Provide custom ESG dashboards for clients
✅ Educational Institutions & Nonprofits – Measure sustainability KPIs internally or for grants
🎯 Whether you’re reducing carbon emissions, improving recycling rates, or enhancing employee well-being—this dashboard helps you monitor your progress and share it with stakeholders transparently and visually.


Reviews
There are no reviews yet.