


The Sustainability Metrics KPI Dashboard in Excel is an essential tool for businesses committed to sustainability and environmental responsibility. This Excel-based dashboard helps organizations track, measure, and manage their sustainability efforts by monitoring key environmental and social metrics. With this dashboard, businesses can easily assess their sustainability performance, align with industry standards, and make informed decisions to improve their impact on the planet.
This tool allows you to track various sustainability metrics such as carbon emissions, energy usage, waste management, water consumption, and more. It provides real-time data visualization, making it easier to monitor progress toward sustainability goals and ensure compliance with environmental regulations. Whether you’re a corporation, small business, or nonprofit, this dashboard is a valuable resource for driving sustainability initiatives and making a positive environmental impact.
Key Features of the Sustainability Metrics KPI Dashboard in Excel
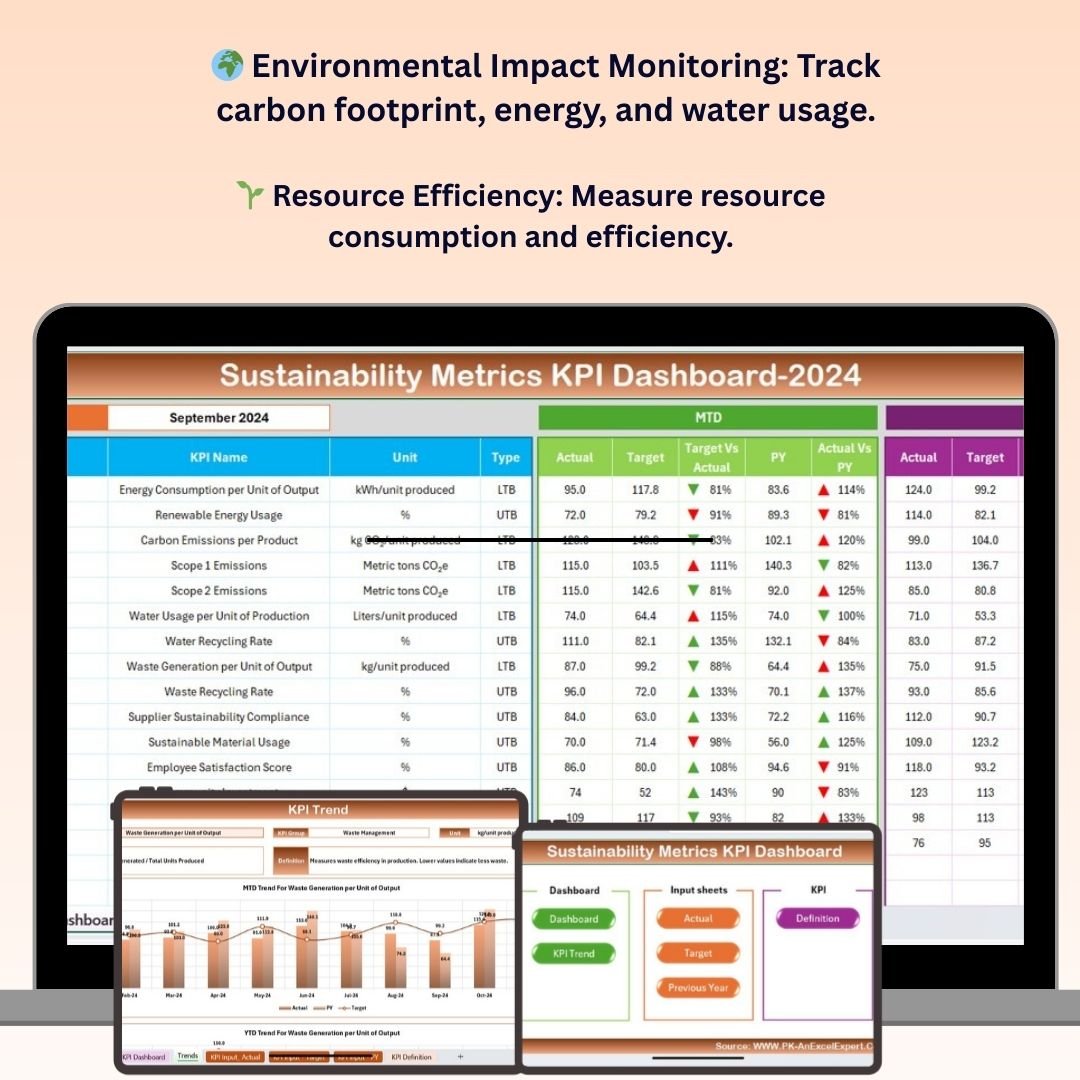
🌍 Environmental Impact Tracking
Track critical environmental KPIs such as carbon footprint, energy consumption, waste reduction, and water usage. Monitor your organization’s sustainability efforts and their contribution to reducing environmental harm.
🌱 Resource Efficiency Monitoring
Measure resource efficiency across various areas like energy, materials, and water. Analyze how effectively your business is utilizing resources and identify opportunities to improve sustainability practices.
📊 Real-Time Performance Analytics
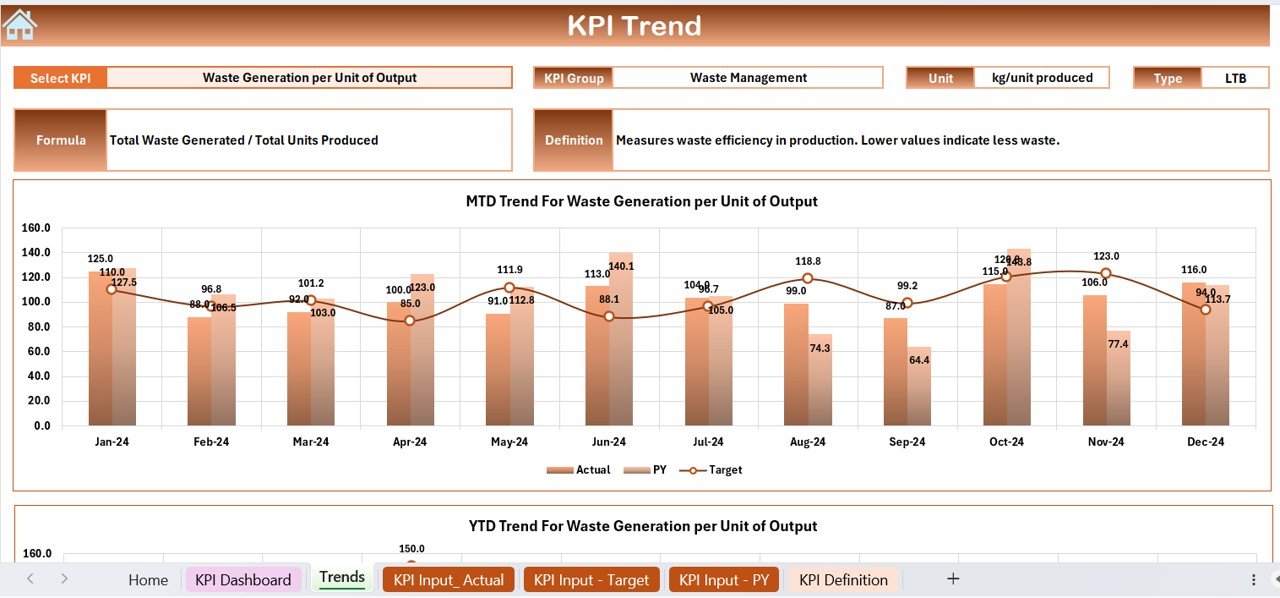
Visualize sustainability performance over time using interactive charts and graphs. Track key sustainability metrics in real-time to assess progress toward sustainability goals and identify areas for improvement.
📅 Time-Based Tracking & Reports
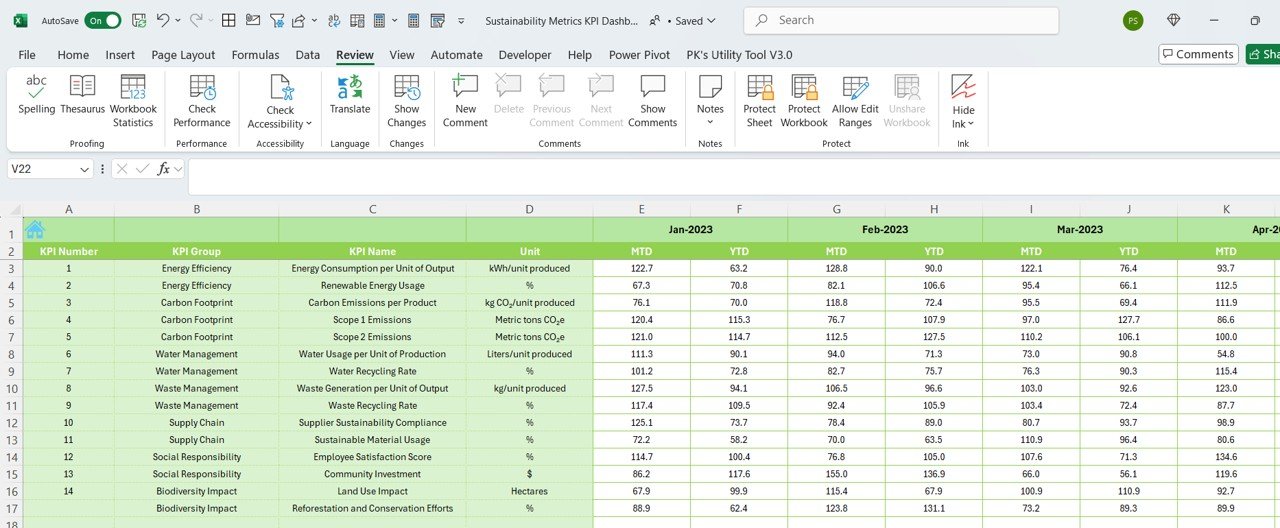
Track sustainability metrics over different time periods (monthly, quarterly, yearly). Analyze trends and performance over time to identify successes and areas that need further attention.
⚙️ Customizable Metrics & Categories
Customize the dashboard to fit your specific sustainability goals and KPIs. Adjust metrics for carbon emissions, waste management, energy usage, and other factors based on your business priorities.
📈 Progress Visualization & Reporting
Gain insights into sustainability progress with clear visualizations of key metrics. Use built-in charts to display performance trends, track changes, and generate reports for stakeholders.
Why You’ll Love the Sustainability Metrics KPI Dashboard in Excel
✅ Comprehensive Sustainability Tracking
Easily track and manage your organization’s sustainability performance across key environmental and social metrics.
✅ Data-Driven Insights for Sustainability
Monitor the effectiveness of your sustainability initiatives and make data-driven decisions to reduce your environmental impact and improve resource usage.
✅ Real-Time Analytics & Reports
Get real-time insights into your sustainability performance and visualize trends, helping you take immediate action and stay aligned with sustainability goals.
✅ Tailor the Dashboard to Your Needs
Customize the dashboard with metrics and categories that are relevant to your organization’s sustainability goals. Track specific areas such as waste reduction, energy efficiency, and carbon emissions.
✅ Promote Transparency & Accountability
Provide transparent, data-driven reports on your sustainability efforts for stakeholders, investors, and the public. Demonstrate your commitment to sustainability and ethical business practices.
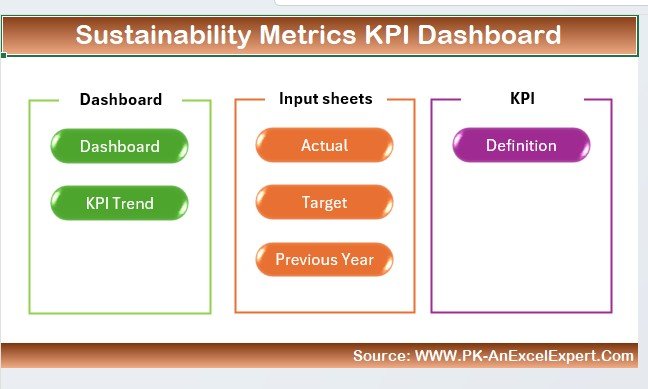
What’s Inside the Sustainability Metrics KPI Dashboard in Excel?
- Environmental Impact Tracking: Monitor carbon footprint, energy consumption, water usage, and waste management.
- Resource Efficiency Monitoring: Track efficiency in resource utilization and identify opportunities for improvement.
- Time-Based Tracking & Reporting: Analyze sustainability performance over different periods.
- Customizable Metrics & KPIs: Adapt the dashboard to your organization’s specific sustainability goals and metrics.
- Real-Time Data Visualization: Visualize sustainability performance with interactive charts and graphs.
- Sustainability Reports: Generate reports to communicate sustainability progress to stakeholders.
How to Use the Sustainability Metrics KPI Dashboard in Excel
1️⃣ Download the Template: Access the Sustainability Metrics KPI Dashboard in Excel instantly.
2️⃣ Set Up Sustainability Goals: Input your organization’s sustainability goals and define relevant KPIs.
3️⃣ Track Progress & Performance: Monitor key metrics such as carbon emissions, energy consumption, and resource efficiency.
4️⃣ Analyze Data: Use real-time data and visualizations to evaluate sustainability performance and identify improvement opportunities.
5️⃣ Report Sustainability Progress: Generate reports to share progress with stakeholders and track your impact over time.
Who Can Benefit from the Sustainability Metrics KPI Dashboard in Excel?
🔹 Sustainability Managers & Directors
🔹 Environmental Impact Consultants
🔹 Corporate Social Responsibility (CSR) Teams
🔹 Small & Medium Enterprises (SMEs)
🔹 Large Corporations
🔹 Nonprofits Focused on Sustainability
🔹 Regulatory & Compliance Teams
🔹 E-commerce & Retail Businesses
Achieve your sustainability goals and track your impact with the Sustainability Metrics KPI Dashboard in Excel. Monitor, measure, and improve your environmental performance with ease, helping you take meaningful steps toward a more sustainable future.
Click here to read the Detailed blog post
Visit our YouTube channel to learn step-by-step video tutorials
Youtube.com/@PKAnExcelExpert


Reviews
There are no reviews yet.