
In the fast-paced world of logistics and operations, efficiency is everything. Managing suppliers, warehouses, deliveries, and returns manually can be overwhelming. That’s where the Supply Chain Management Report in Excel becomes a game-changer.
This ready-to-use Excel solution brings your entire supply chain into one interactive dashboard — giving you instant visibility of key performance indicators (KPIs), trends, and bottlenecks. Whether you’re managing procurement, logistics, or production, this report helps you analyze performance, track efficiency, and make smarter business decisions.
Built entirely in Microsoft Excel, it combines automation, visual analytics, and flexibility — no coding or complex setup required. From order tracking to supplier performance, every metric is just one click away.
⚙️ Key Features of the Supply Chain Management Report in Excel
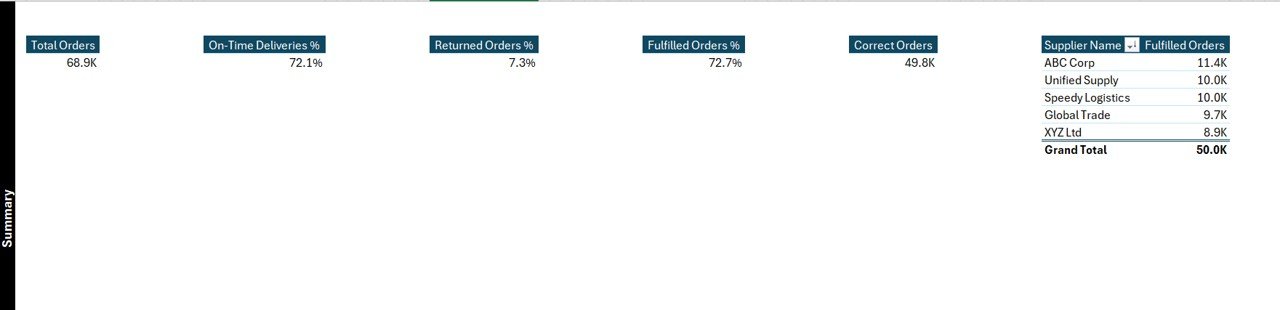
🏠 1️⃣ Summary Page – The Central Dashboard
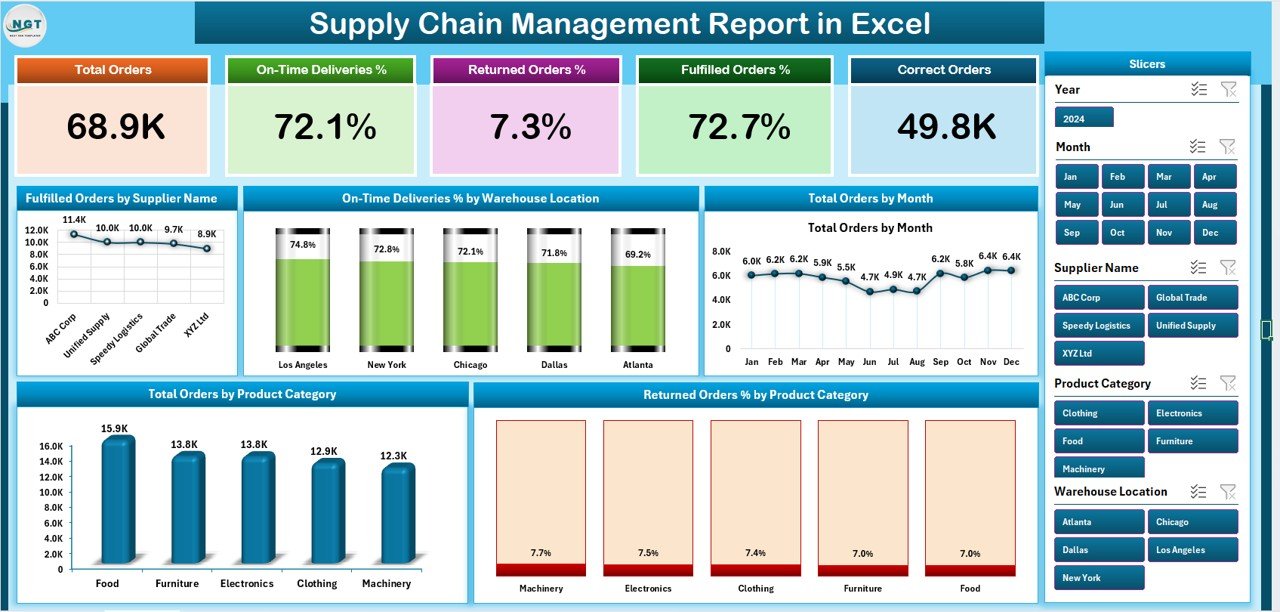
Your main control panel for real-time supply chain visibility.
Highlights:
-
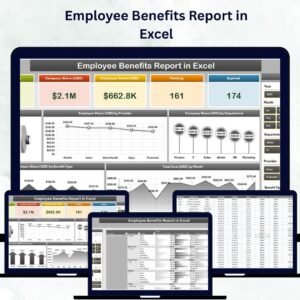
📊 Five KPI Cards – Total Orders, Fulfilled Orders, On-Time Delivery %, Returned Orders %, and Supplier Performance.
-
🎯 Interactive Slicers – Filter by Month, Supplier, Product Category, or Warehouse Location.
-
📈 Five Analytical Charts:
-
Fulfilled Orders by Supplier
-
On-Time Deliveries % by Warehouse
-
Total Orders by Month
-
Orders by Production Unit
-
Returned Orders % by Product Category
-
💼 With these visuals, you can instantly identify top suppliers, underperforming warehouses, or seasonal trends affecting fulfillment.
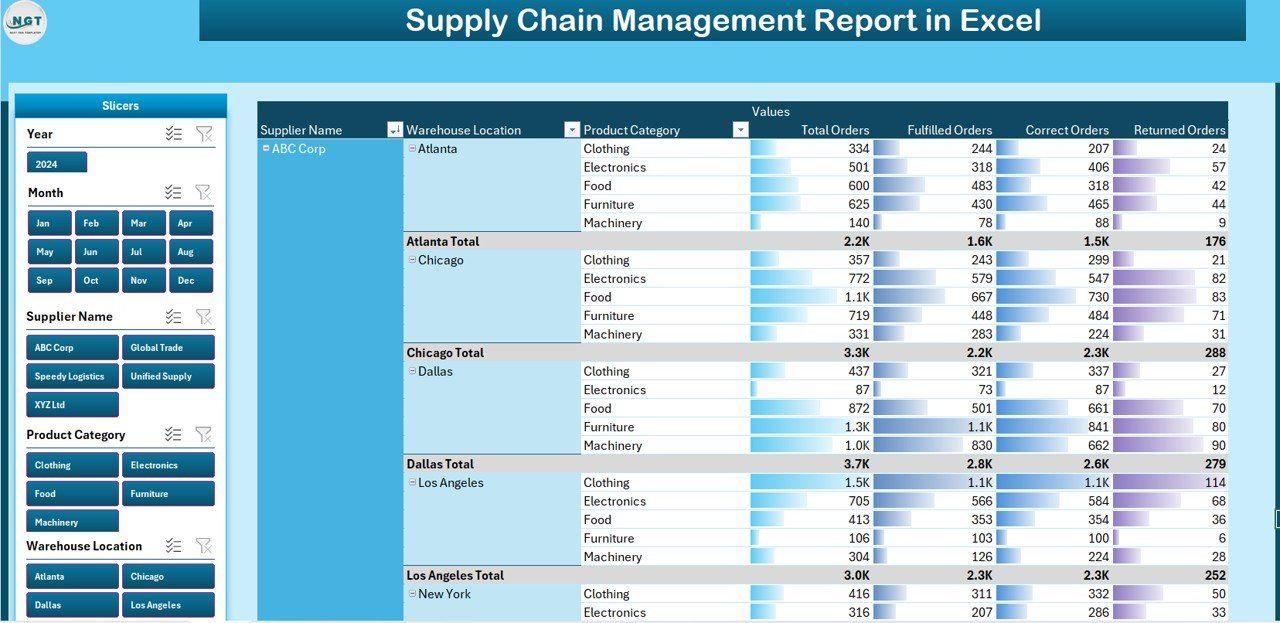
📋 2️⃣ Report Page – Deep Dive into Data
Drill down into the details with this powerful analytical view.
Includes:
-
Left-side slicers for Department, Supplier, or Product.
-
Dynamic data table showing:
-
Order ID | Supplier Name | Warehouse | Product | Quantity | Cost | Delivery Date | Status | Return %.
-
-
Export filtered results for audits or performance reviews.
🧠 This page provides transparency and traceability — ideal for internal audits or management meetings.
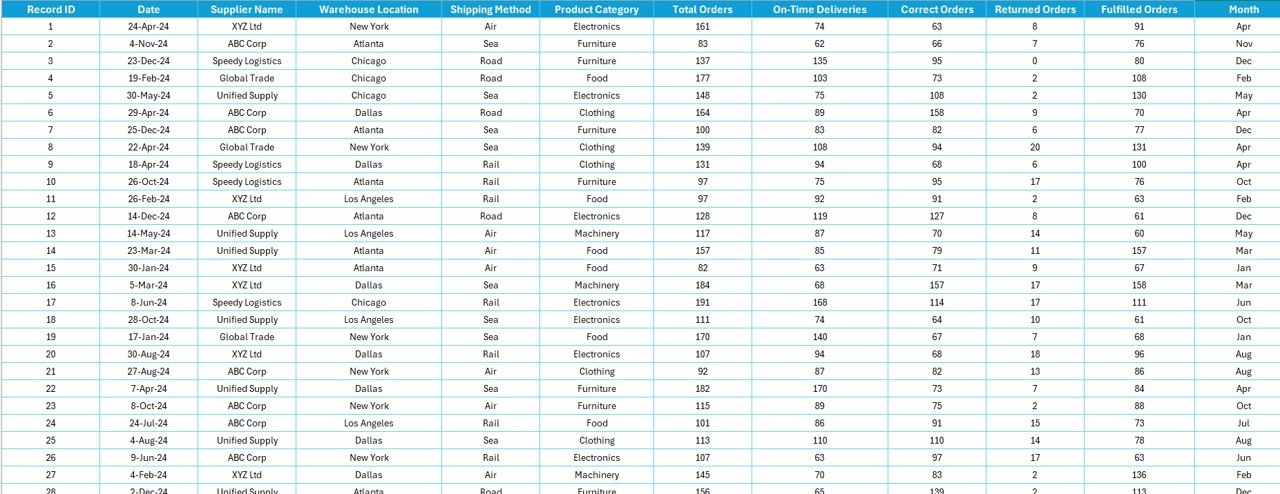
🧮 3️⃣ Data Sheet – The Heart of the Report
The foundation that powers every chart and KPI.
Contains columns for:
Order ID, Supplier Name, Warehouse, Product Category, Order Date, Delivery Date, Quantity, Cost, Status, and Return Rate.
✅ Once new data is added, all visuals and KPIs refresh automatically — ensuring up-to-date insights at all times.
🧩 4️⃣ Support Sheet – Backend Logic & Formulas
Keeps your report running smoothly.
Stores:
-
Lookup tables for KPI definitions.
-
Dropdown lists for supplier and product filters.
-
Backend formulas for automation and consistency.
🔒 Protect this sheet to maintain accuracy and prevent unwanted edits.
🌟 Advantages of the Supply Chain Management Report in Excel
✅ Centralized Data Control: View every aspect of procurement, logistics, and returns in one place.
✅ Real-Time Insights: Auto-updating charts keep information current.
✅ Enhanced Efficiency: Identify delays, cost leakages, and return issues instantly.
✅ Customizable Design: Add new KPIs or filters to match your business model.
✅ Cost-Effective Solution: No additional software or subscription required.
✅ User-Friendly Interface: Anyone can use it — no advanced Excel skills needed.
With this tool, your operations move from reactive to proactive management.
📦 What’s Inside the Dashboard
✔️ Summary Dashboard – Overview of key KPIs.
✔️ Detailed Report Page – Transaction-level insights.
✔️ Data Sheet – Central database for analysis.
✔️ Support Sheet – Pre-configured formulas and references.
Everything is professionally designed and ready for immediate use.
🧭 Who Can Benefit from This Report
-
🏭 Manufacturing Companies – Track production and supplier performance.
-
🚚 Logistics & Warehouse Managers – Monitor delivery timelines and storage efficiency.
-
💰 Finance Teams – Analyze cost trends and returns.
-
🧾 Procurement Teams – Evaluate supplier reliability.
-
🏢 Retailers & Distributors – Identify fulfillment issues and inventory gaps.
This Excel report is built to suit businesses of all sizes, helping streamline supply chain processes across departments.
🔍 Best Practices for Using the Report
1️⃣ Keep your data sheet clean and validated.
2️⃣ Use Excel Tables for automatic range expansion.
3️⃣ Refresh pivot tables regularly.
4️⃣ Apply slicers for targeted analysis.
5️⃣ Use conditional formatting to highlight performance gaps.
6️⃣ Protect formula cells to prevent errors.
💡 With these steps, you’ll always maintain accurate, reliable, and actionable insights.
🔗 Click here to read the Detailed blog post
📺 Visit our YouTube channel for step-by-step tutorials
👉 YouTube.com/@PKAnExcelExpert


Reviews
There are no reviews yet.