In the ever-evolving world of logistics and supply chain management, understanding your revenue flow isn’t optional — it’s a competitive advantage. Introducing the Supply Chain and Logistics Revenue Tracking KPI Dashboard in Excel — a fully automated, visually engaging, and business-ready dashboard designed to help you track revenue KPIs, compare actual vs. target vs. previous year, and make informed, data-driven decisions.
Whether you’re managing warehouse operations, monitoring transportation efficiency, or overseeing financial reporting, this Excel dashboard brings all your critical revenue metrics into one clean, intuitive workspace.
✨ Key Features of the Dashboard
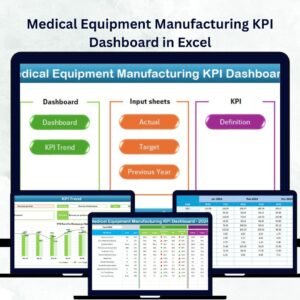
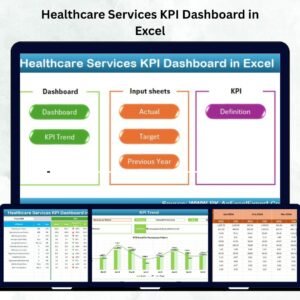
🏠 Home Sheet – Quick Navigation
With six clickable buttons, jump straight to any key section like Dashboard, Trend Sheet, or KPI Definitions — no scrolling needed.
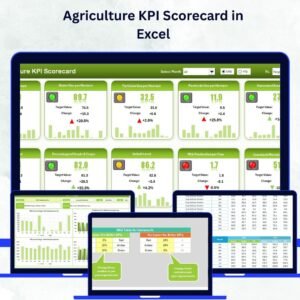
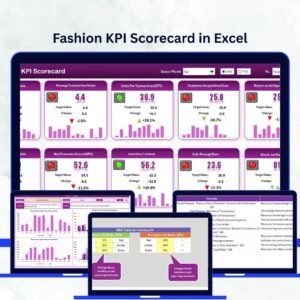
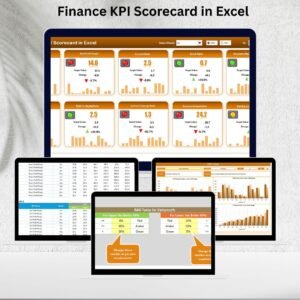
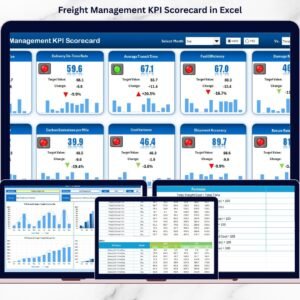
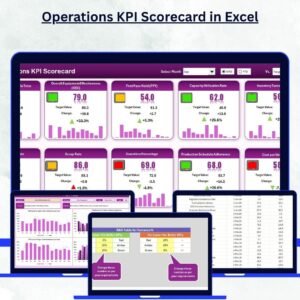
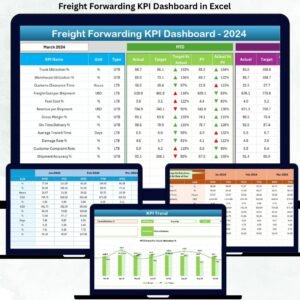
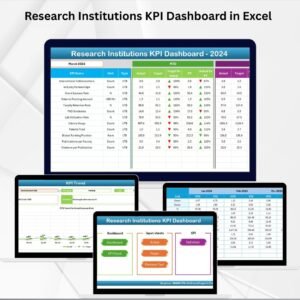
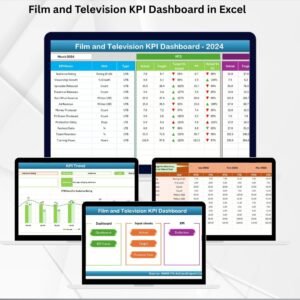
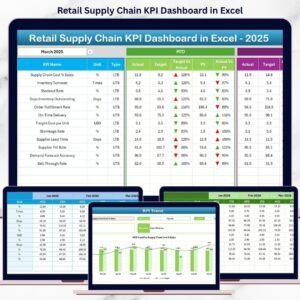
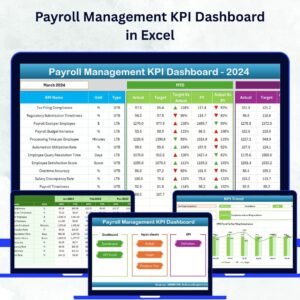
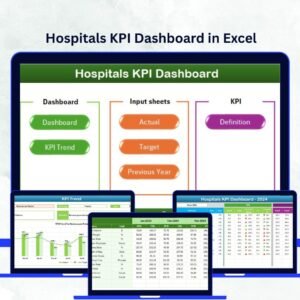
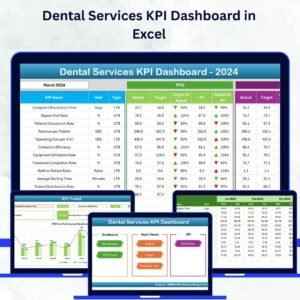
📊 Dashboard Sheet – Real-Time Performance Overview
-
📆 Drop-down Month Selector (D3) to filter the dashboard instantly
-
📈 KPIs with MTD & YTD values — including Actual, Target, and Previous Year
-
⬆️⬇️ Trend Arrows show performance against benchmarks using conditional formatting
-
📉 A perfect at-a-glance snapshot for monthly and yearly reviews
📈 KPI Trend Sheet – See the Bigger Picture
-
🔄 Select any KPI to see trends over 12 months
-
🧠 Metadata displays KPI group, unit, LTB/UTB type, formula & definition
-
📊 View clear MTD & YTD trends for Actual, Target, and PY data
✏️ Actual Numbers Input Sheet – Data Entry Made Easy
-
Enter monthly MTD and YTD values
-
Set the fiscal start month (E1)
-
🎯 All charts, metrics, and visuals update automatically
🎯 Target Sheet – Set Your Financial Goals
-
Define MTD and YTD revenue targets for each KPI
-
Keep your team aligned with measurable goals
📆 Previous Year Sheet – Benchmark YoY Growth
-
Input last year’s values to calculate year-over-year performance
-
Great for forecasting and strategic planning
📚 KPI Definition Sheet – Keep Everyone on the Same Page
-
Includes KPI Name, Group, Unit, Formula, Definition, and Type (UTB or LTB)
-
💡 Ideal for onboarding new team members and maintaining consistency
🚀 Advantages of Using This Excel Dashboard
💰 Track What Matters
Monitor key revenue drivers like Transport Cost %, Delivery Revenue, or Warehouse Profitability — all in one place.
📊 Visual-First Reporting
Conditional formatting, trend lines, and chart visuals make your performance insights easy to digest and present.
⚙️ Fully Editable & Scalable
Add your own KPIs, change formulas, switch currencies, or brand it with your company’s logo.
🧠 No Advanced Skills Required
Clean layout + dropdown filters + auto-updating metrics = Easy for beginners, powerful for pros.
📈 Forecast with Confidence
Compare actuals with last year’s data and anticipate trends before they impact your bottom line.
🧩 Who Should Use This Dashboard?
This Excel template is perfect for:
👨💼 Supply Chain Managers – To oversee profit centers and cost trends
🚛 Logistics Coordinators – To monitor transportation-related revenues
💼 Business Owners – To track logistics ROI and revenue consistency
📊 Financial Analysts – For monthly and quarterly financial reviews
🏭 Operations Teams – To measure cost efficiency and workflow profitability
💡 Best Practices for Using the Revenue KPI Dashboard
✔️ Update Monthly – Keep your data fresh for accurate insights
✔️ Review YoY Trends – Understand long-term growth and seasonal dips
✔️ Customize KPIs – Tailor metrics based on your business goals
✔️ Involve Stakeholders – Share the dashboard across teams
✔️ Present Visually – Use this tool in monthly review meetings
🧠 Why Revenue Tracking Matters in Supply Chains
By using this dashboard, you can:
-
🔍 Detect bottlenecks that reduce profits
-
📦 Measure transportation and warehousing performance
-
🧾 Align budget planning with financial performance
-
💸 Optimize pricing and supplier costs
-
📉 Identify profit-draining inefficiencies early
🔗 Click here to read the Detailed blog post
🎥 Visit our YouTube channel for step-by-step video tutorials


Reviews
There are no reviews yet.