
Subscription-based retail has completely changed how modern businesses sell products and services. From curated product boxes and digital memberships to recurring household essentials, subscription models deliver predictable revenue and long-term customer relationships. Subscription-Based Retail Dashboard in Power BI However, without a clear view of revenue, cost, profit, cancellations, discounts, and customer satisfaction, managing a subscription retail business quickly becomes overwhelming.
That’s where the Subscription-Based Retail Dashboard in Power BI becomes a game-changer.
Subscription-Based Retail Dashboard in Power BI This ready-to-use Power BI dashboard transforms raw subscription data into interactive visuals, KPI cards, and analytical charts that help business leaders understand performance instantly. Instead of relying on multiple static reports, you get a single, centralized dashboard to track financial health, customer behavior, and operational trends. With powerful slicers and professional visuals, this dashboard enables faster decisions, smarter pricing, and better retention strategies ⚡.
Whether you manage a growing subscription startup or an established retail brand, this dashboard becomes your command center for recurring revenue performance.
Key Features of the Subscription-Based Retail Dashboard in Power BI ✨
This dashboard is designed for clarity, depth, and decision-making speed:
📊 All-in-One KPI View – Revenue, cost, profit & satisfaction together
💰 Profit & Margin Tracking – Understand real profitability
❌ Cancellation & Churn Visibility – Identify risks early
🏷️ Discount Impact Analysis – Control margin leakage
⭐ Customer Satisfaction Monitoring – Improve experience
📈 Monthly Trend Analysis – Detect seasonality & growth
🎯 Interactive Power BI Slicers – Analyze by segment, country & product
👔 Executive-Ready Design – Perfect for management reviews
This dashboard is not just a report—it is a subscription retail performance intelligence tool.
What’s Inside the Subscription-Based Retail Dashboard in Power BI 📂
The Power BI file contains 5 interactive analytical pages; each focused on a key business dimension.
📌 1. Overview Page – Executive Performance Snapshot
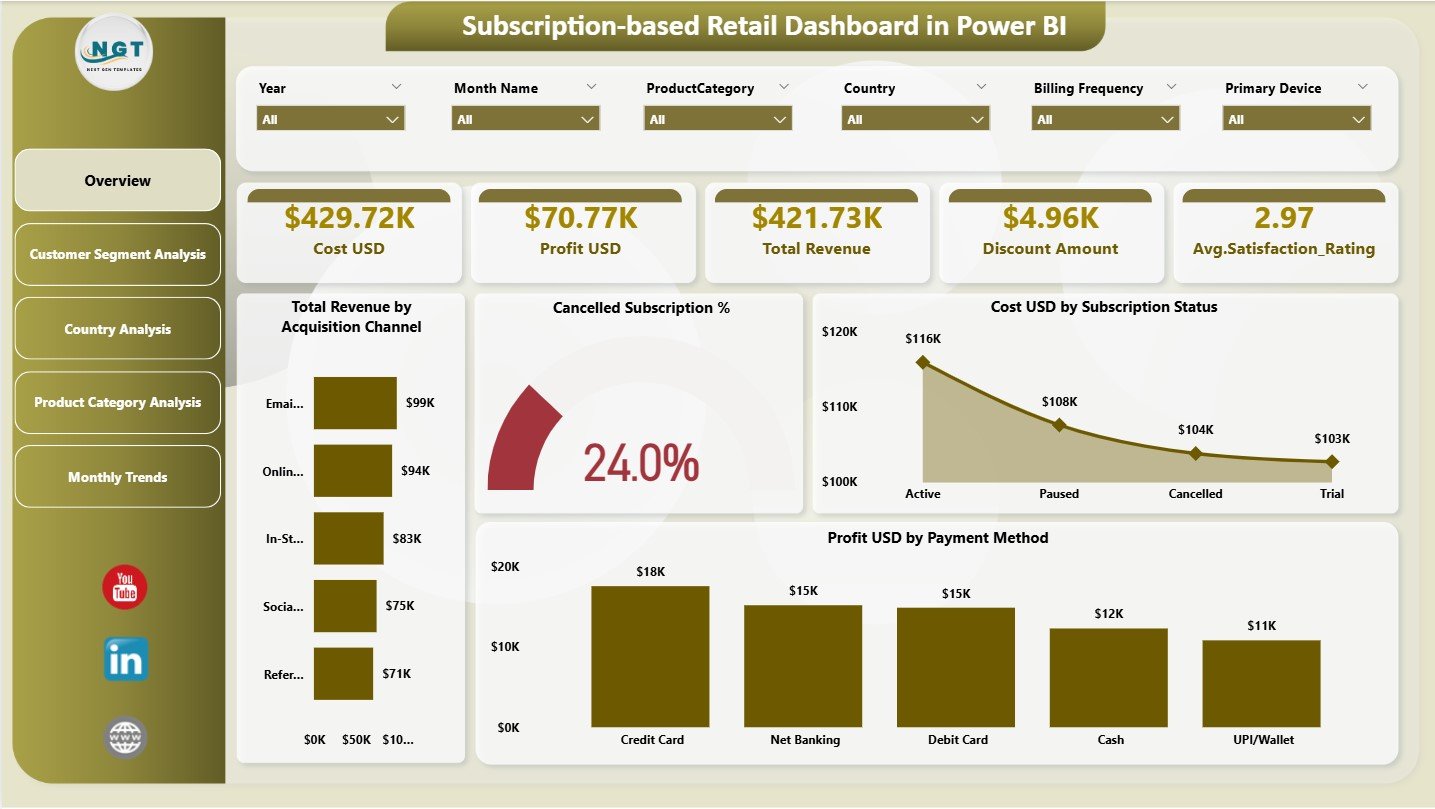
This is the main landing page of the dashboard.
🔹 Top KPI Cards
-
Cost (USD)
-
Profit (USD)
-
Total Revenue
-
Discount Amount
-
Average Satisfaction Rating
🔹 Key Charts
📊 Total Revenue by Acquisition Channel
❌ Cancelled Subscription %
💰 Cost (USD) by Subscription Status
💵 Profit (USD) by Payment Method
With slicers available, users can instantly filter data for deeper insight.
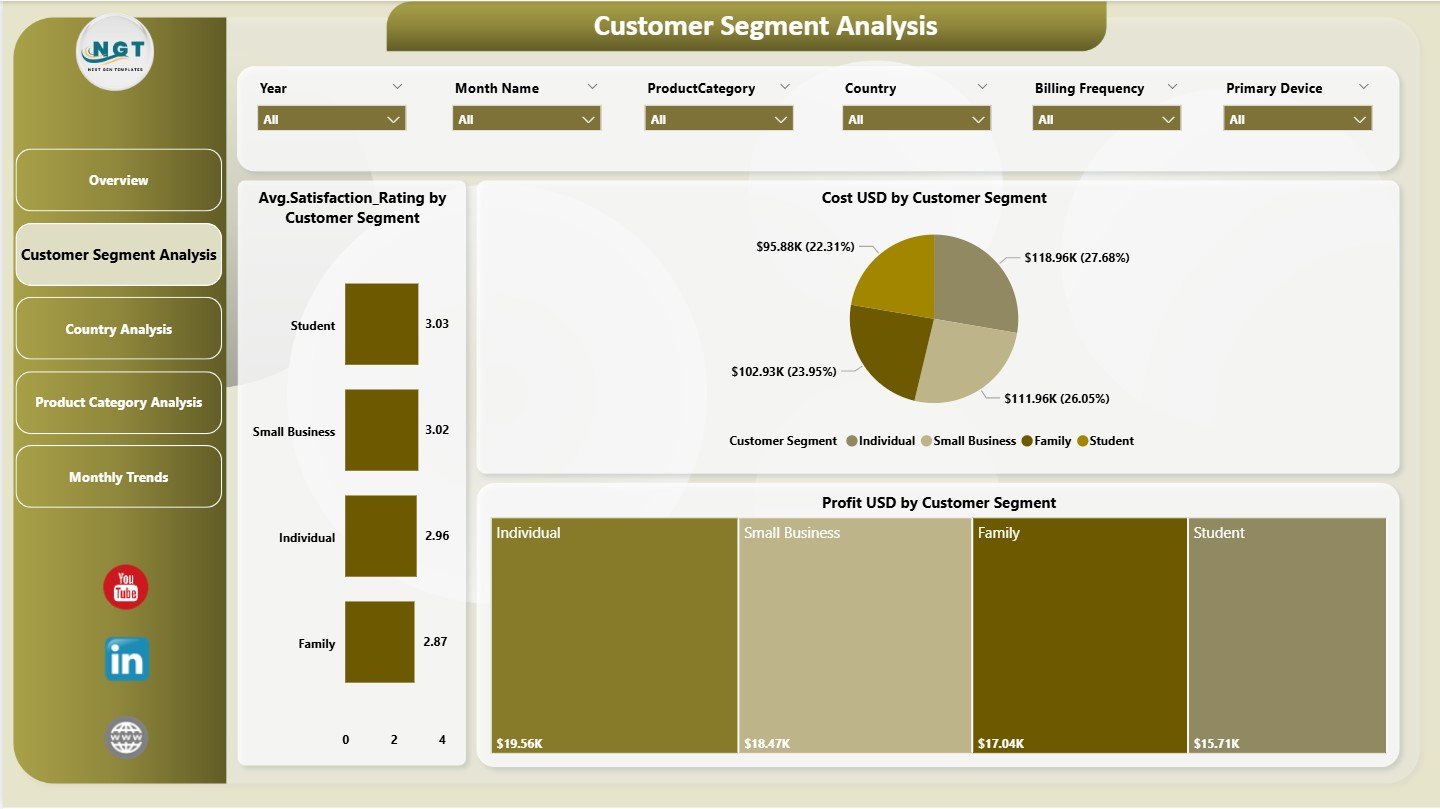
📌 2. Customer Segment Analysis – Understand Your Subscribers
This page focuses on customer-level performance.
📈 Charts Included:
-
Cost (USD) by Customer Segment
-
Profit (USD) by Customer Segment
-
Average Satisfaction Rating by Customer Segment
This analysis helps identify high-value and low-value segments, enabling smarter targeting and pricing strategies.
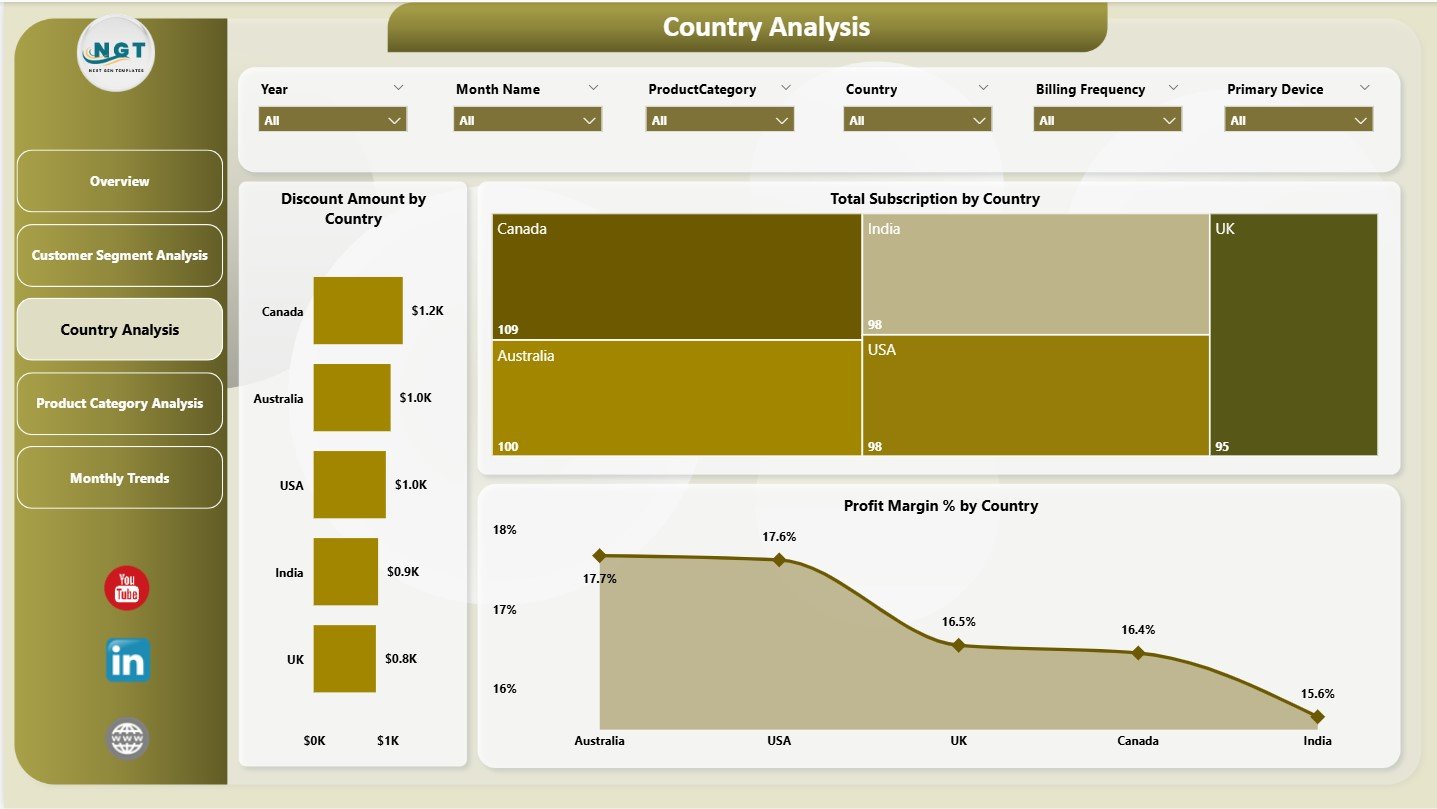
📌 3. Country Analysis – Geographic Performance Insights
Subscription retail performance varies across regions.
🌍 Charts on This Page:
-
Discount Amount by Country
-
Total Subscriptions by Country
-
Profit Margin % by Country
This page supports regional expansion planning and pricing optimization.
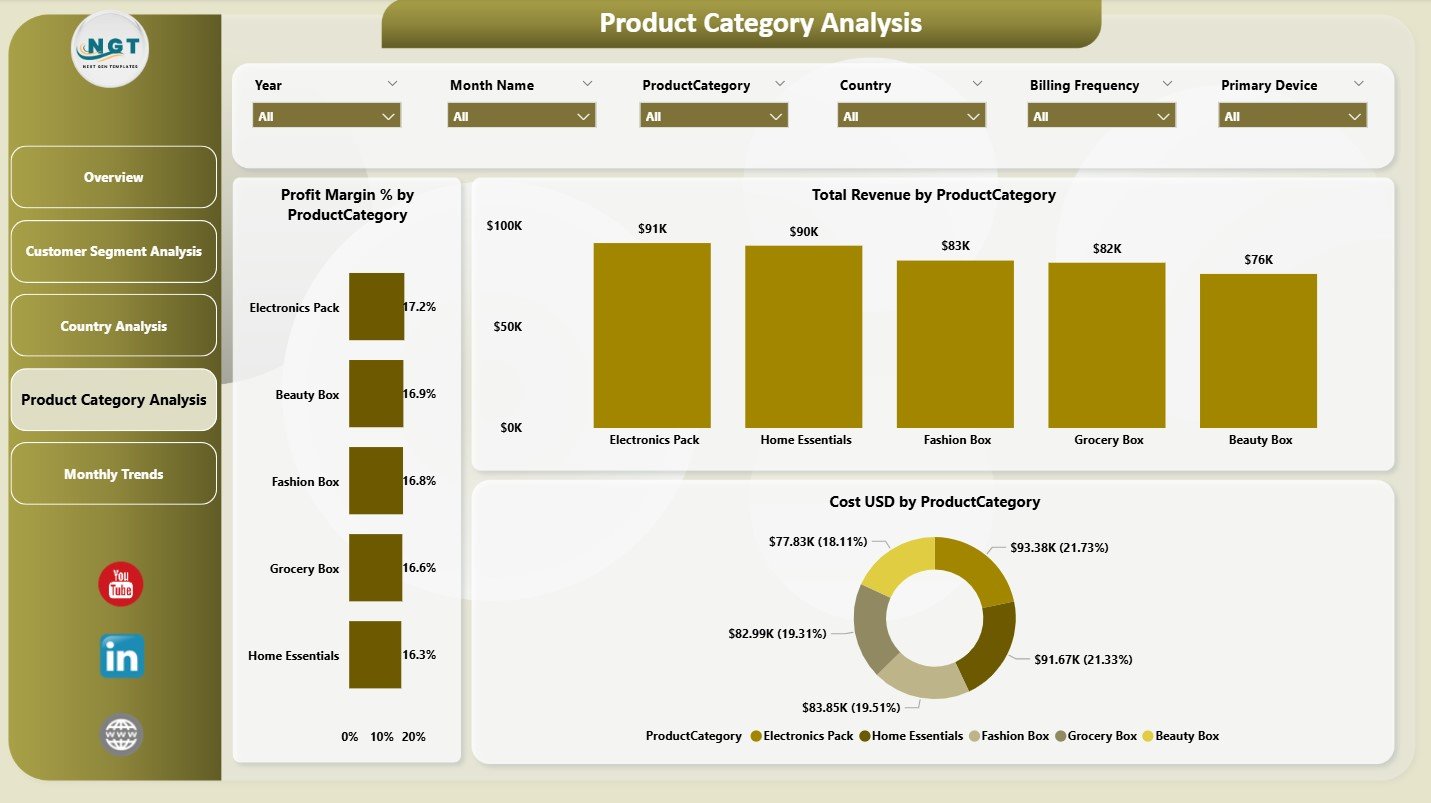
📌 4. Product Category Analysis – Margin-Driven Decisions
Not all products perform equally.
📦 Charts Included:
-
Profit Margin % by Product Category
-
Total Revenue by Product Category
-
Cost (USD) by Product Category
This page helps teams focus on high-margin categories and control costs in weaker ones.
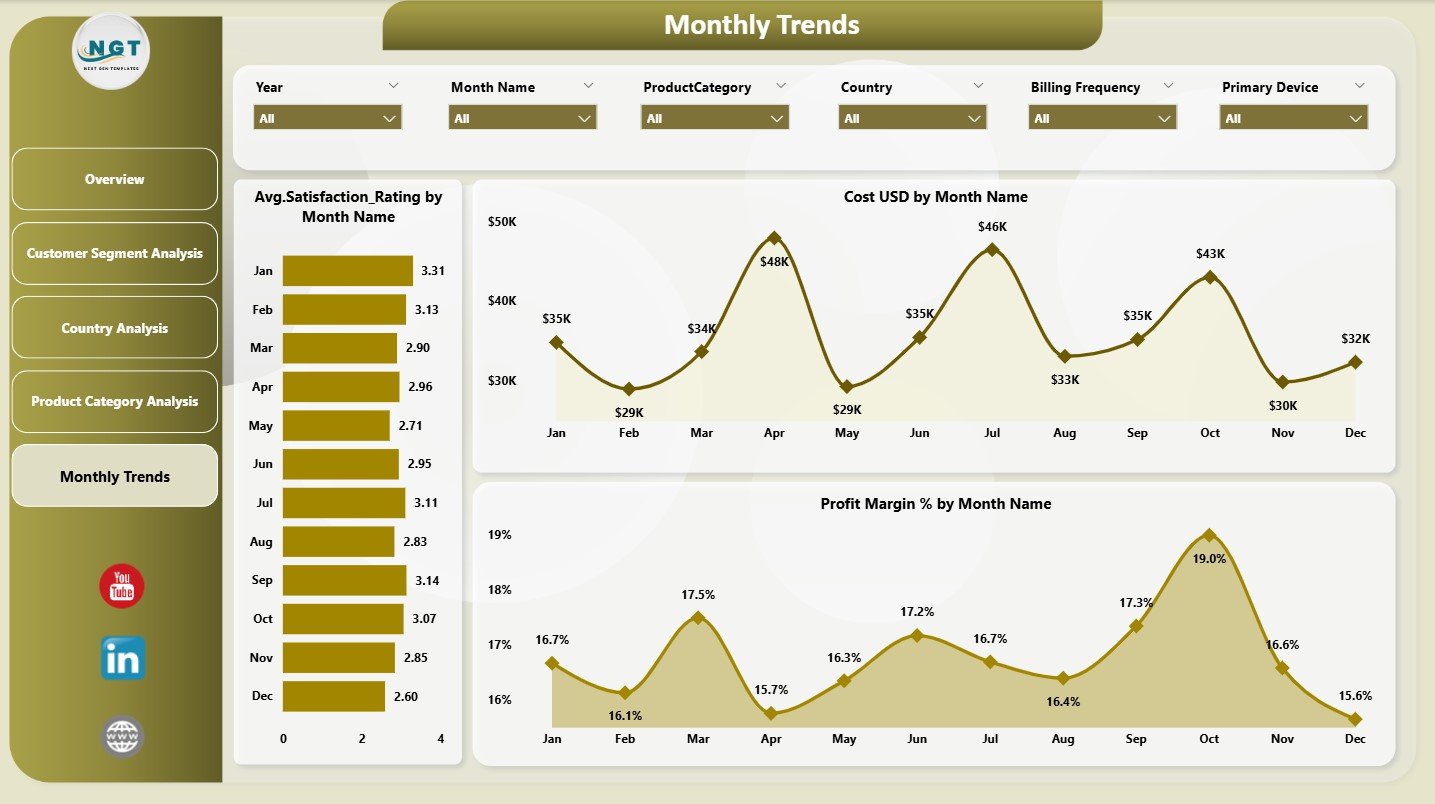
📌 5. Monthly Trends – Growth Over Time
Trends matter more than snapshots.
📅 Monthly Trend Charts:
-
Average Satisfaction Rating by Month
-
Cost (USD) by Month
-
Profit Margin % by Month
This page supports forecasting, promotion planning, and churn prevention.
How to Use the Subscription-Based Retail Dashboard in Power BI 🛠️
Using the dashboard is simple and intuitive:
1️⃣ Load subscription retail data into Power BI
2️⃣ Refresh the dataset
3️⃣ Use slicers to filter by country, segment, product, or time
4️⃣ Review KPI cards for quick insights
5️⃣ Analyze trends, cancellations, and margins
6️⃣ Take action based on clear visuals
No complex coding required 💡.
Who Can Benefit from This Dashboard? 👥
This dashboard is ideal for:
🔁 Subscription Retail Founders & Owners
🛒 E-commerce & Operations Managers
💰 Finance & Revenue Teams
📣 Marketing Teams
📦 Product Managers
📊 Business Analysts
Any business with recurring revenue will benefit.


Reviews
There are no reviews yet.