


🏭 The Steel & Metals Dashboard in Excel is a powerful, ready-to-use analytics tool designed to help manufacturers, engineers, and executives track, analyze, and improve every aspect of their steel and metal operations.
From raw material procurement to energy usage, production efficiency, and customer satisfaction — this Excel-based dashboard brings all critical data together into one interactive and visual platform.
With dynamic slicers, multiple analysis pages, and automated performance summaries, it eliminates manual reporting chaos and empowers leaders to make quick, data-driven decisions that boost profitability and productivity.
✨ Key Features of the Steel & Metals Dashboard in Excel
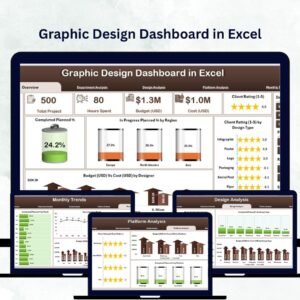
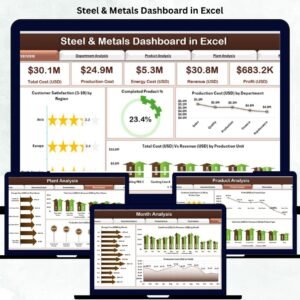
✅ 📊 Overview Page – Business Snapshot at a Glance
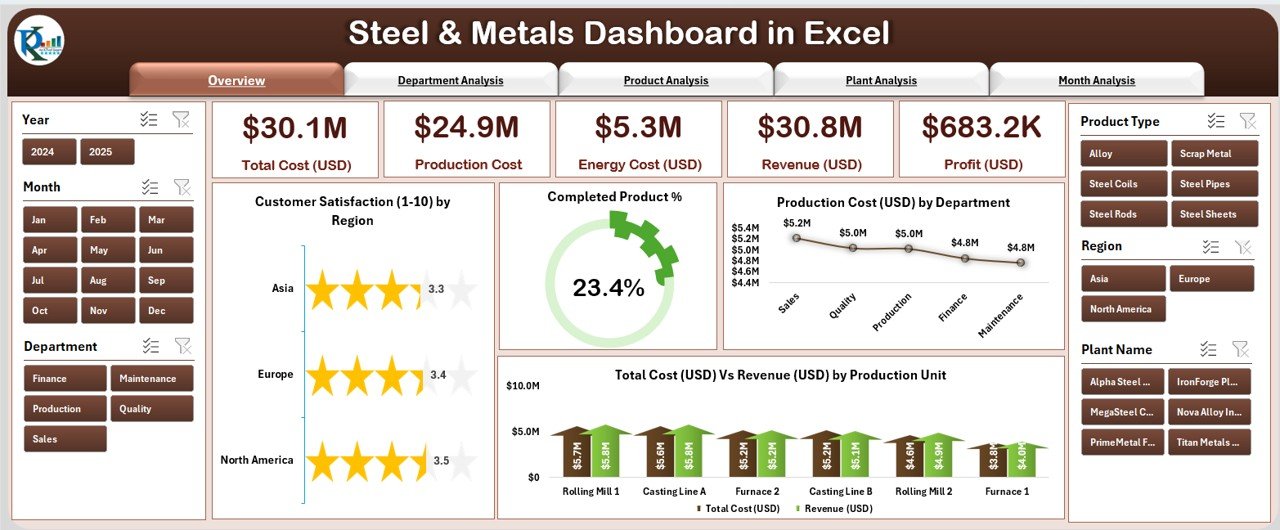
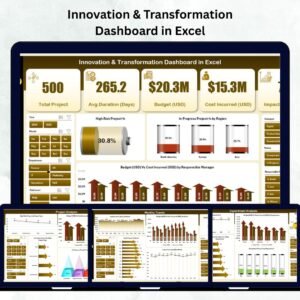
Get a bird’s-eye view of your manufacturing operations with four KPI Cards:
-
Customer Satisfaction (1-10)
-
Completed Product %
-
Product Cost (USD)
-
Total Cost (USD) vs Revenue (USD)
Charts show:
🎯 Customer Satisfaction by Region, Completed Product % by Department, Product Cost by Department, and Total Cost vs Revenue by Product Unit.
This helps management instantly understand which regions, products, or departments are driving profitability.
✅ 🏢 Department Analysis – Compare Team Efficiency
Analyze departmental performance in depth.
Visuals include:
-
Customer Satisfaction (1-10) by Department
-
Total Cost vs Revenue by Department
-
Energy Cost by Department
💡 Identify high-cost or underperforming departments and target improvements precisely.
✅ 🧱 Product Analysis – Measure Profitability by Product Line
See which product lines contribute most to profits and customer satisfaction.
Charts include:
-
Customer Satisfaction by Product
-
Total Cost vs Revenue by Product
-
Profit (USD) by Product Type
💰 Pinpoint high-margin products and those that need pricing or quality adjustments.
✅ 🏭 Plant Analysis – Evaluate Efficiency by Plant
Compare costs, energy usage, and revenue across plants.
Visuals show:
-
Total Cost vs Revenue by Plant
-
Product Cost by Plant
-
Energy Cost by Plant
🔍 Spot inefficiencies or bottlenecks to reduce overhead and maximize output.
✅ 📅 Month Analysis – Track Performance Over Time
Analyze monthly performance trends through:
-
Energy Cost by Month
-
Total Cost vs Revenue by Month
-
Product Cost by Month
📈 Perfect for seasonal trend analysis and performance forecasting.
✅ 🧮 Dynamic Page Navigator & Slicers
Easily move between pages and filter by department, product, month, or plant — making insights fast and flexible.
✅ 💡 Professional Design
Modern visuals, intuitive color coding, and interactive layouts make it presentation-ready for board meetings and reports.
📦 What’s Inside the Steel & Metals Dashboard
📁 Five Analytical Pages:
1️⃣ Overview Page – Executive-level insights.
2️⃣ Department Analysis – Evaluate performance by function.
3️⃣ Product Analysis – Discover product profitability.
4️⃣ Plant Analysis – Compare operational efficiency.
5️⃣ Month Analysis – Review cost and revenue trends.
📊 Supporting Sheets:
-
Data Sheet: Contains all raw inputs (product, plant, department, satisfaction, costs, and revenues).
-
Dashboard Sheet: Displays all visuals and KPIs linked dynamically to data.
🎯 Core KPIs Covered:
-
Customer Satisfaction (1-10)
-
Completed Product %
-
Product Cost (USD)
-
Total Cost (USD)
-
Revenue (USD)
-
Energy Cost (USD)
💡 Designed for clarity, speed, and decision support, this Excel template turns complexity into clarity.
⚙️ How to Use the Steel & Metals Dashboard
1️⃣ Input Data: Add or update data in the “Data” sheet for products, plants, and costs.
2️⃣ Refresh Dashboard: All visuals update automatically — no formulas needed.
3️⃣ Navigate Pages: Use the left-side navigator to switch between Overview, Department, Product, and Month views.
4️⃣ Filter with Slicers: View data by department, plant, or month.
5️⃣ Analyze Trends: Spot which areas are driving or hurting profitability.
6️⃣ Export Results: Save insights as PDF or PowerPoint for meetings.
💡 Pro Tip: Update your data monthly to maintain a real-time business performance view!
👥 Who Can Benefit from This Dashboard
🏭 Manufacturing Leaders – Monitor plant-wise efficiency and production performance.
💼 Finance Teams – Track cost vs revenue for better financial control.
📊 Operations Managers – Identify inefficiencies across departments.
⚙️ Production Engineers – Analyze process cost and output consistency.
📈 Executives & Analysts – Gain actionable insights for strategic planning.
💡 Medium & Large-Scale Industries – Manage multiple plants and product lines easily in one view.
This dashboard transforms your daily operational data into powerful visuals that drive smarter decisions and higher margins.
🔗 Click here to read the Detailed Blog Post
🎥 Visit our YouTube channel to learn step-by-step video tutorials


Reviews
There are no reviews yet.