


Key Features of Startup Hubs KPI Dashboard
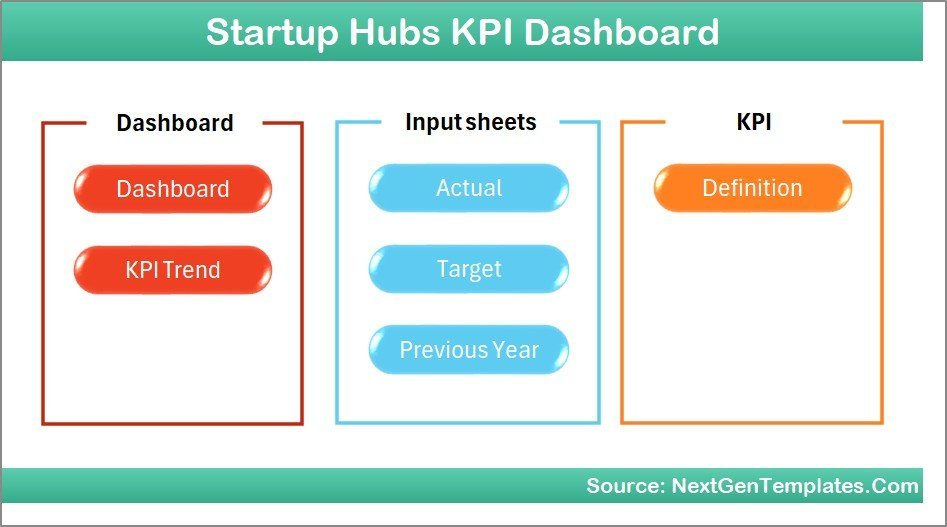
The Startup Hubs KPI Dashboard is an all-in-one digital solution designed to help startups and growing businesses efficiently track and analyze their key performance indicators (KPIs) with ease and accuracy. This comprehensive dashboard is crafted with 7 interactive worksheets, each serving a unique purpose to deliver actionable insights and data visualization tailored to your business needs.
- 🏠 Home Sheet: Acts as the main navigation hub with 6 quick-access buttons linking to respective sheets, making navigation seamless and user-friendly.

Home Page
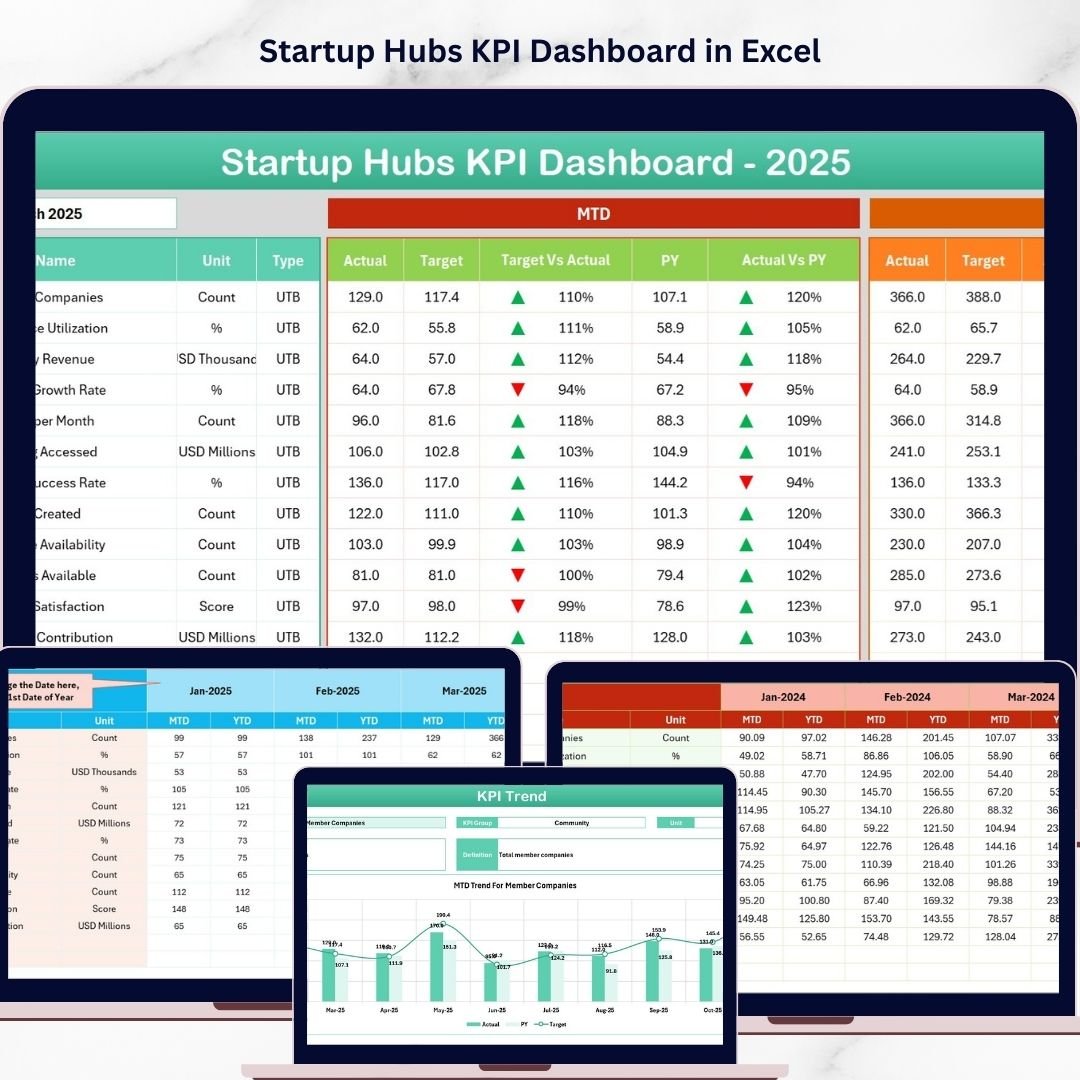
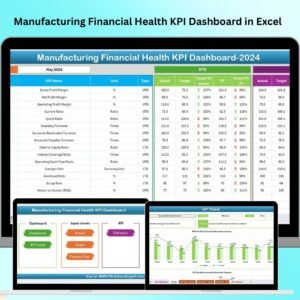
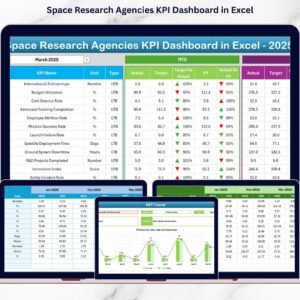
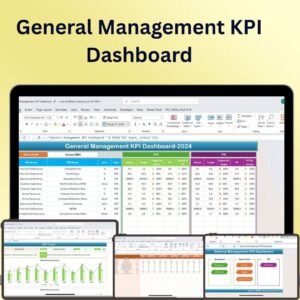
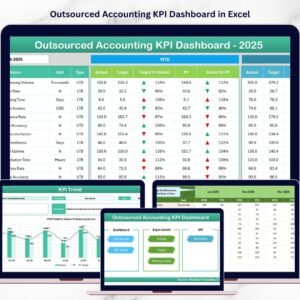
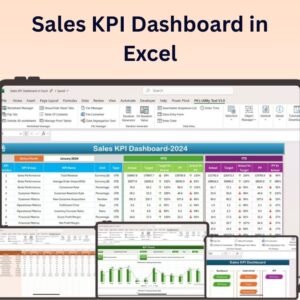
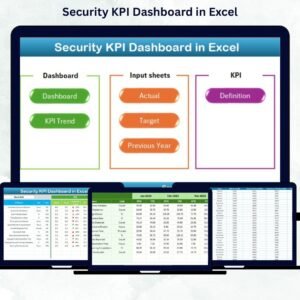
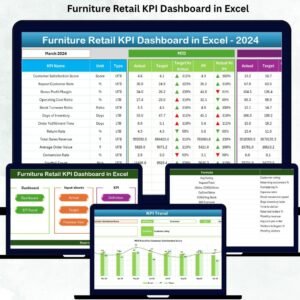
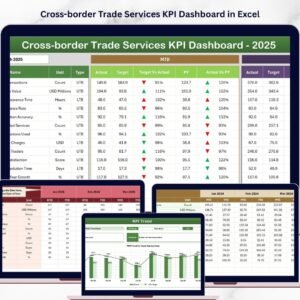
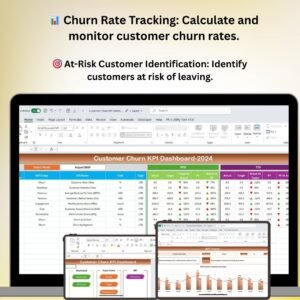
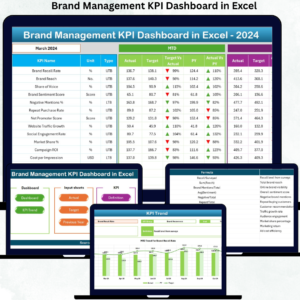
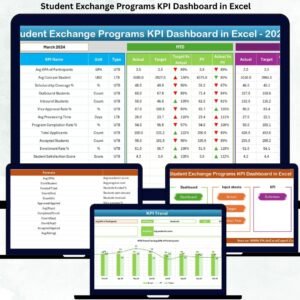
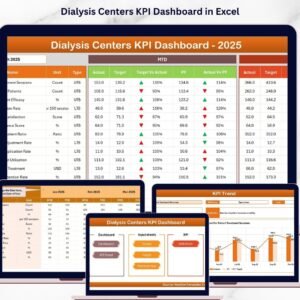
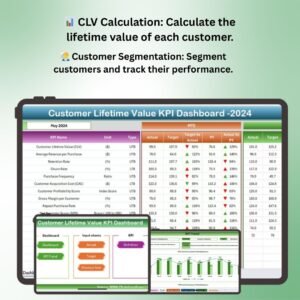
- 📊 Dashboard Sheet: The core of the dashboard where you can select any month from a drop-down to instantly update all KPIs. View Month-to-Date (MTD), Year-to-Date (YTD), Previous Year (PY) data, and compare Targets vs Actuals with intuitive conditional formatting arrows showing performance trends.
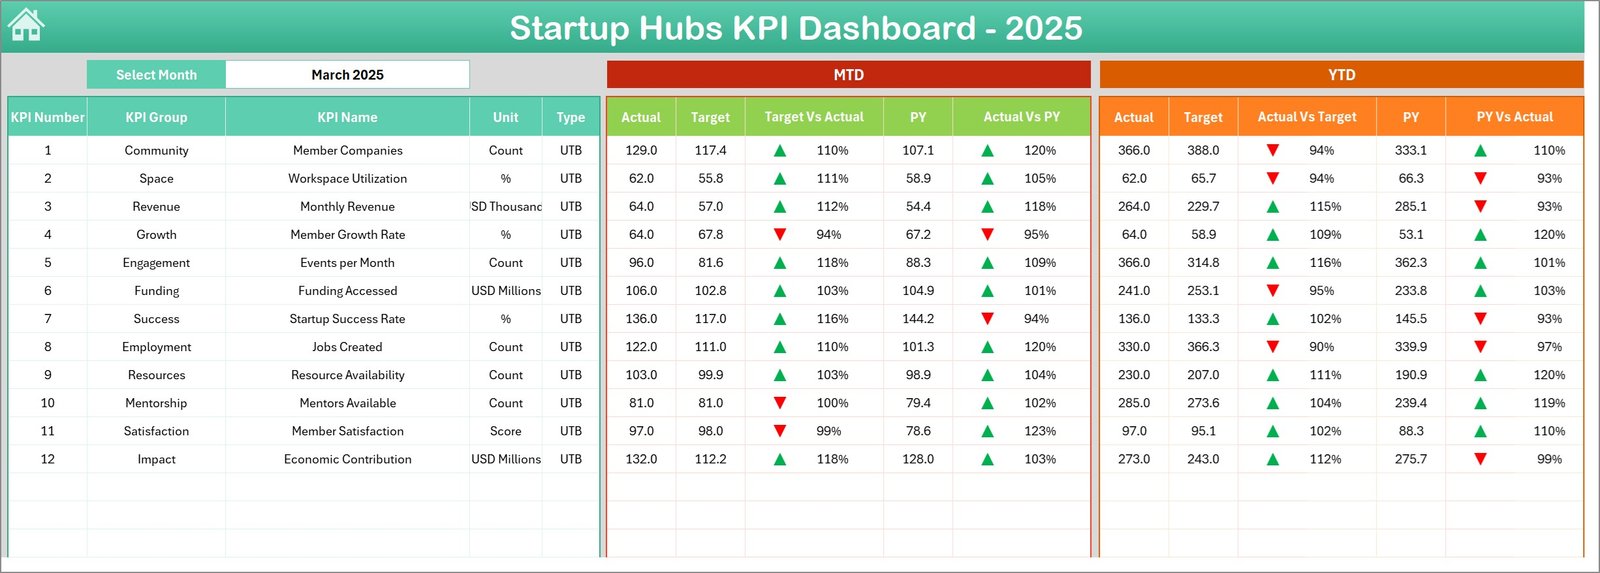
Startup Hubs KPI Dashboard
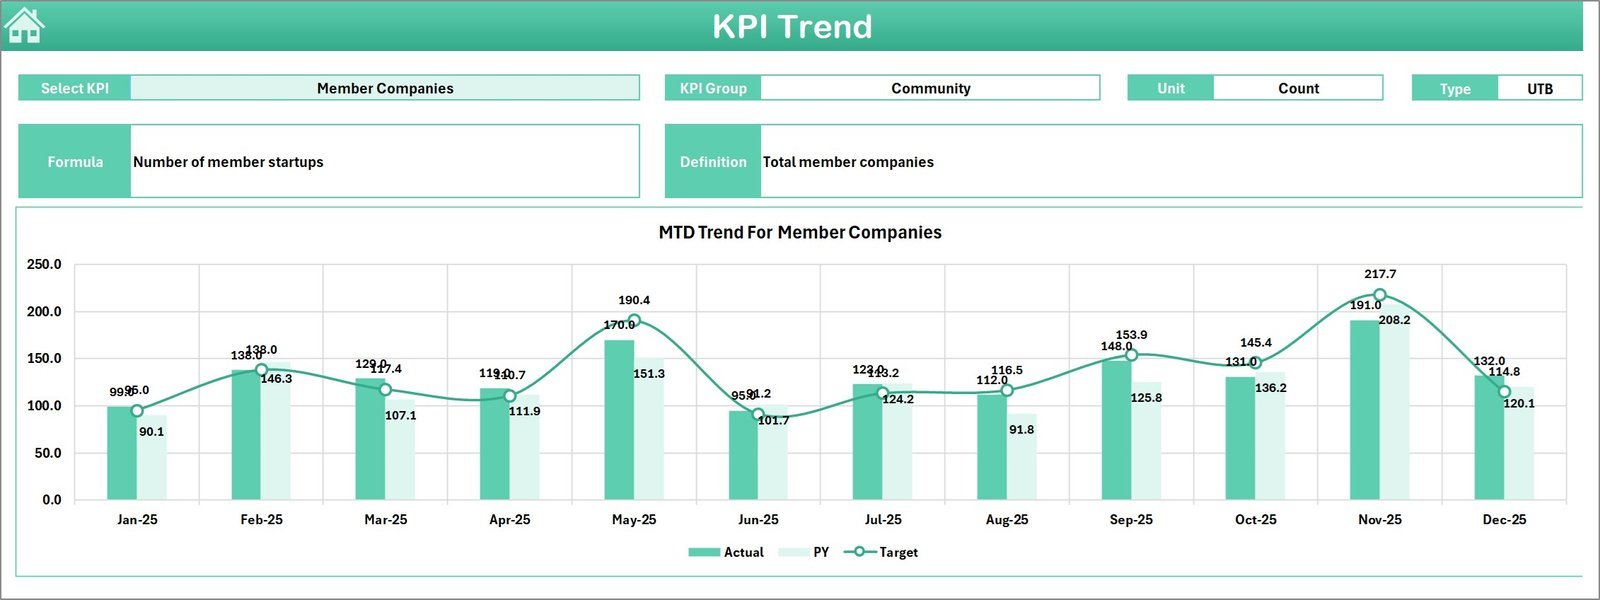
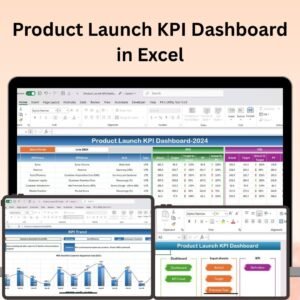
- 📈 KPI Trend Sheet: Select any KPI to reveal detailed KPI group, type (Lower the Better or Upper the Better), formula, and definition. Dynamic trend charts for MTD and YTD actual, target, and PY numbers help visualize progress over time.
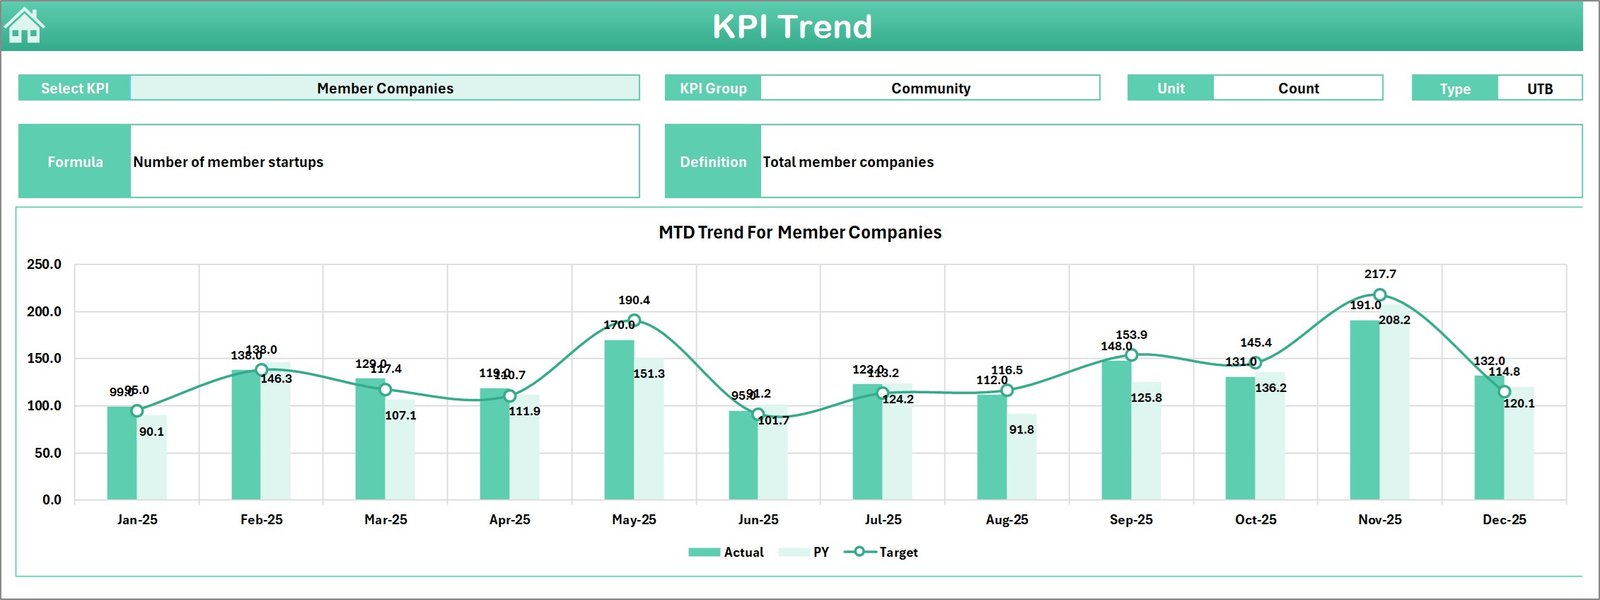
KPI Trend Sheet
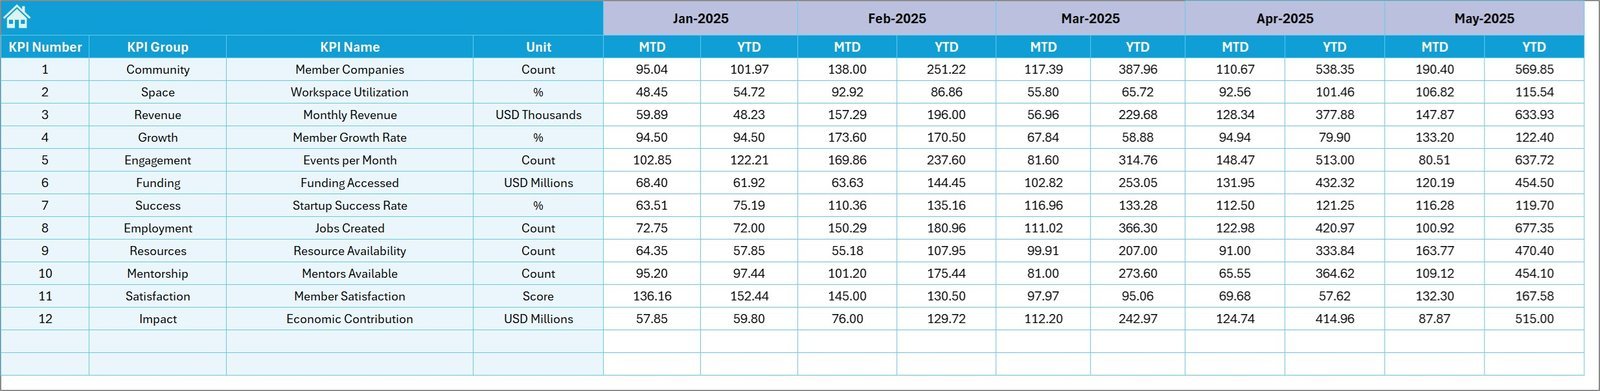
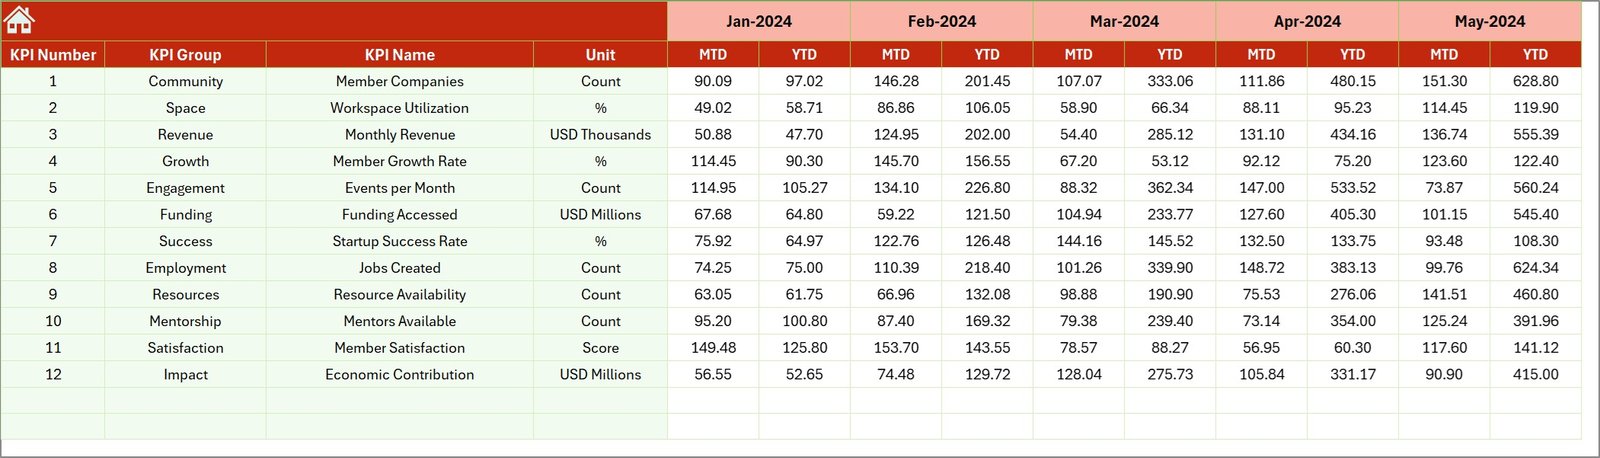
- 📝 Actual Numbers Input Sheet: Easily input actual MTD and YTD data for any month. Just set the first month of the year, and the dashboard adapts accordingly to reflect accurate data.
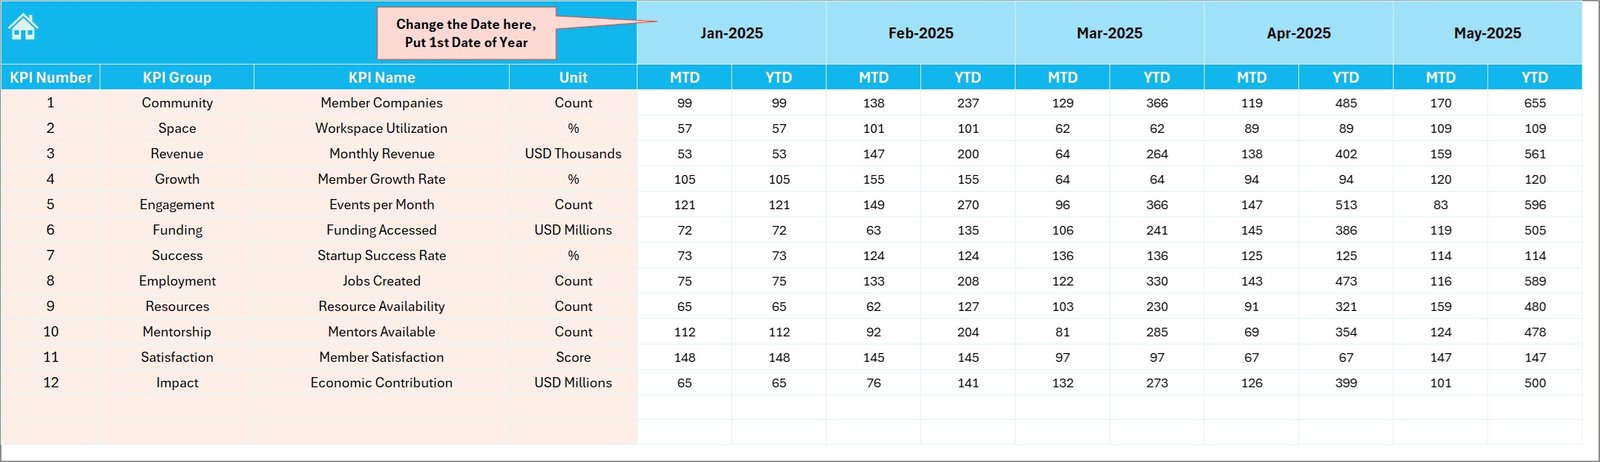
Actual Numbers Input sheet
- 🎯 Target Number Input Sheet: Set your business goals by inputting target values for each KPI, both MTD and YTD, enabling precise performance tracking against objectives.
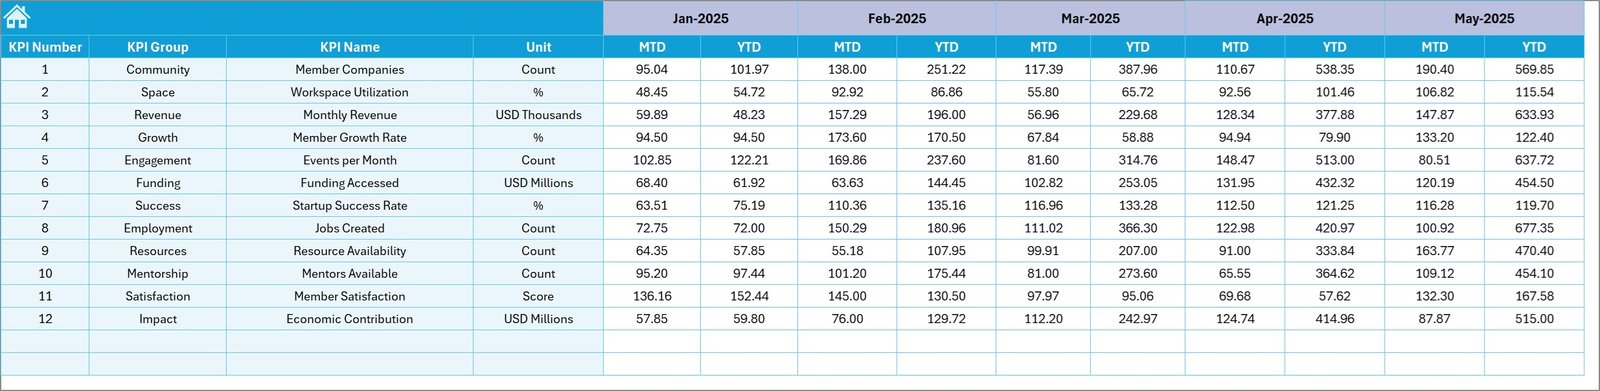
Target Number Input sheet
- 📅 Previous Year Number Sheet: Enter last year’s KPI data to benchmark your current performance and identify growth or gaps easily.
Previous Year Number Input sheet
- 📚 KPI Definition Sheet: Store essential KPI details like name, group, unit, formula, and type (Lower the Better or Upper the Better), ensuring clarity and consistency in KPI measurement.
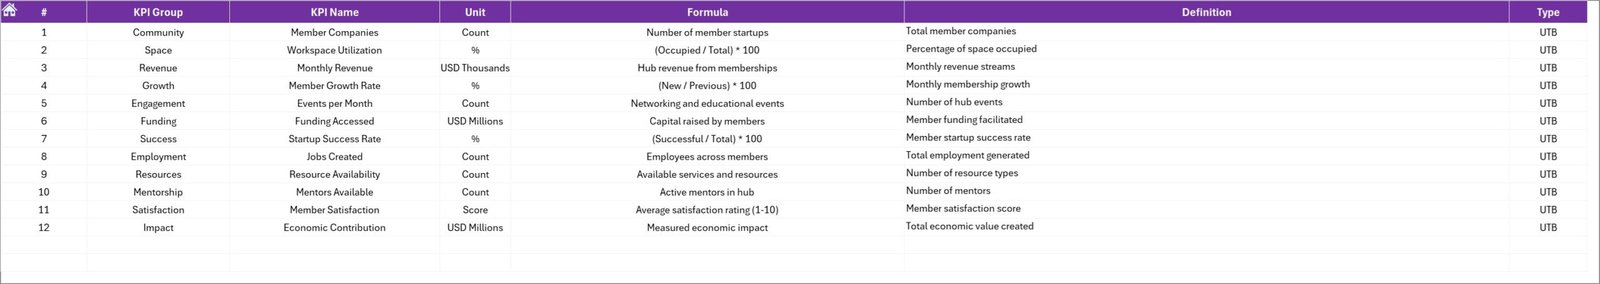
KPI Definition sheet
What’s Inside the Startup Hubs KPI Dashboard
This digital product includes a fully editable Excel-based KPI Dashboard template featuring:
- 👨💼 Seven distinct, integrated worksheets for streamlined KPI tracking and data management
- 📅 Dynamic month selection dropdowns for real-time data updates
- 📉 Conditional formatting with up/down arrows for quick visual performance insights
- 📊 Interactive charts for MTD and YTD trend analysis
- 🖥️ User-friendly interface with intuitive navigation buttons
- 🧮 Space to input actual, target, and previous year KPI data for comprehensive comparison
- 📝 Detailed KPI definitions and formulas for precise understanding and analysis
How to Use the Startup Hubs KPI Dashboard
Getting started with the Startup Hubs KPI Dashboard is straightforward and requires no advanced technical skills. Follow these simple steps:
- 🔢 Begin by entering your actual KPI numbers in the Actual Numbers Input Sheet, setting the first month of your fiscal year.
- 🎯 Input your targets for each KPI in the Target Number Input Sheet for both MTD and YTD.
- 📅 Fill in last year’s KPI data in the Previous Year Number Sheet to establish benchmarks.
- 🔍 Use the KPI Definition Sheet to clearly define each KPI, including formulas and whether the KPI is better when higher or lower.
- 📊 Navigate to the Dashboard Sheet to view performance metrics, select specific months, and analyze your KPIs with visual arrows and charts.
- 📈 For detailed trend analysis, explore the KPI Trend Sheet, where you can select KPIs and observe month-to-month trends.
- 🏠 Use the Home Sheet as your control panel to quickly jump between sheets.
This step-by-step approach ensures precise monitoring and helps you make informed decisions to drive your startup’s growth.
Who Can Benefit from This Startup Hubs KPI Dashboard
If you are a startup founder, business analyst, financial controller, or project manager aiming to boost your company’s performance, this dashboard is tailor-made for you. Specifically, it is beneficial for:
- 🚀 Startup Founders seeking to track critical business metrics and optimize growth strategies.
- 📊 Business Analysts requiring a reliable dashboard to visualize and present KPI data effectively.
- 💼 Financial Controllers who want to monitor financial KPIs against targets and historical data.
- 📈 Project Managers tracking project progress and performance indicators in real time.
- 👩💻 Consultants offering KPI management solutions to startups and SMEs.
- 📉 Anyone focused on data-driven decision-making and performance improvement in startups or small businesses.
With its user-friendly interface and comprehensive data insights, this dashboard empowers you to take control of your startup’s performance and make smarter, faster decisions.
Click here to read the Detailed blog post.
Visit our YouTube channel to learn step-by-step video tutorials


Reviews
There are no reviews yet.