Startup Burn Rate Dashboard in Excel is a comprehensive, pivot-powered analytics template built for startup founders, CFOs, finance teams, and investors who need instant visibility into cash burn, revenue performance, expense breakdown, department-level spending, runway trends, and growth metrics — all from one powerful Excel dashboard. This ready-to-use template includes 5 interactive analysis pages plus a Data Sheet and Support Sheet, covering every critical dimension of startup financial health. It tracks 4 key performance indicators including Total Burn, Total Revenue, Net Burn Amount, and Avg. Cash Balance — all updated dynamically through pivot tables and slicers.
Whether you are running a seed-stage startup or managing a Series B company’s finances, this dashboard delivers instant clarity on budget variance, expense category analysis, department-level burn, monthly runway trends, and customer growth patterns. Simply paste your data, click Refresh All, and watch every chart update automatically. Explore more Excel Dashboard Templates from our collection. If you prefer browser-based dashboards, check out the Startup Burn Rate Dashboard in HTML for an interactive alternative.
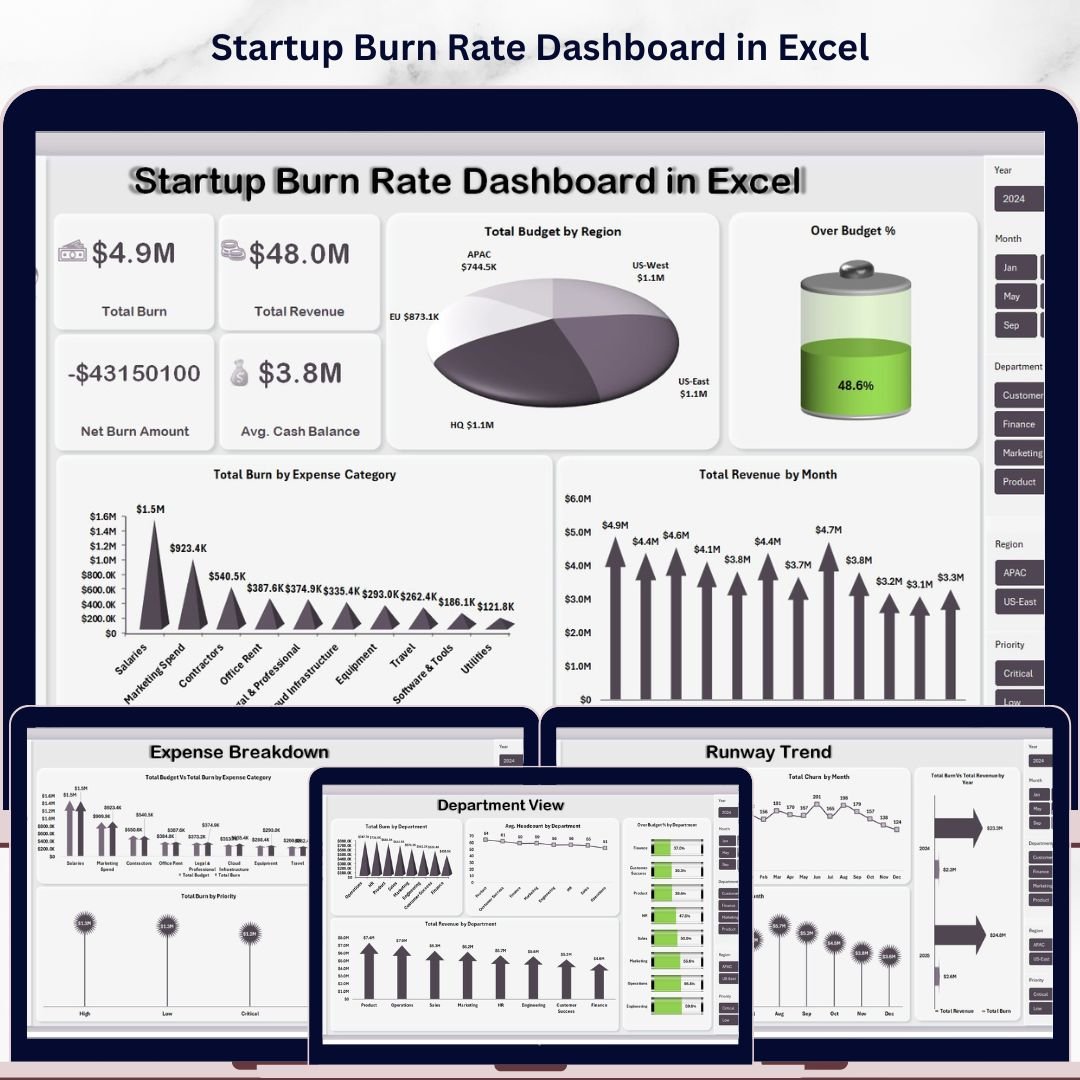
Startup Burn Rate Dashboard in Excel
🔑 Key Features of Startup Burn Rate Dashboard in Excel
📌 5 Interactive Dashboard Pages — Overview, Expense Breakdown, Department View, Runway Trend, and Growth Metrics provide a 360-degree view of your startup’s financial health in Excel.
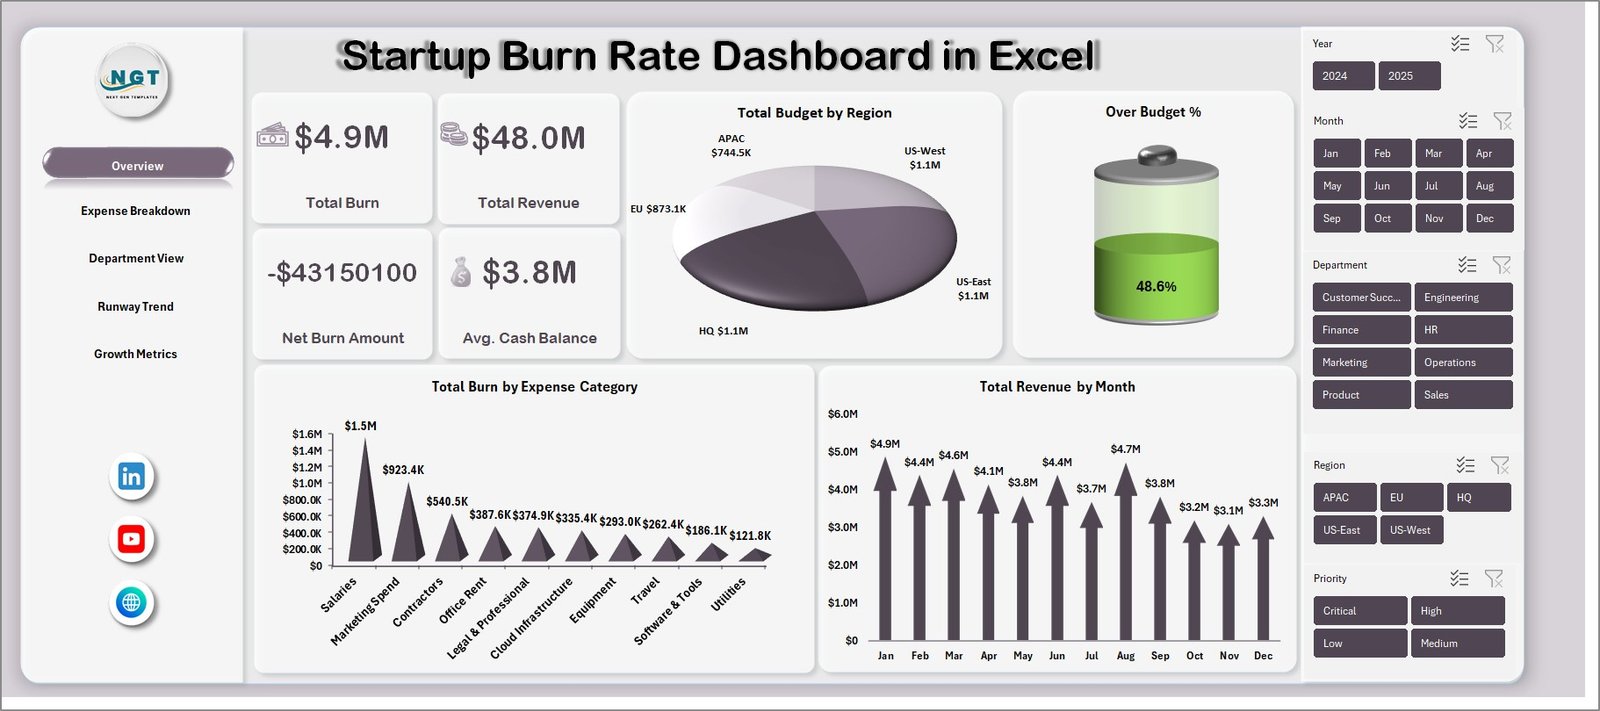
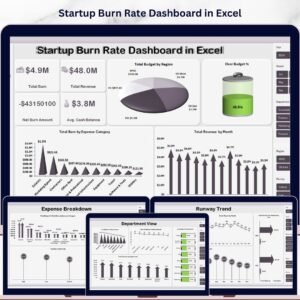
📌 4 High-Level KPI Cards — The Overview page displays Total Burn, Total Revenue, Net Burn Amount, and Avg. Cash Balance at a glance so you can monitor startup health instantly.
📌 Dynamic Pivot-Powered Charts — All charts are connected to pivot tables in the Support sheet. Update your data and click Refresh All to instantly update every visual across all pages.
📌 Multiple Slicers for Quick Filtering — Apply filters across the dashboard to drill down by region, expense category, department, funding stage, status, and month for targeted analysis.
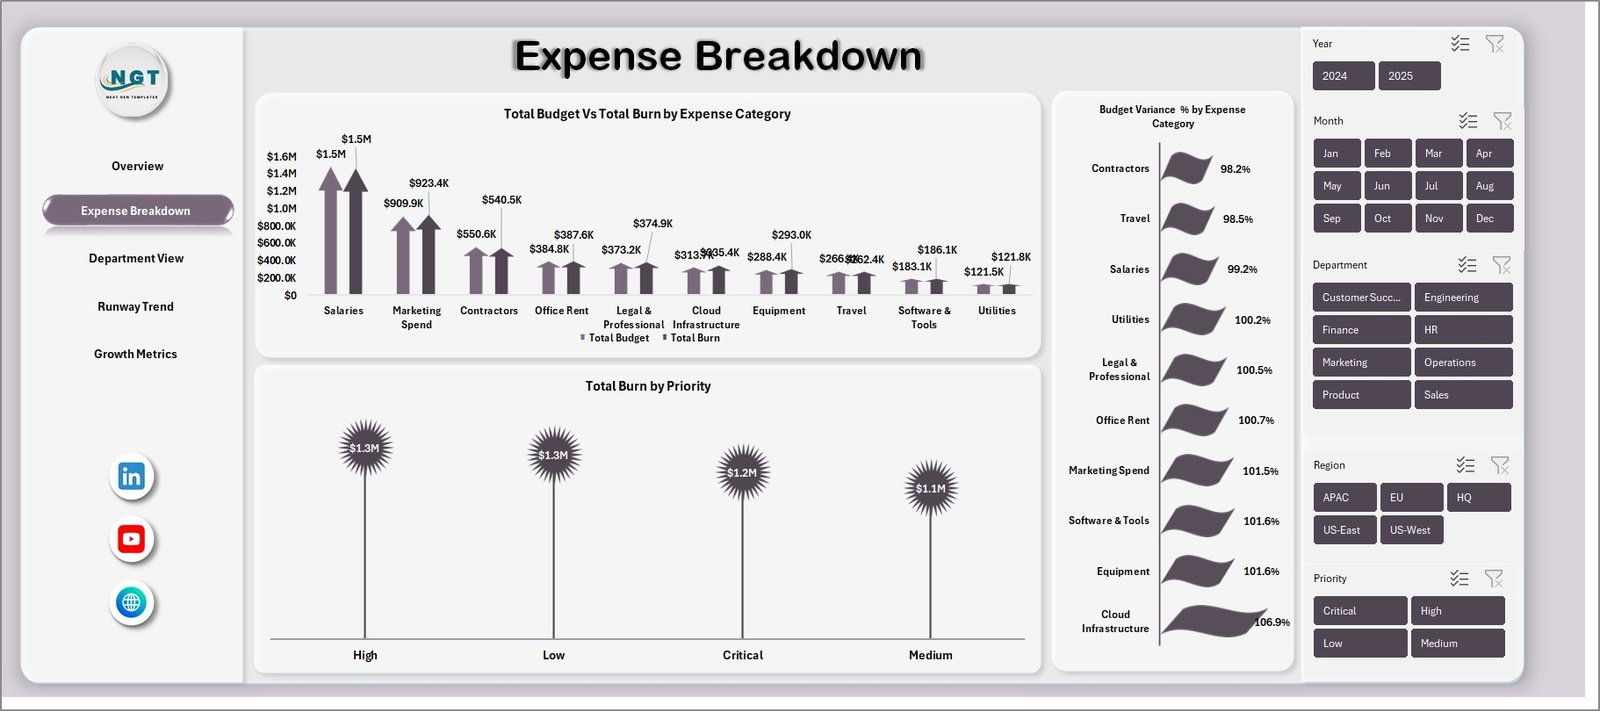
📌 Budget vs Actual Variance Analysis — Compare Total Budget vs Total Burn by Expense Category and Budget Variance % to identify overspending areas immediately.
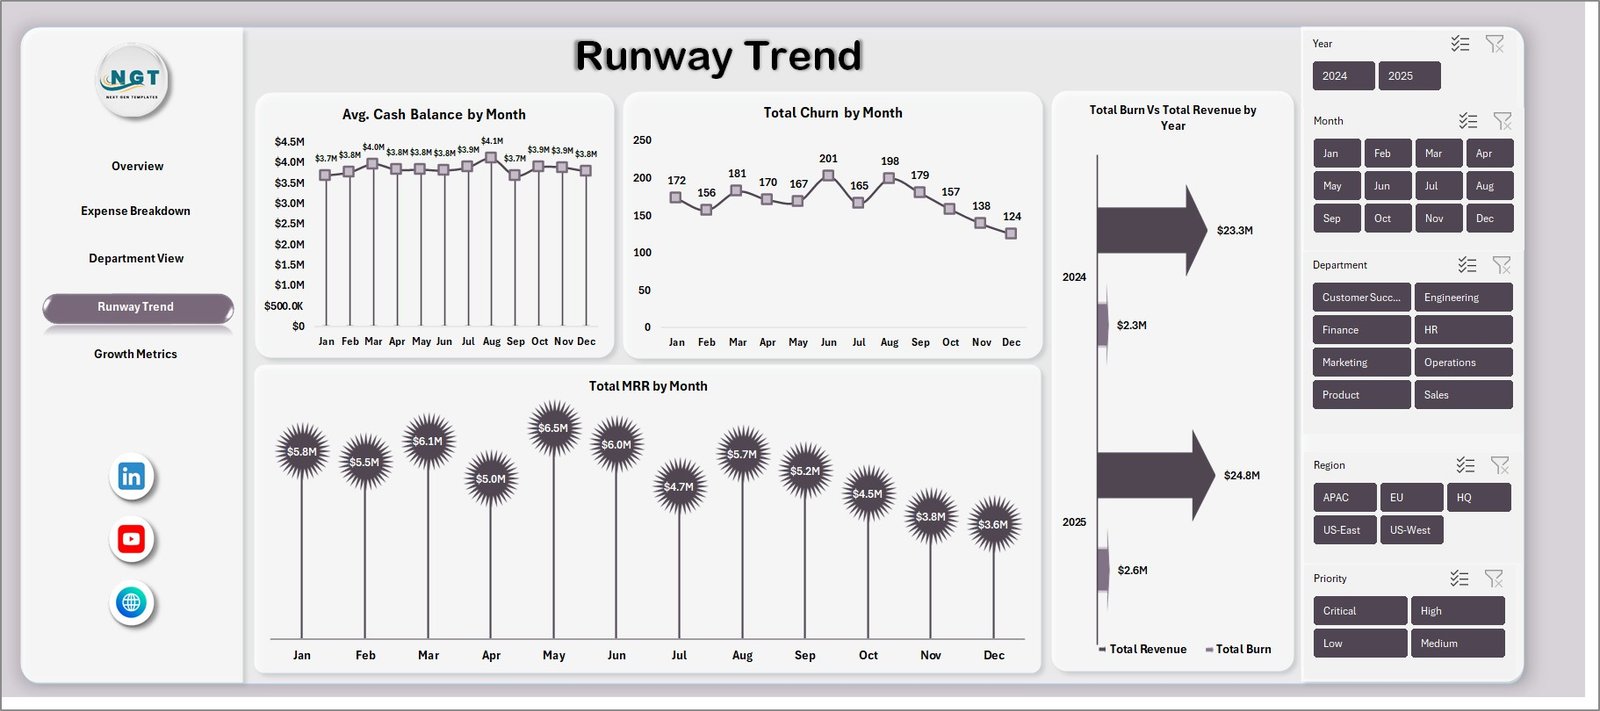
📌 Runway and Cash Flow Tracking — Monitor Avg. Cash Balance by Month, Total Burn vs Total Revenue by Month, and Total MRR by Month to forecast your runway accurately.
📌 No VBA or Macros Required — 100% formula and pivot-table driven. Works on Excel 2016 and later, including Microsoft 365.
📦 What’s Inside the Startup Burn Rate Dashboard in Excel
This dashboard template includes 7 sheet tabs organized for maximum usability:
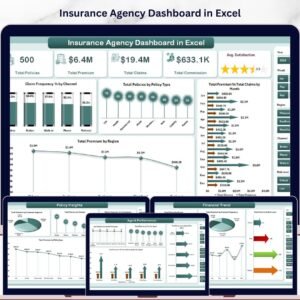
📊 Overview Page — Displays 4 KPI cards (Total Burn, Total Revenue, Net Burn Amount, Avg. Cash Balance) and analytical charts: Total Budget by Region, Over Budget % analysis, Total Burn by Expense Category, and Total Revenue by Month. Multiple slicers let you filter the entire dashboard instantly.
📊 Expense Breakdown — Deep dives into expense analysis with Total Budget Vs Total Burn by Expense Category, Budget Variance % by Expense Category, and Total Burn by Priority — helping you pinpoint exactly where your money is going and which categories exceed budget.
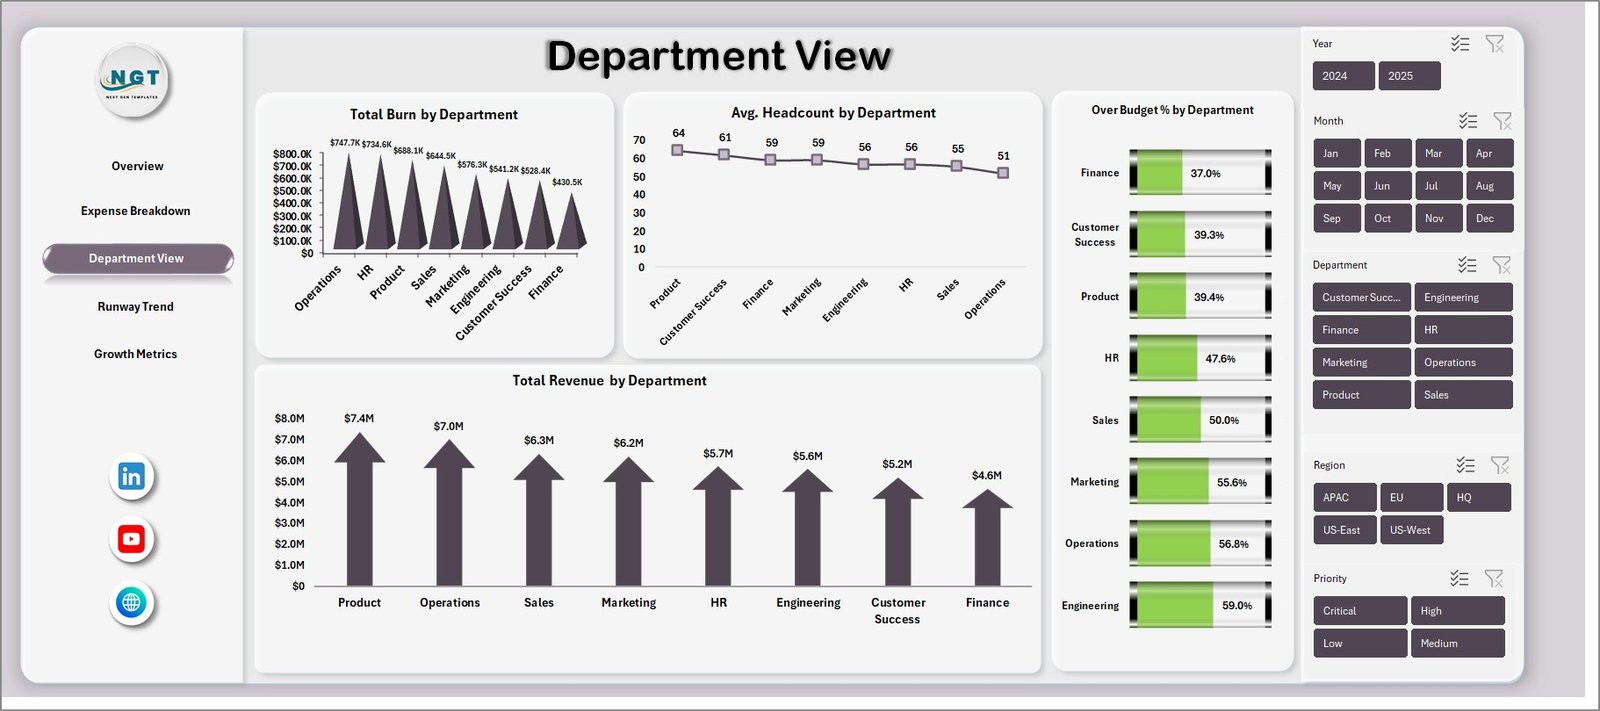
📊 Department View — Tracks Total Burn by Department, Avg. Headcount by Department, Over Budget % by Department, and Total Revenue by Department to evaluate department-level spending efficiency and headcount cost allocation.
📊 Runway Trend — Forward-looking analytics including Avg. Cash Balance by Month, Total Churn by Month, Total Burn Vs Total Revenue by Month, and Total MRR by Month so you can forecast your cash runway and identify financial trends over time.
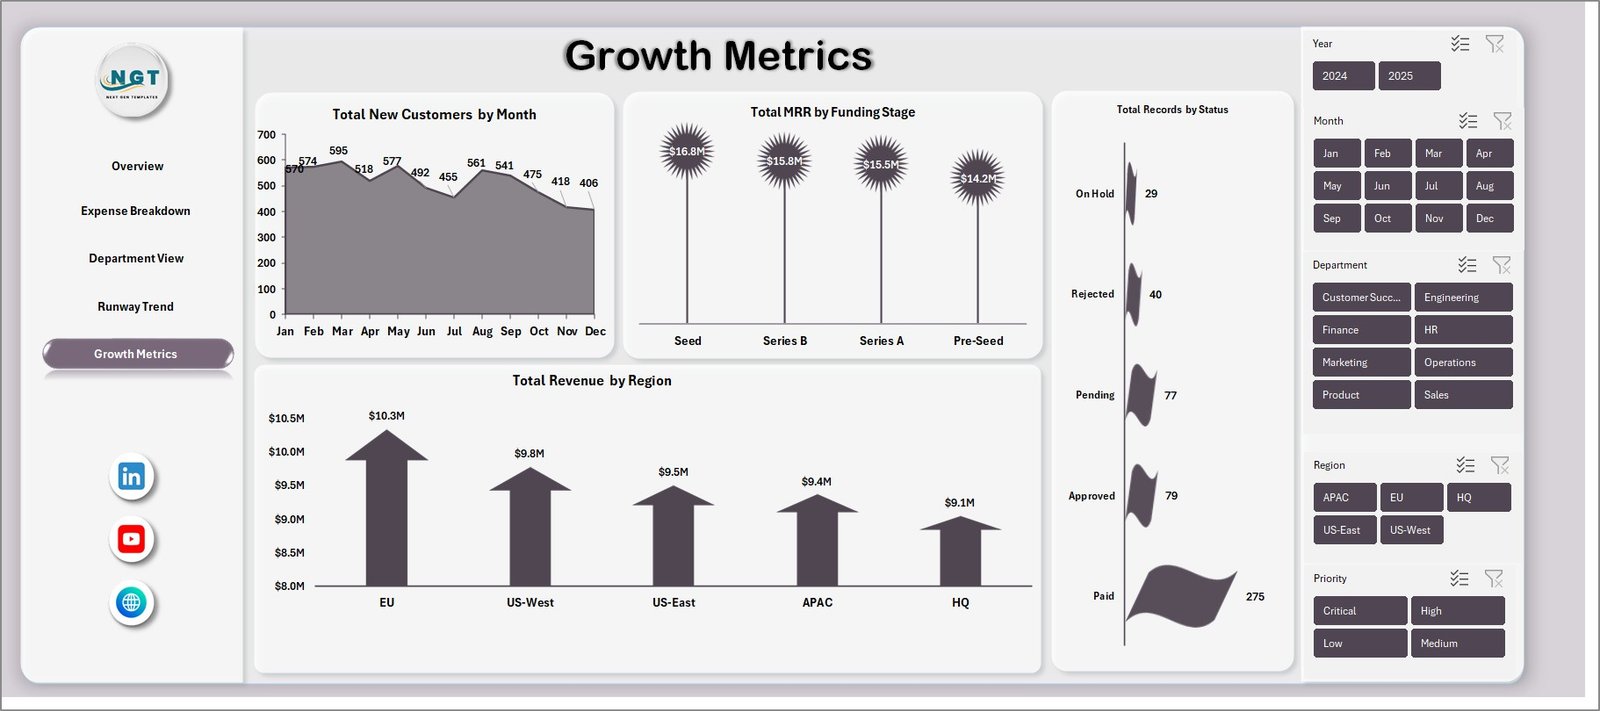
📊 Growth Metrics — Monitors Total New Customers by Month, Total MRR by Funding Stage, Total Records by Status, and Total Revenue by Region to track growth trajectory and customer acquisition performance.
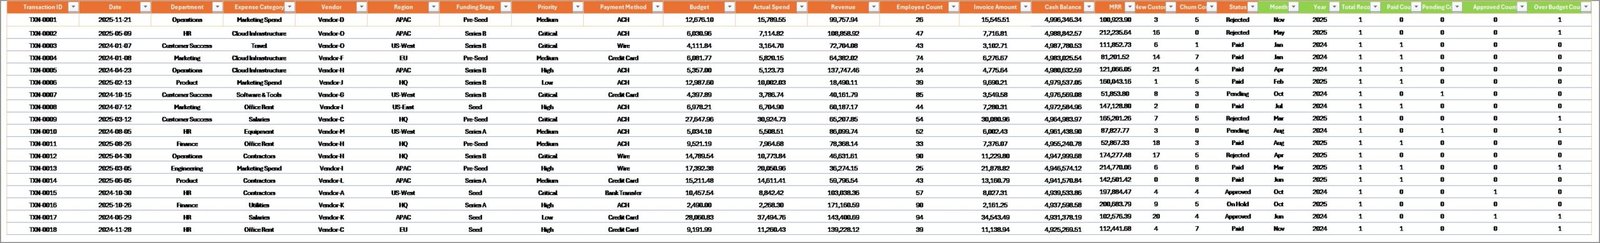
📊 Data Sheet — The central data repository where you add your startup financial records in the predefined format. Simply replace the sample data with your own.
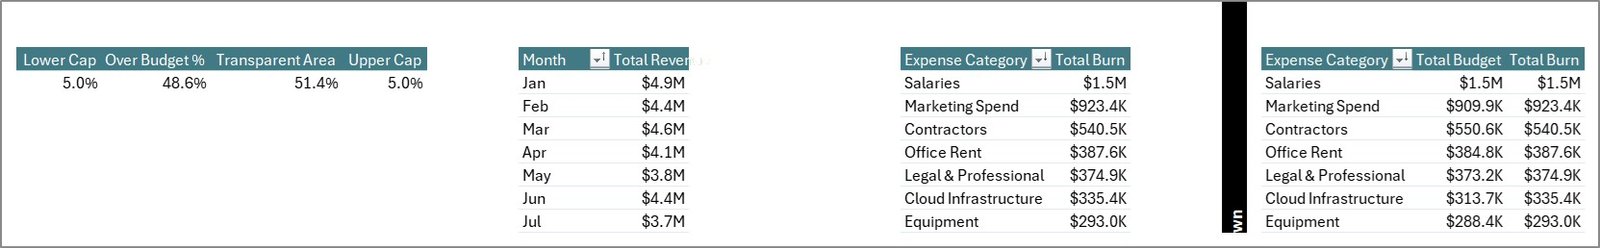
📊 Support Sheet — Contains all pivot tables powering the dashboard. After updating data, go to the Data tab in the Excel Ribbon and click Refresh All. Keep this sheet hidden during presentations.
⚙️ How to Use the Startup Burn Rate Dashboard in Excel
📌 Step 1: Download and open the Excel file in Microsoft Excel 2016 or later.
📌 Step 2: Navigate to the Data Sheet tab and replace the sample data with your own startup financial records in the same column format.
📌 Step 3: Go to the Data tab in the Excel Ribbon and click Refresh All to update all pivot tables and charts.
📌 Step 4: Use the slicers on each dashboard page to filter by region, expense category, department, funding stage, or month.
📌 Step 5: Explore each of the 5 dashboard pages for targeted insights on burn rate, expenses, departments, runway, and growth.
👥 Who Can Benefit from This Startup Burn Rate Dashboard in Excel
📌 Startup founders and CEOs tracking monthly burn rate, revenue, and cash runway
📌 CFOs and finance managers monitoring budget vs actual variance across departments
📌 Investors and board members reviewing startup financial health and growth metrics
📌 Operations managers analyzing department-level burn and headcount costs
📌 Startup accelerators and incubators evaluating portfolio company performance
📌 Financial analysts preparing burn rate reports and runway forecasts
Also explore the Subscription Business Dashboard in HTML and the SaaS Financial Model Dashboard in HTML for related startup analytics templates.
❓ Frequently Asked Questions
What KPIs does the Startup Burn Rate Dashboard in Excel track?
The Startup Burn Rate Dashboard in Excel tracks 4 key performance indicators on the Overview page: Total Burn, Total Revenue, Net Burn Amount, and Avg. Cash Balance. Additional analysis across 4 more pages covers expense breakdown by category, department-level burn, monthly runway trends, MRR tracking, and customer growth metrics.
Do I need advanced Excel skills to use this burn rate dashboard?
No. Simply replace the sample data in the Data Sheet tab with your own startup records and click Refresh All. All pivot tables and charts update automatically — no formulas to edit or macros to enable.
Can I track budget vs actual spending with this dashboard?
Yes. The Expense Breakdown page includes Total Budget Vs Total Burn by Expense Category and Budget Variance % by Expense Category charts, letting you instantly see which areas exceed budget.
How do I forecast my startup’s cash runway using this dashboard?
The Runway Trend page shows Avg. Cash Balance by Month and Total Burn Vs Total Revenue by Month, giving you a clear picture of how long your current cash reserves will last based on your burn pattern.
What is the best Excel dashboard template for tracking startup burn rate?
The Startup Burn Rate Dashboard in Excel from NextGenTemplates is one of the most comprehensive options available, featuring 5 dedicated analysis pages, KPI cards, budget variance analysis, runway forecasting, and growth metrics — all pivot-powered with interactive slicers.
🔗 Explore Related Templates
📌 Startup Burn Rate Dashboard in HTML — The same burn rate analytics in a browser-based interactive HTML dashboard.
📌 Subscription Business Dashboard in HTML — Track MRR, churn, ARPU, and subscriber growth for SaaS and subscription businesses.
📌 SaaS Financial Model Dashboard in HTML — Complete financial modeling template for SaaS companies with revenue projections and burn rate tracking.
📖 Click here to read the Detailed Blog Post
Watch the step-by-step video tutorial:


Reviews
There are no reviews yet.