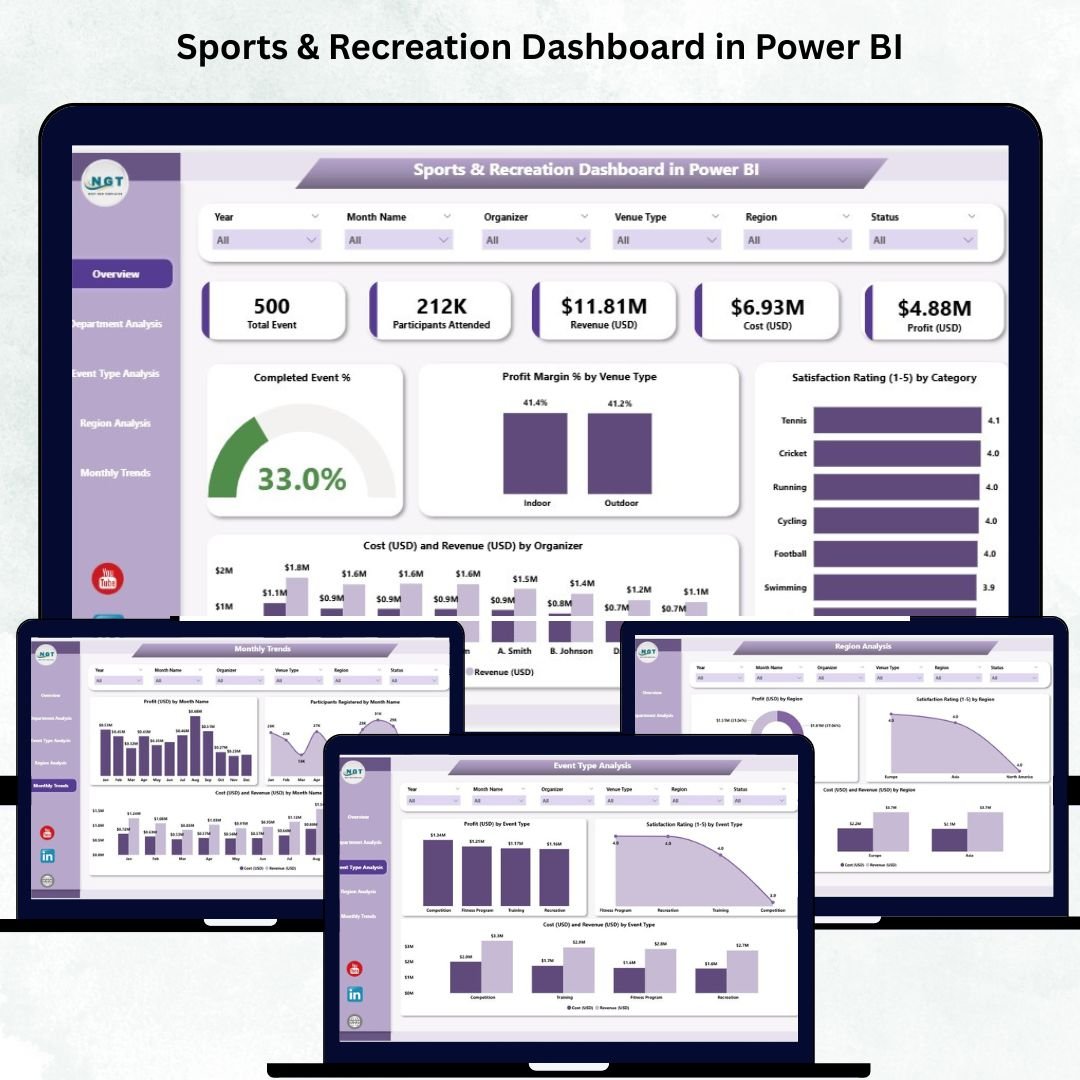
Managing sports programs, events, and recreation activities involves juggling multiple variables — performance, profitability, and participant satisfaction. The Sports & Recreation Dashboard in Power BI makes it effortless to visualize, measure, and optimize every aspect of your operations. ⚽📊
This ready-to-use Power BI dashboard empowers sports organizations, recreation departments, and event managers to transform raw data into actionable insights. Track everything from event completion rates and satisfaction scores to profit margins and monthly trends — all within a single, interactive Power BI workspace.
🎯 Key Features of the Sports & Recreation Dashboard in Power BI
🏆 Comprehensive Overview Page:
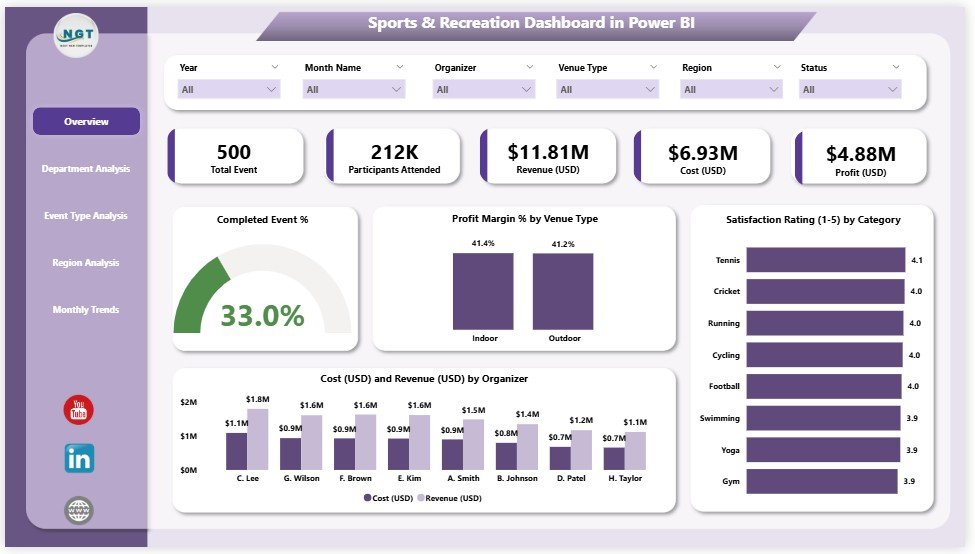
Get a snapshot of your overall performance with 5 KPI cards — including Completed Events %, Profit Margin %, Total Revenue, Total Cost, and Average Satisfaction Rating. Interactive charts let you compare financial and satisfaction metrics by venue, organizer, and category.
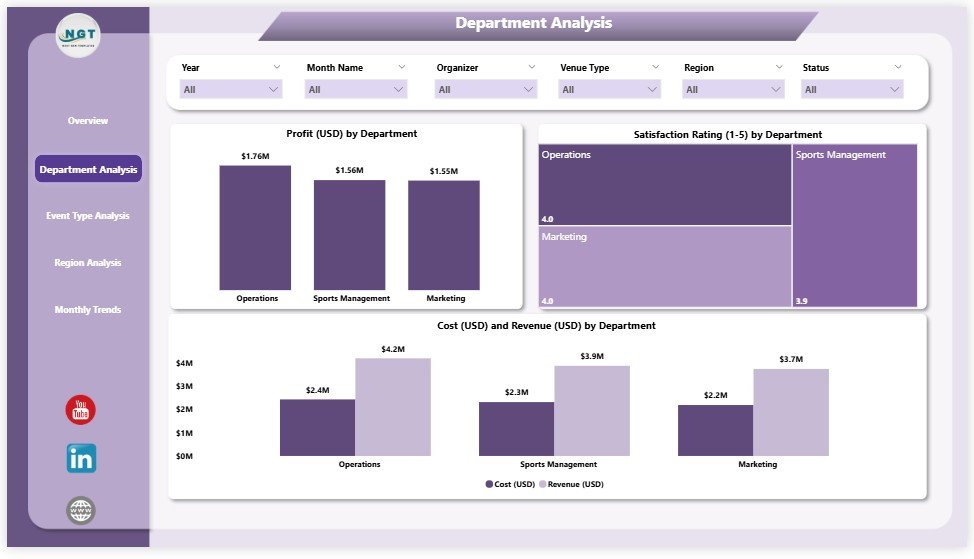
🏢 Department Analysis Page:
Evaluate each department’s contribution through Profit, Cost, Revenue, and Satisfaction visualizations. Identify top-performing teams and detect areas for improvement at a glance.
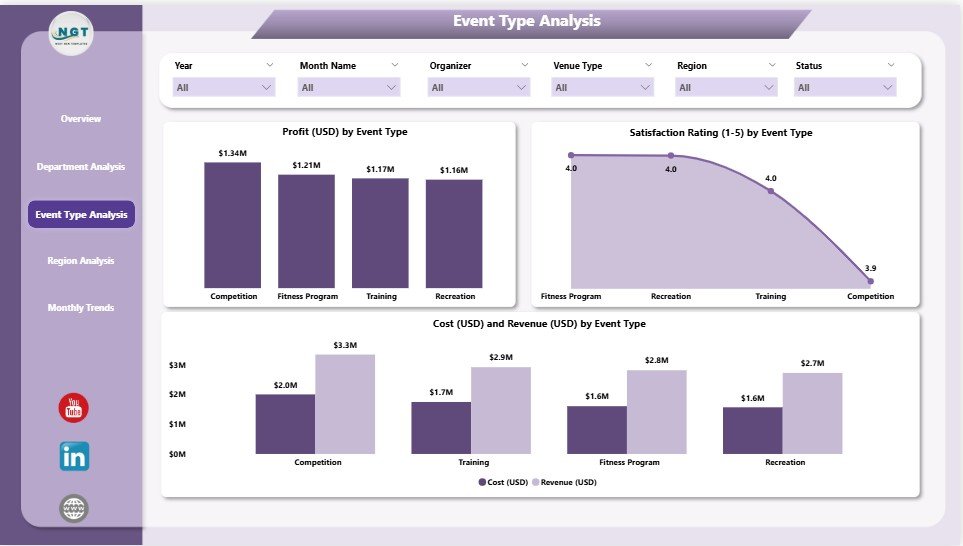
🎟️ Event Type Analysis Page:
Drill down by event type — such as tournaments, workshops, and community sessions — to discover which activities bring the highest profit and satisfaction.
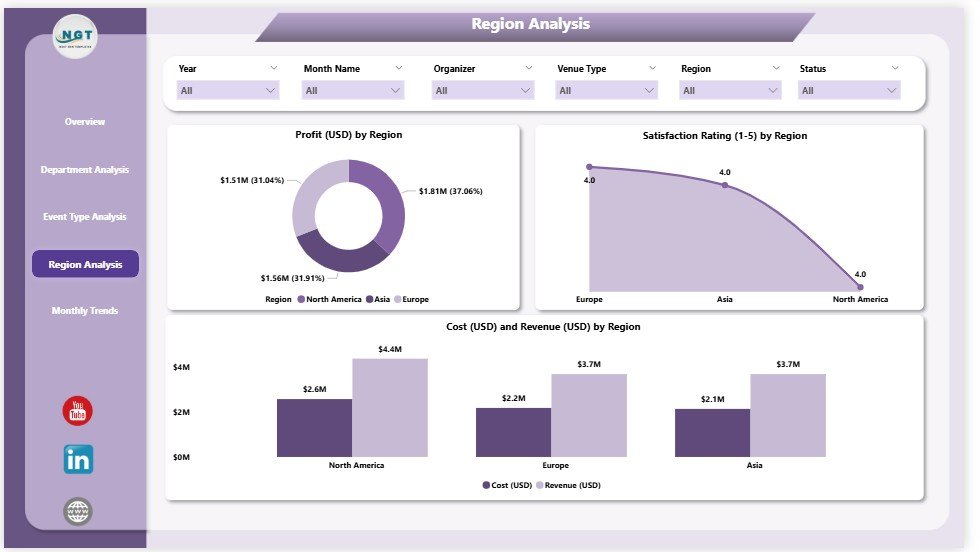
📍 Region Analysis Page:
Compare profitability and satisfaction across regions. Quickly identify where performance thrives and where strategies need adjustment.
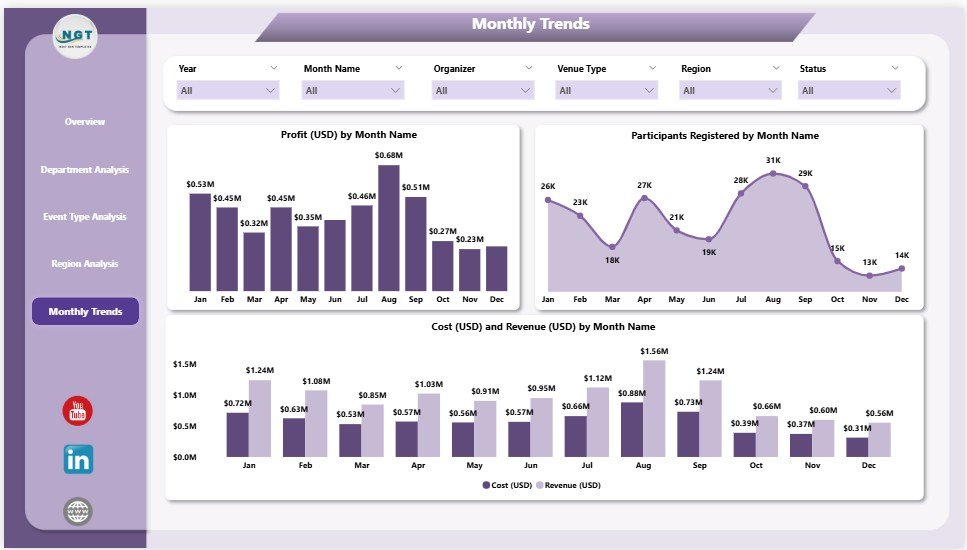
📅 Monthly Trends Page:
Track participation, cost, and revenue trends over time. Detect seasonality and plan events around periods of peak engagement.
💡 Dynamic Slicers & Filters:
Customize your analysis by Month, KPI Group, Event Type, or Region. Power BI interactivity ensures instant, flexible insights.
📦 What’s Inside the Sports & Recreation Dashboard
When you download this Power BI file, you’ll get:
✅ Five Analytical Pages: Overview, Department, Event Type, Region, and Monthly Trends.
✅ Linked Excel Data Source: Easily import your event, cost, and satisfaction data.
✅ Pre-Built Visuals: KPI cards, bar and line charts, profit heatmaps, and more.
✅ User-Friendly Navigation: A left-side panel to move smoothly between pages.
✅ Dynamic Interactivity: Drill-down and cross-filter across categories.
✅ Fully Editable Template: Customize KPIs, visuals, and color themes to match your brand.
This structure ensures that all stakeholders — from managers to sponsors — get the right insights, fast.
⚙️ How to Use the Sports & Recreation Dashboard in Power BI
🪄 Step 1: Collect your event, financial, and participant data in Excel.
🪄 Step 2: Open Power BI → Get Data → Import your Excel file.
🪄 Step 3: Load the Sports & Recreation Dashboard Template.
🪄 Step 4: Explore KPIs, apply slicers, and view real-time visuals.
🪄 Step 5: Customize charts or publish reports to Power BI Service for team access.
No coding or complex setup needed — just plug in your data and start exploring! ⚡
👥 Who Can Benefit from This Dashboard
⚽ Sports Managers: Track event success, revenue, and satisfaction.
🏢 Recreation Departments: Evaluate performance across multiple programs.
💰 Finance Teams: Monitor cost-to-profit ratios per department or region.
🎯 Event Planners: Identify profitable event types and plan smarter.
🏛️ Government & NGOs: Analyze participation and community impact metrics.
Whether you manage community events or large-scale tournaments, this dashboard gives you the clarity to act fast and lead efficiently.
🌟 Why Choose This Power BI Dashboard
✔️ Centralized data — one dashboard for all operations.
✔️ Real-time analytics with dynamic filters.
✔️ Professional visuals ready for board presentations.
✔️ Easy Excel integration — no technical skills required.
✔️ Fully customizable KPIs and layouts.
✔️ Promotes transparency, accountability, and continuous improvement.
With the Sports & Recreation Dashboard in Power BI, you gain total control over your organization’s analytics — combining insight, interactivity, and impact in one sleek tool. 🏆📈
### Click here to read the Detailed blog post
Visit our YouTube channel to learn step-by-step video tutorials


Reviews
There are no reviews yet.