🏆 Sports League KPI Dashboard in Power BI
In the world of sports leagues, every second counts—both on and off the field. Whether you’re managing a professional sports franchise, an amateur competition, or a multi-team tournament, tracking performance metrics in real time can mean the difference between strategic success and missed opportunities.
The Sports League KPI Dashboard in Power BI is a ready-to-use, fully interactive solution designed to track, analyze, and visualize Key Performance Indicators (KPIs) with precision and clarity. It blends Excel’s flexibility for data entry with Power BI’s advanced visualization capabilities, giving sports managers, coaches, and stakeholders a central place to measure progress, compare performance, and make data-driven decisions.
✨ Key Features of the Sports League KPI Dashboard
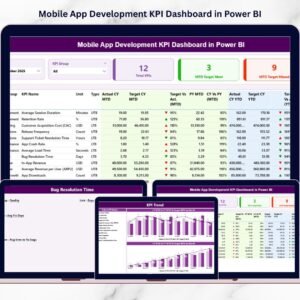
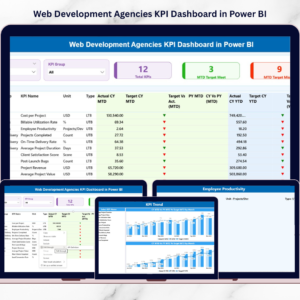
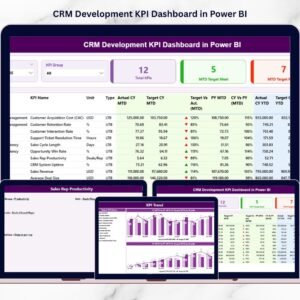
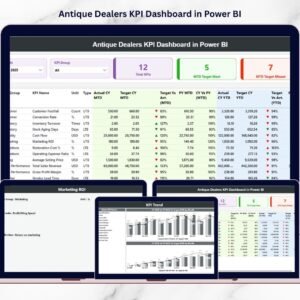
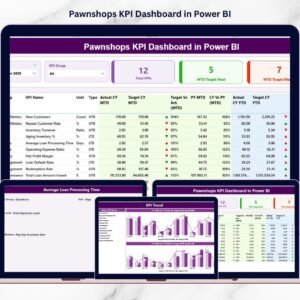
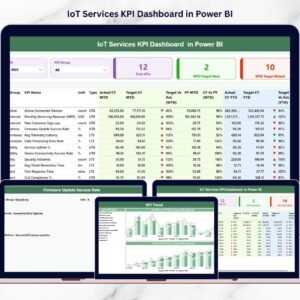
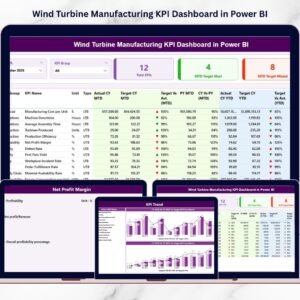
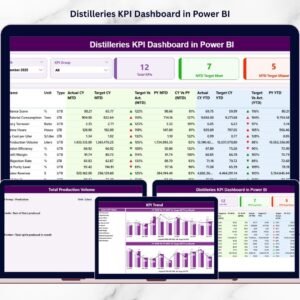
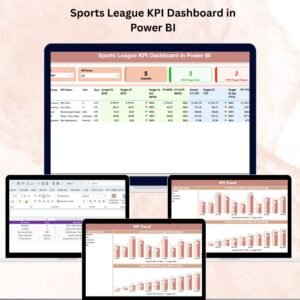
✅ Three Powerful Dashboard Pages – Summary, KPI Trend, and KPI Definition.
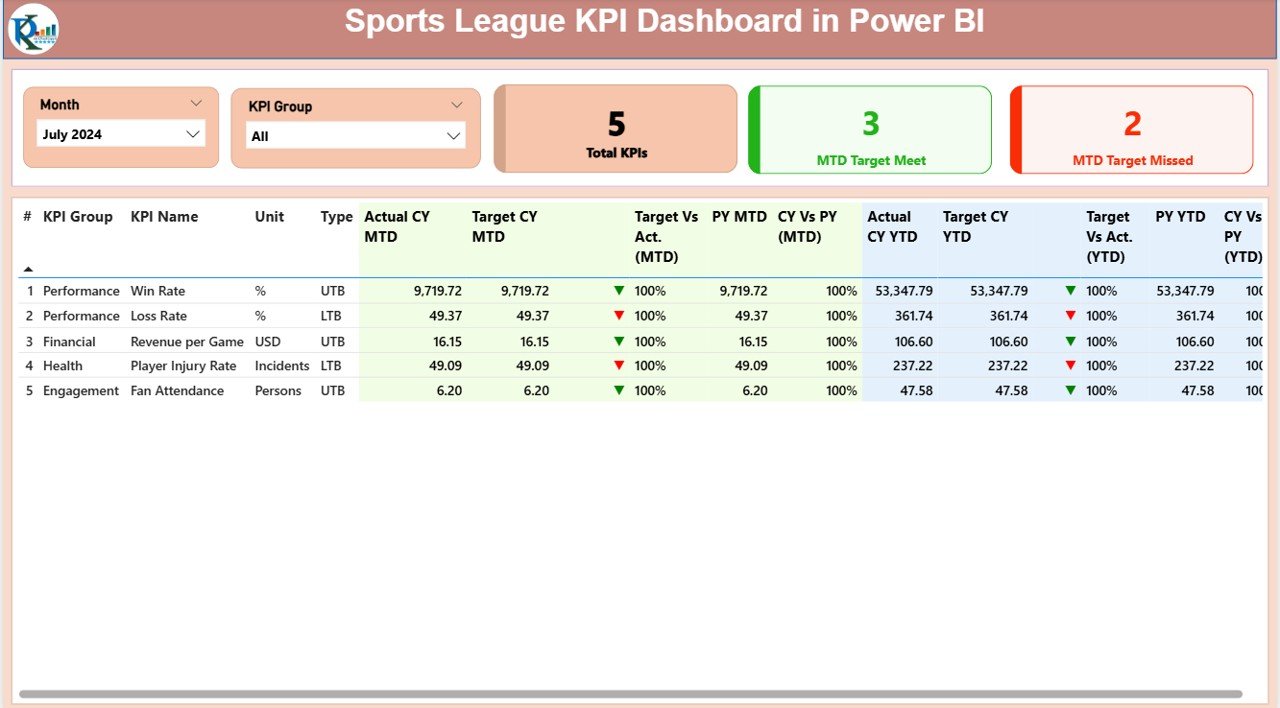
✅ Dynamic Filters – Slicers for Month and KPI Group allow instant data filtering.
✅ Performance Cards – Quickly view KPIs tracked, targets met, and targets missed.
✅ Detailed KPI Tables – Includes actual, target, and previous year comparisons for MTD (Month-to-Date) and YTD (Year-to-Date).
✅ Visual Indicators – Green ▲ for on-target KPIs and Red ▼ for underperforming KPIs.
✅ Trend Charts – Spot performance patterns and forecast results.
✅ Drill-Through KPI Definitions – Understand exactly how each KPI is calculated.
✅ Excel Data Integration – Easy updates through structured Actual, Target, and KPI Definition sheets.
📂 What’s Inside the Sports League KPI Dashboard
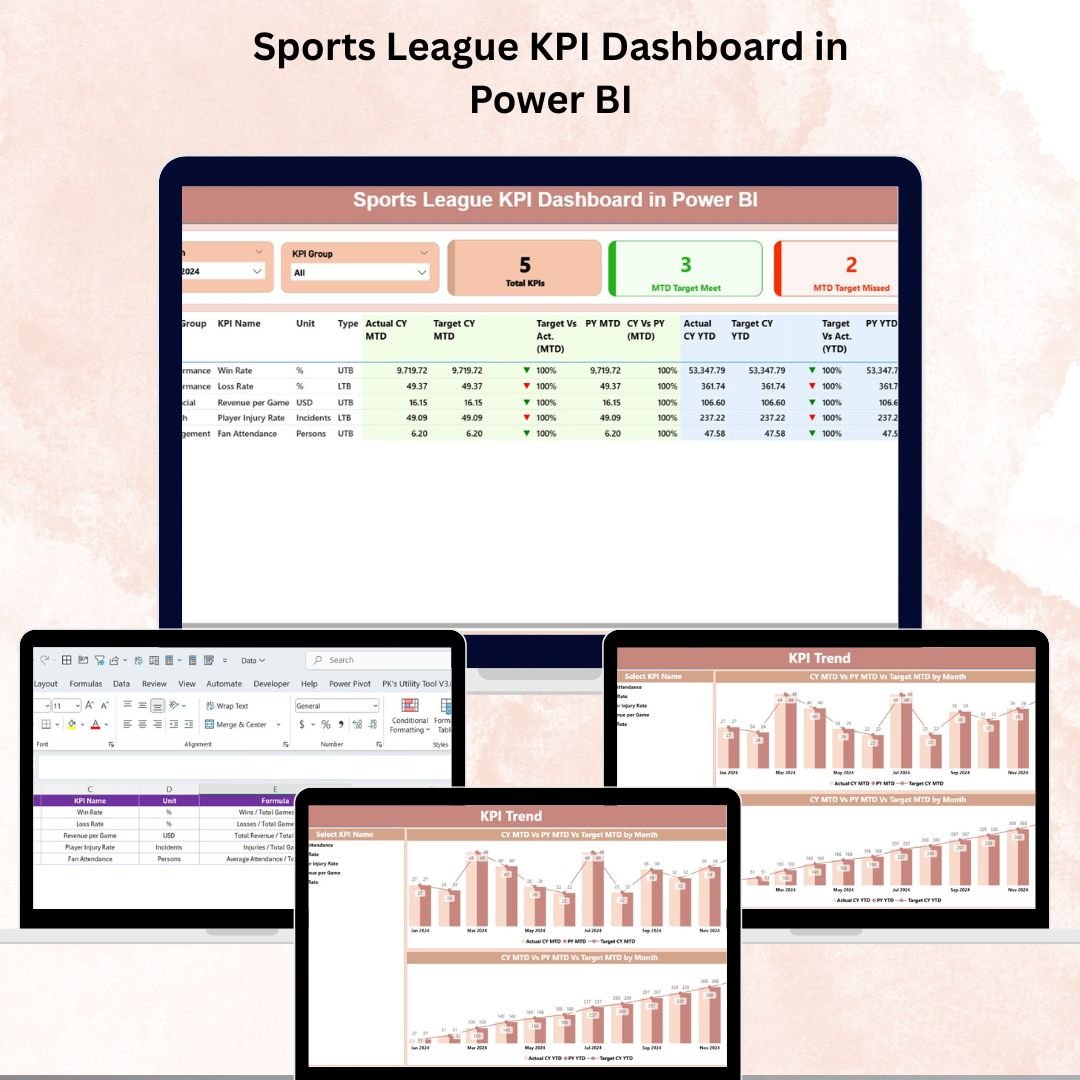
This Power BI dashboard includes three main pages:
-
Summary Page – The control center with slicers, KPI cards, and detailed KPI tables.
-
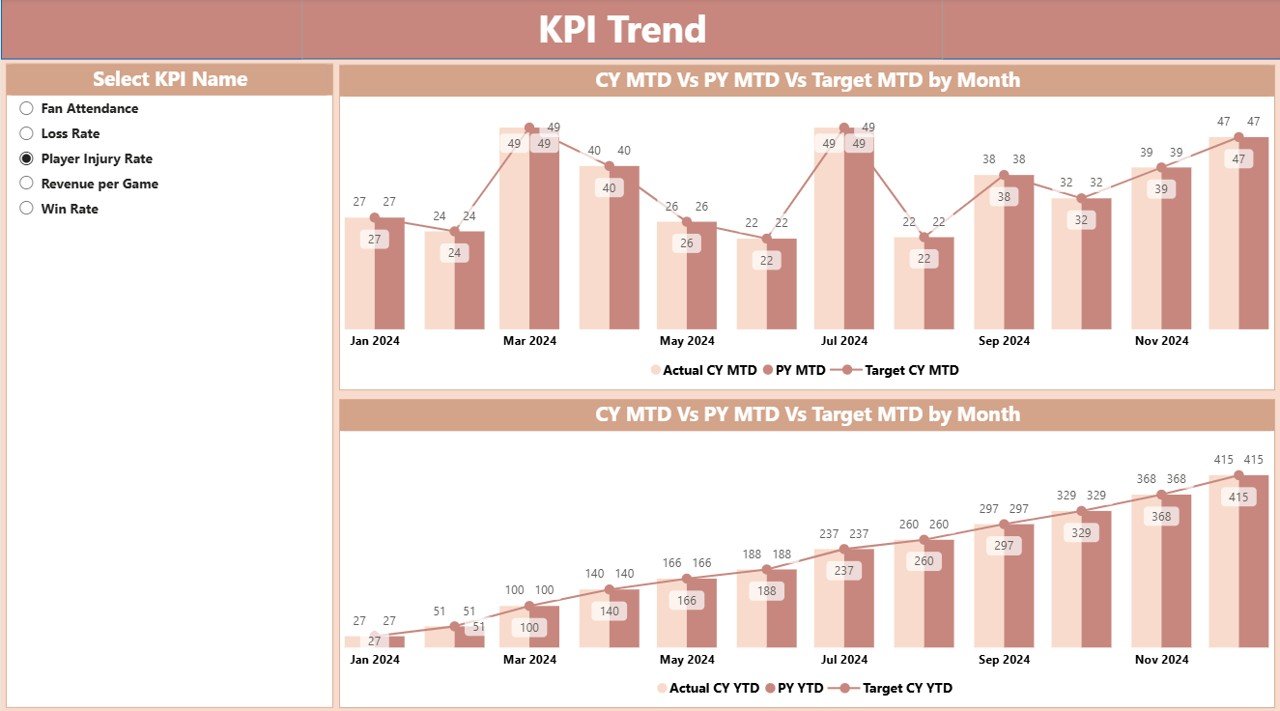
KPI Trend Page – Combo charts for Actual vs Target vs Previous Year performance trends.
-
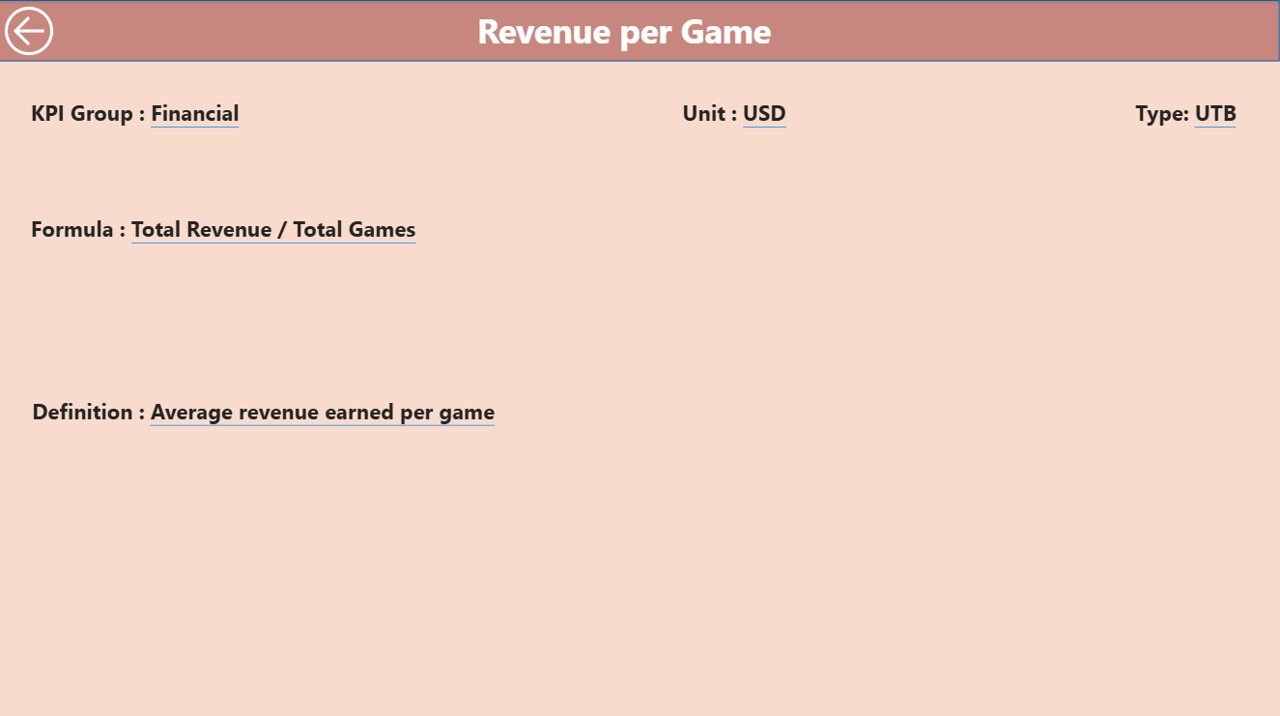
KPI Definition Page – A drill-through view showing KPI formulas and definitions for clarity.
Excel Data Source Includes:
-
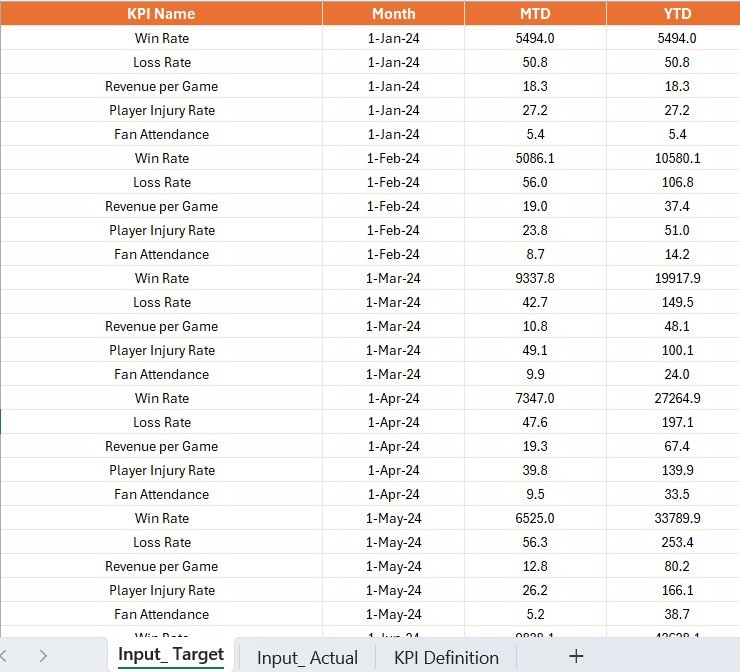
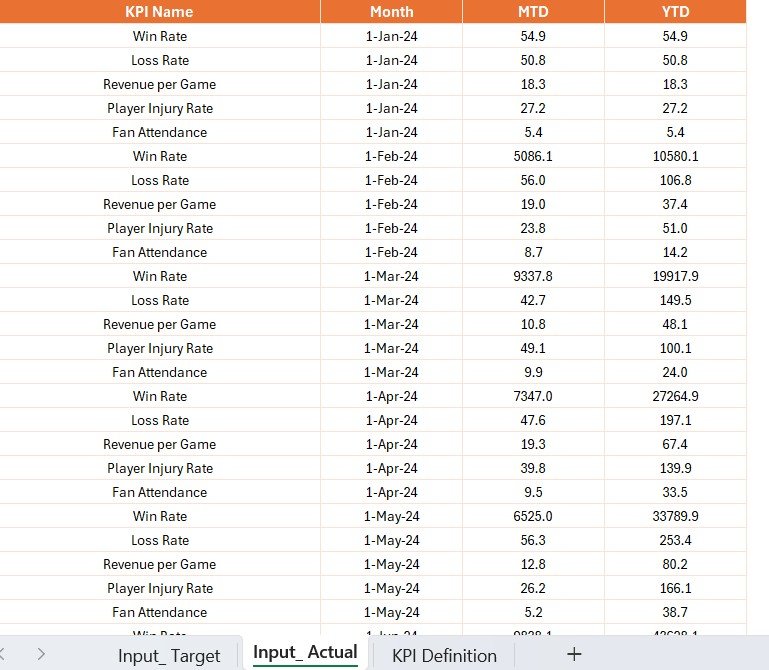
Input_Actual Sheet – Enter monthly MTD and YTD actual values.
-
Input_Target Sheet – Define MTD and YTD target values for each KPI.
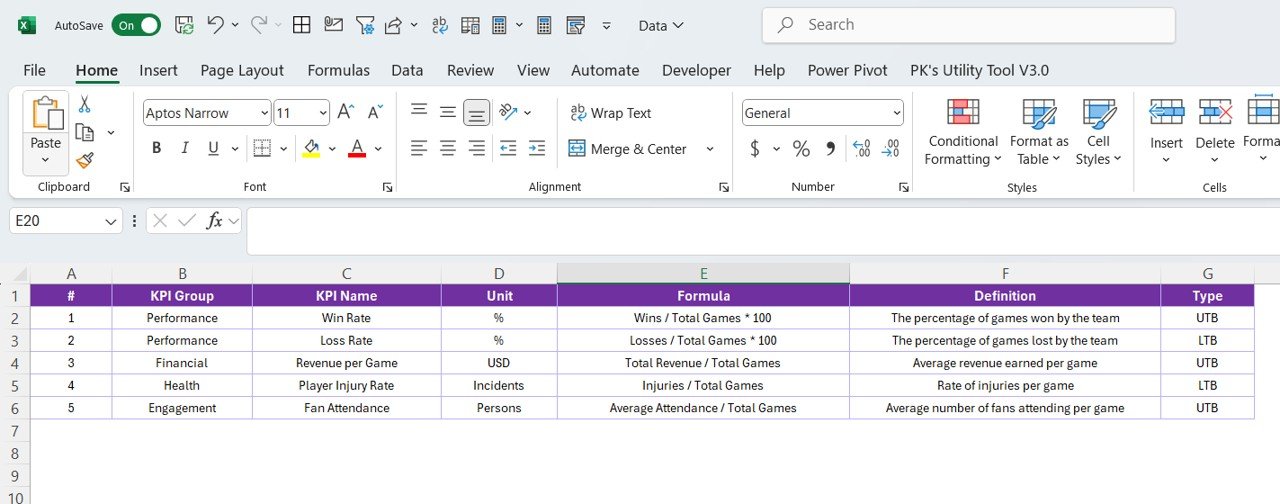
-
KPI Definition Sheet – List KPI number, group, unit, formula, definition, and type (UTB/LTB).
🛠 How to Use the Sports League KPI Dashboard
-
Update Excel Data – Enter actual and target values in their respective sheets.
-
Refresh Power BI – Load the updated Excel data into Power BI Desktop.
-
Use Slicers – Filter by Month and KPI Group to focus on specific periods and metrics.
-
Drill Down – Right-click a KPI in the Summary Page to view its detailed definition.
-
Analyze Trends – Use the KPI Trend Page to track long-term patterns.
-
Share Insights – Publish to Power BI Service for online collaboration.
🎯 Who Can Benefit from This Dashboard
🏟 League Managers – Oversee multiple teams’ performance at a glance.
⚽ Coaches – Monitor player stats and training KPIs.
📊 Analysts – Identify trends, gaps, and opportunities for improvement.
📈 Sponsors & Stakeholders – Access clear and professional reports.
🏆 Tournament Organizers – Manage both performance and operational KPIs.
🚀 Why Choose This Dashboard?
-
Real-Time Updates – Excel changes are instantly reflected in Power BI.
-
Clear Comparisons – View actual vs target vs previous year side-by-side.
-
Better Decision-Making – Spot underperforming KPIs and address them quickly.
-
Standardized Metrics – Ensure all stakeholders are aligned on KPI definitions.
-
Flexible Use – Adaptable for different sports, leagues, and competitions.
📖 Click here to read the Detailed blog post
Visit our YouTube channel to learn step-by-step video tutorials


Reviews
There are no reviews yet.