
In today’s data-driven sports world, managing performance is no longer just about what happens on the field. From player stats and fan engagement to sponsorship ROI and revenue tracking, every decision counts. That’s why we created the Sports League KPI Dashboard in Google Sheets — a ready-to-use, dynamic, and professional dashboard that brings all your sports performance data into one interactive platform.
Built for league managers, analysts, coaches, and sports administrators, this tool helps you track, measure, and visualize key performance indicators (KPIs) effortlessly. No coding, no complex setup — just plug in your data and start gaining insights immediately.
⚡ Key Features of Sports League KPI Dashboard in Google Sheets
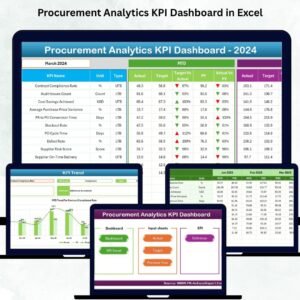
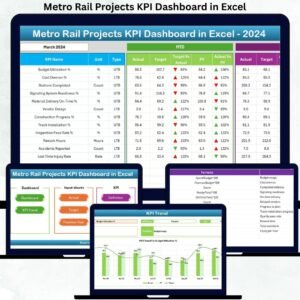
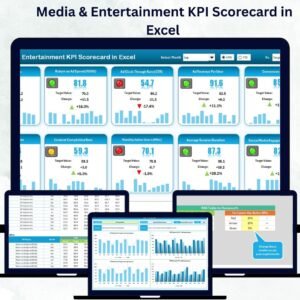
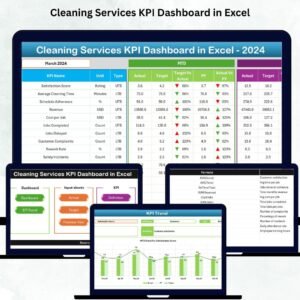
✨ All-in-One Dashboard: Get a complete snapshot of league performance, including player stats, ticket sales, and revenue figures — all in one view.
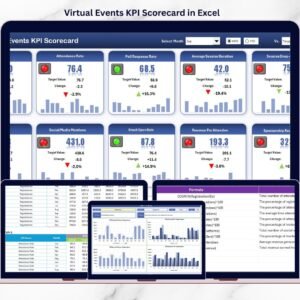
📊 Real-Time Performance Tracking: With MTD (Month-to-Date) and YTD (Year-to-Date) comparisons, you can instantly see how your teams and operations are performing.
🔄 Dynamic Month Selector: Change the month using a simple dropdown, and watch the entire dashboard update automatically with conditional formatting and performance arrows.
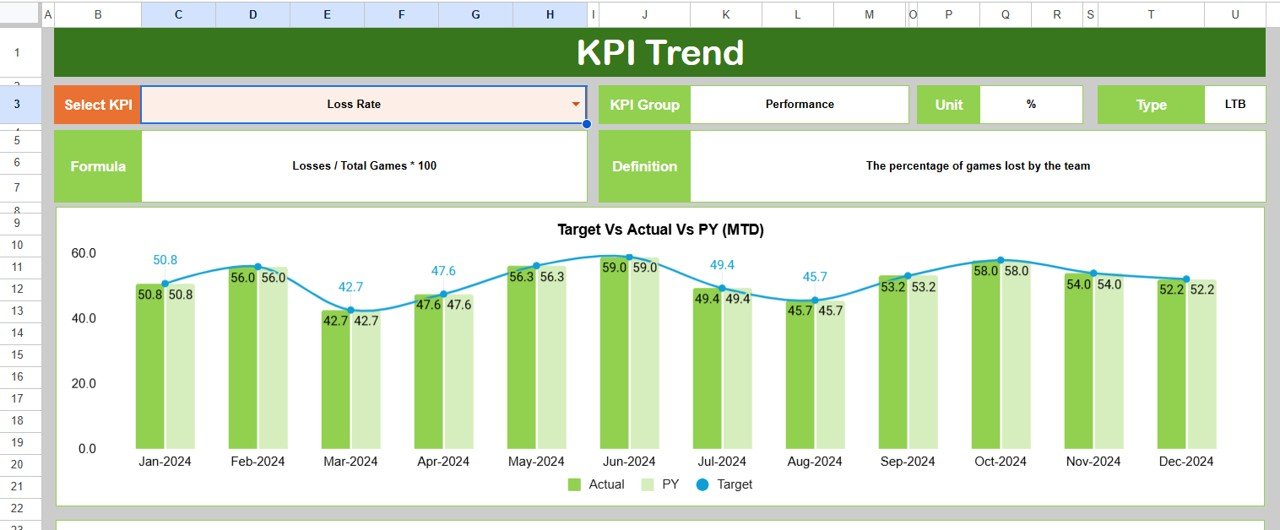
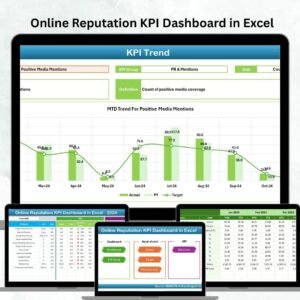
📈 KPI Trend Analysis: Track KPI progress over time with clear visuals and trends for Actual vs Target vs Previous Year.
📂 Fully Editable and Customizable: Modify KPI names, formulas, and visuals to suit your sport, league size, or reporting requirements.
🌍 Cloud-Based & Collaborative: Since it’s in Google Sheets, multiple users can collaborate in real-time from anywhere in the world.
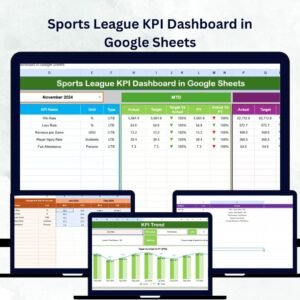
📦 What’s Inside the Sports League KPI Dashboard in Google Sheets
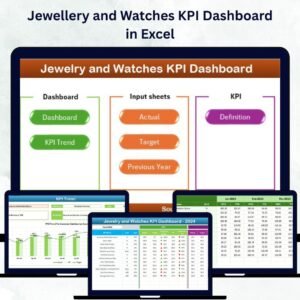
This comprehensive dashboard template includes six powerful worksheet tabs, each designed to simplify sports performance management:
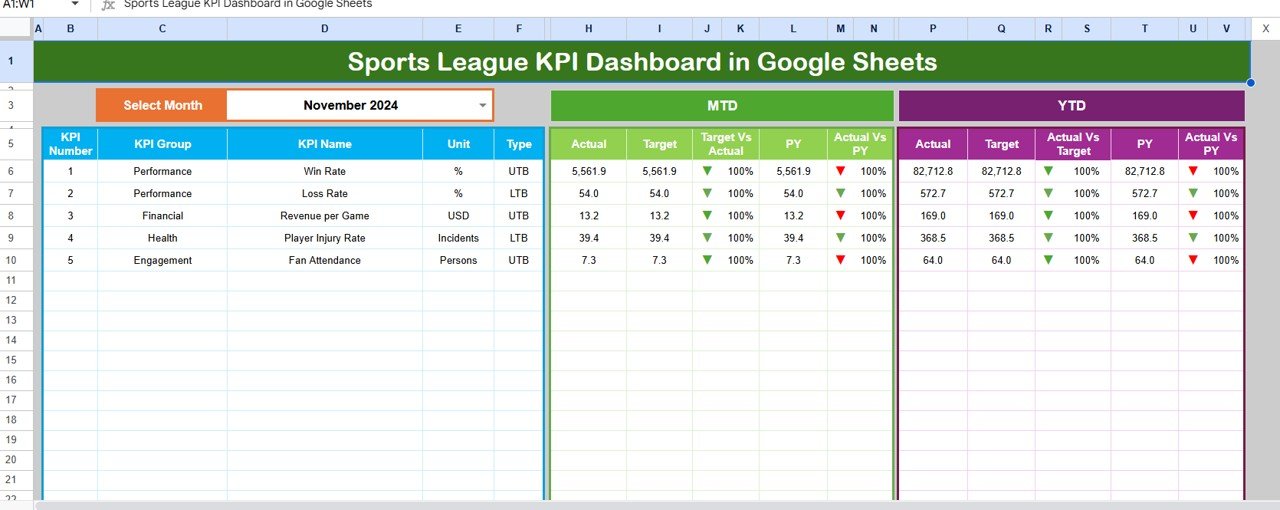
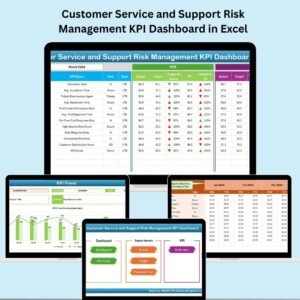
1️⃣ Dashboard Sheet: The main hub showing MTD and YTD data, Actual vs Target, and PY vs Actual with automatic up/down arrows.
2️⃣ Trend Sheet: View in-depth KPI trends, select specific KPIs, and analyze progress over time.
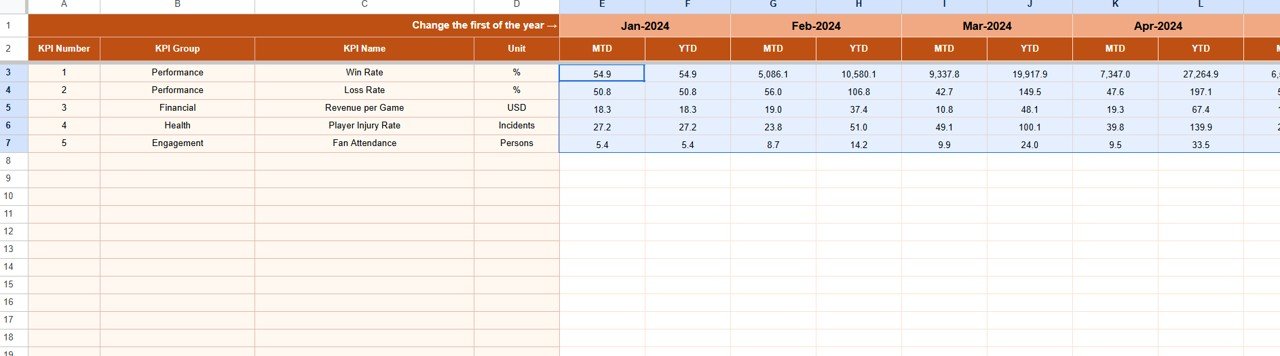
3️⃣ Actual Numbers Input Sheet: Enter real-time performance data monthly for accurate insights.
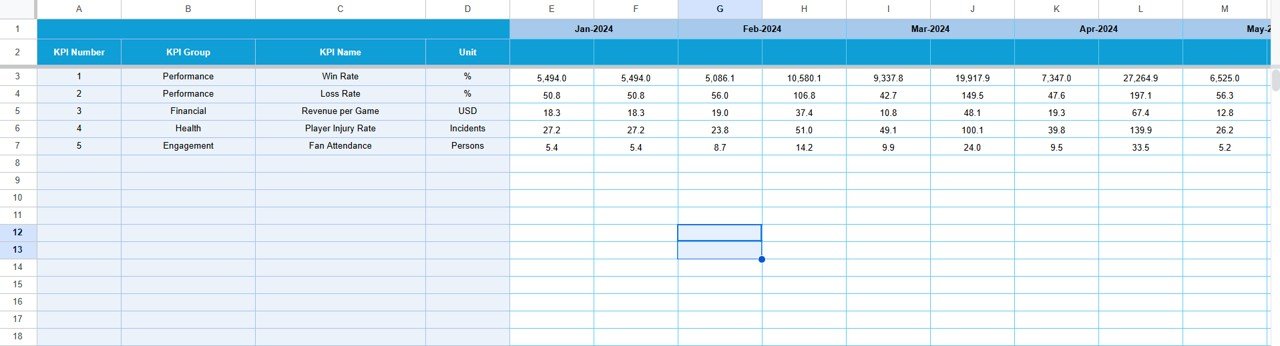
4️⃣ Target Sheet: Define performance benchmarks and measure progress against them.
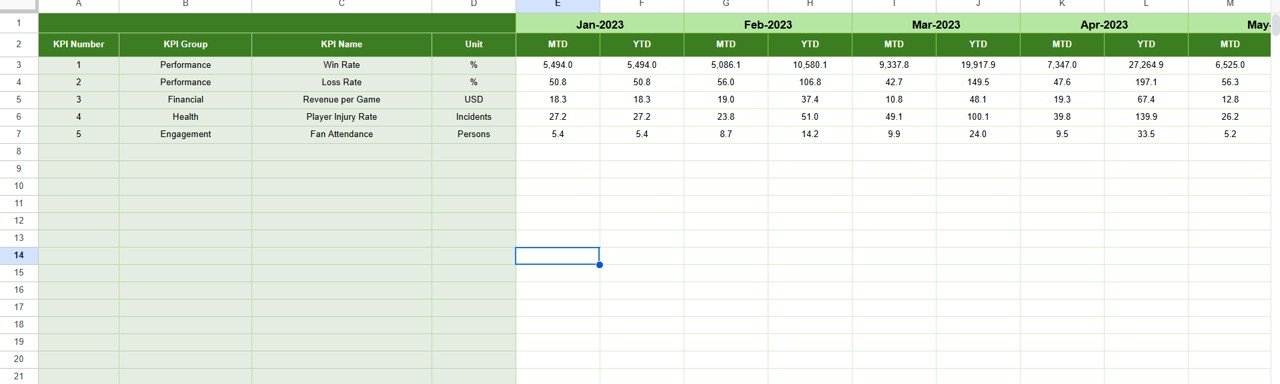
5️⃣ Previous Year Sheet: Compare current performance with last season’s results to identify growth areas.
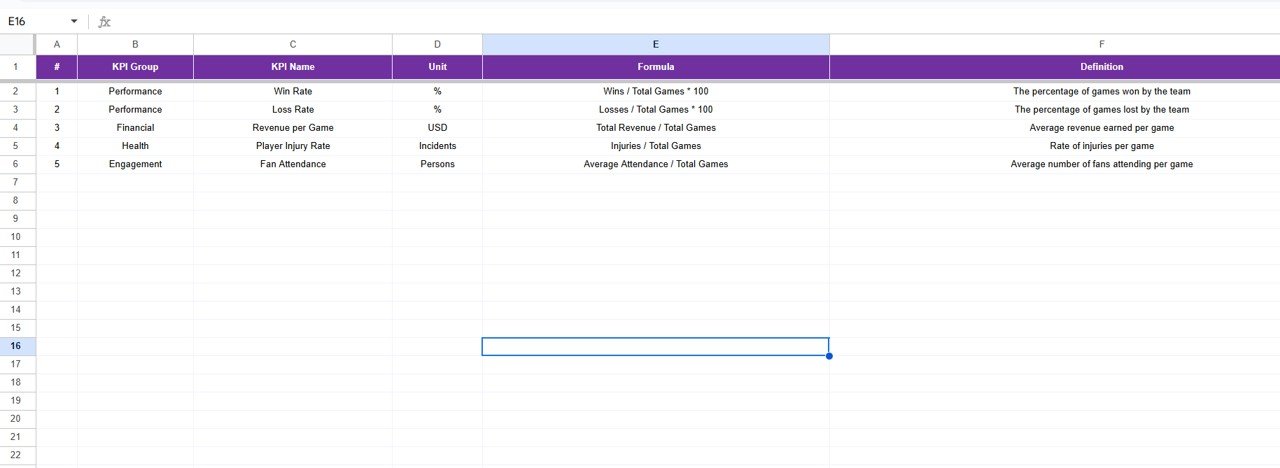
6️⃣ KPI Definition Sheet: Maintain KPI clarity and consistency with definitions, units, and formulas in one place.
This organized structure ensures clarity, transparency, and actionable insights across your sports organization.
⚙️ How to Use the Sports League KPI Dashboard in Google Sheets
🧩 Step 1: Define your KPIs – wins, player ratings, fan engagement, or sponsorship revenue.
🧮 Step 2: Enter actual, target, and previous year data in respective sheets.
🗓️ Step 3: Use the month selector (cell D3) to switch between months dynamically.
📊 Step 4: Review MTD and YTD charts and trend lines for each KPI.
🔍 Step 5: Share your findings with management, coaches, or sponsors using Google’s collaboration features.
That’s it — your entire sports performance management system is ready in just a few clicks!
👥 Who Can Benefit from This Sports League KPI Dashboard
⚽ League Administrators: Track team results, sponsorship value, and overall league performance.
🏀 Team Coaches: Analyze player efficiency, performance trends, and training outcomes.
🎟️ Marketing Managers: Measure ticket sales, fan engagement, and merchandise performance.
💰 Finance Teams: Compare budgeted vs actual results and assess cost efficiency.
📺 Media & Communication Teams: Present visually engaging data during reports and broadcasts.
Whether you’re managing a local club, national league, or eSports platform, this dashboard adapts to your needs and scales effortlessly.


Reviews
There are no reviews yet.