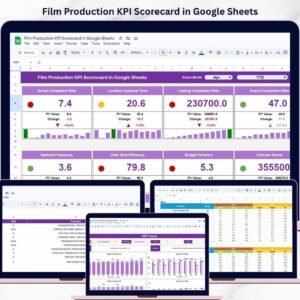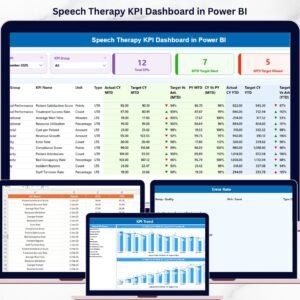

Introducing the Speech Therapy KPI Dashboard in Power BI — a powerful and interactive tool designed to help healthcare professionals track performance, analyze trends, and improve patient outcomes—all in one place.
In today’s healthcare environment, speech therapy centers must deliver high-quality care while managing multiple data points. However, without a structured system, tracking KPIs becomes complex and time-consuming.
That’s where this smart dashboard makes a difference! 🚀
It converts complex therapy data into clear, visual insights. Moreover, it enables real-time KPI tracking, helping you make faster, data-driven decisions and improve overall efficiency.
✨ Key Features of Speech Therapy KPI Dashboard in Power BI
📊 Real-Time KPI Monitoring
Track key performance indicators with MTD and YTD insights in one centralized dashboard.
🎯 Target vs Actual Comparison
Evaluate performance easily by comparing actual results against targets.
📈 Trend Analysis (MTD & YTD)
Analyze performance trends over time with dynamic visual charts.
🔁 Year-over-Year Comparison
Compare current year performance with previous year to measure improvement.
🧠 KPI Definitions & Formulas Included
Understand each KPI with detailed definitions and calculation logic.
📊 Interactive Filters & Slicers
Filter data by month and KPI group for deeper analysis.
⚡ Dynamic Visual Dashboard
Clean, professional layout with charts, tables, and KPI indicators.
📉 Performance Indicators
Visual arrows and color indicators help you identify trends quickly.
📂 What’s Inside the Speech Therapy KPI Dashboard in Power BI
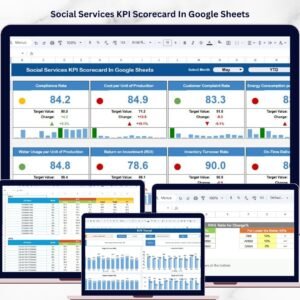
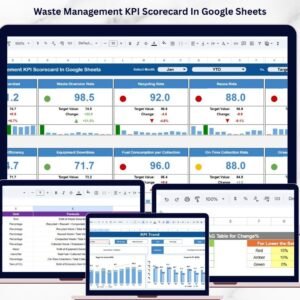
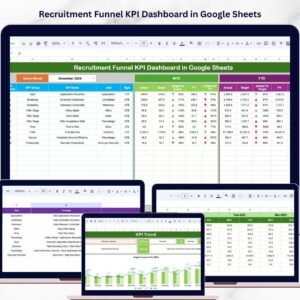
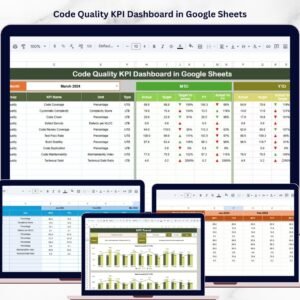
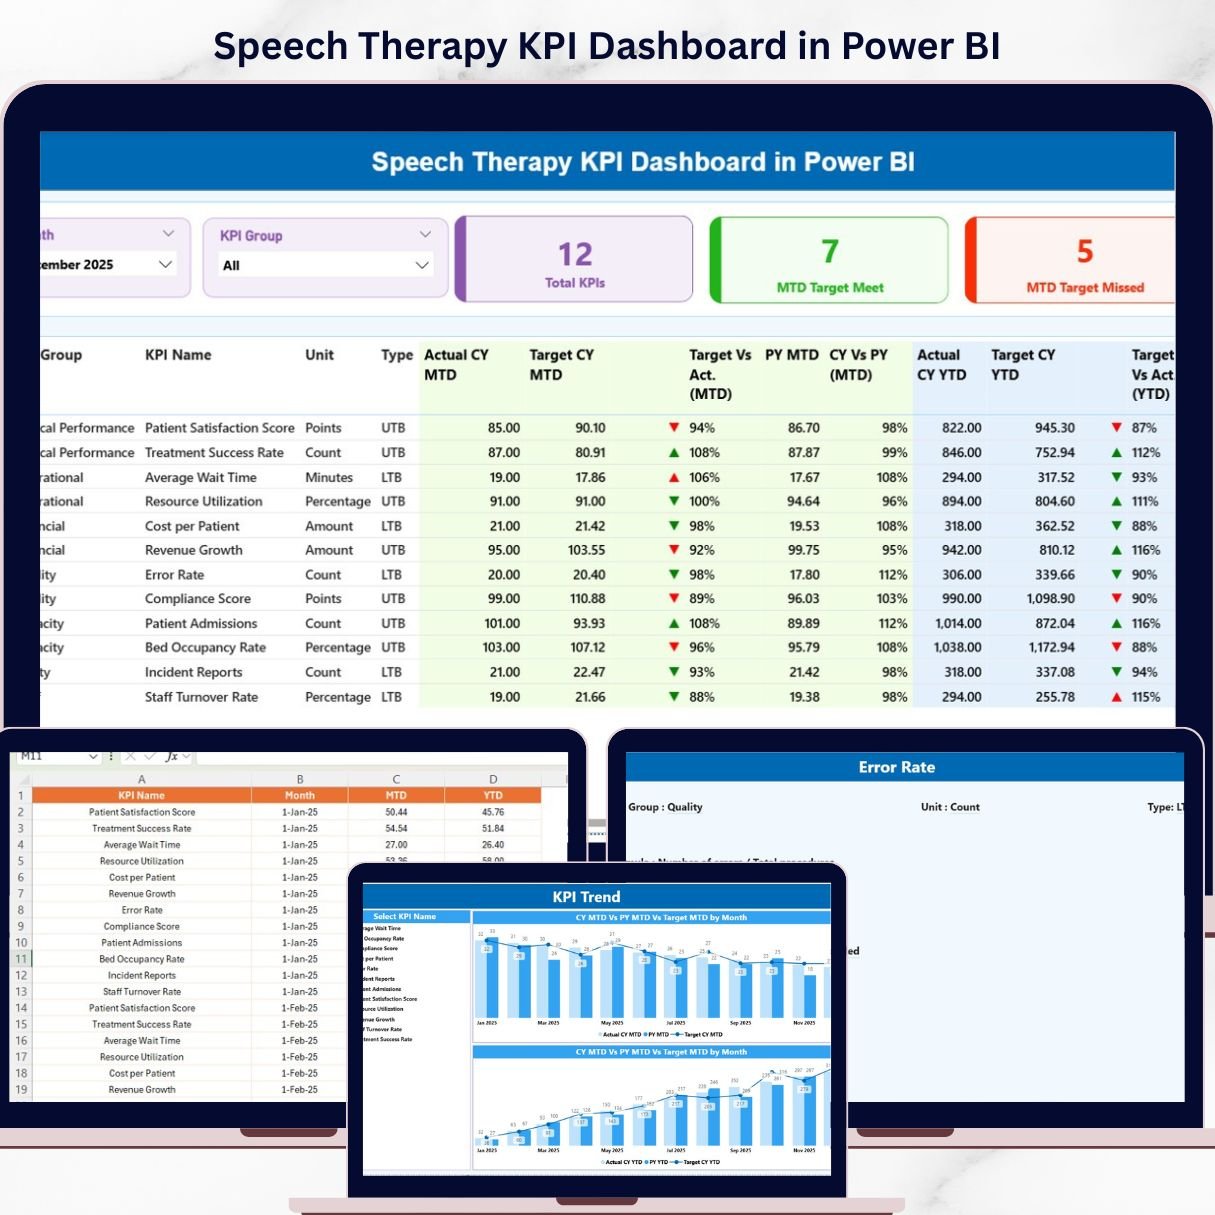
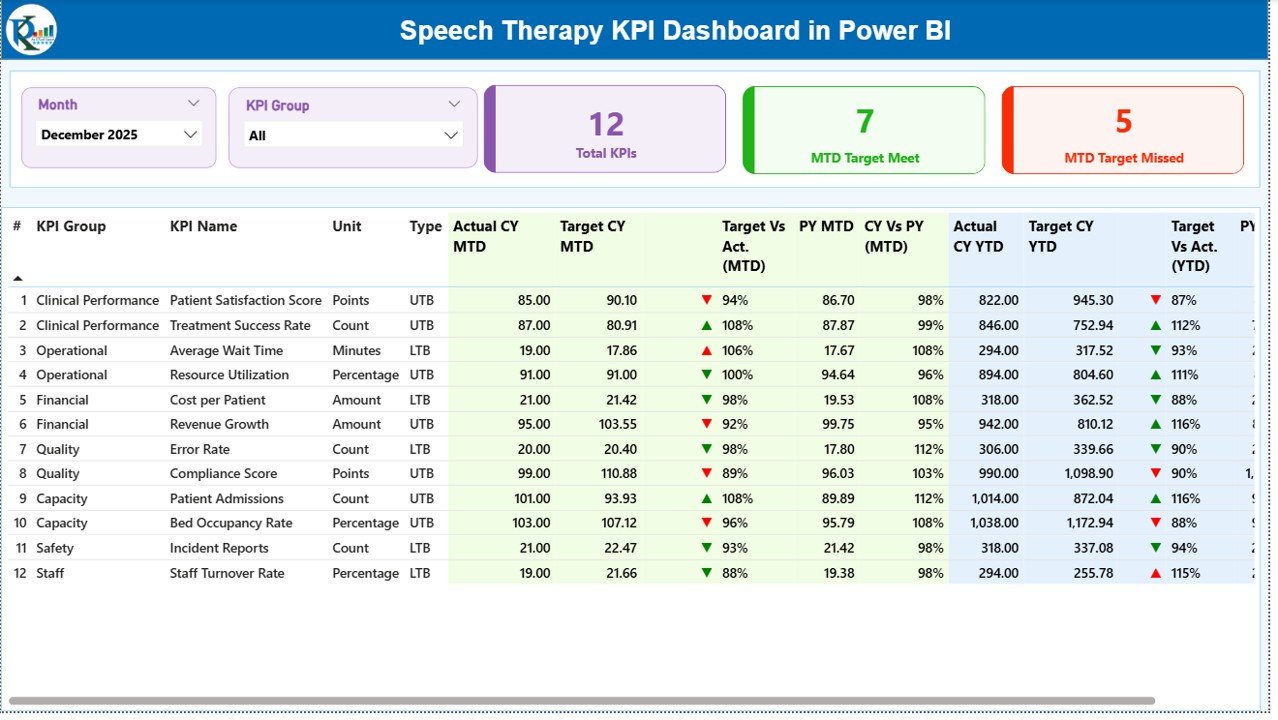
📌 Summary Page
Main dashboard displaying KPI cards, slicers, and a detailed KPI performance table.
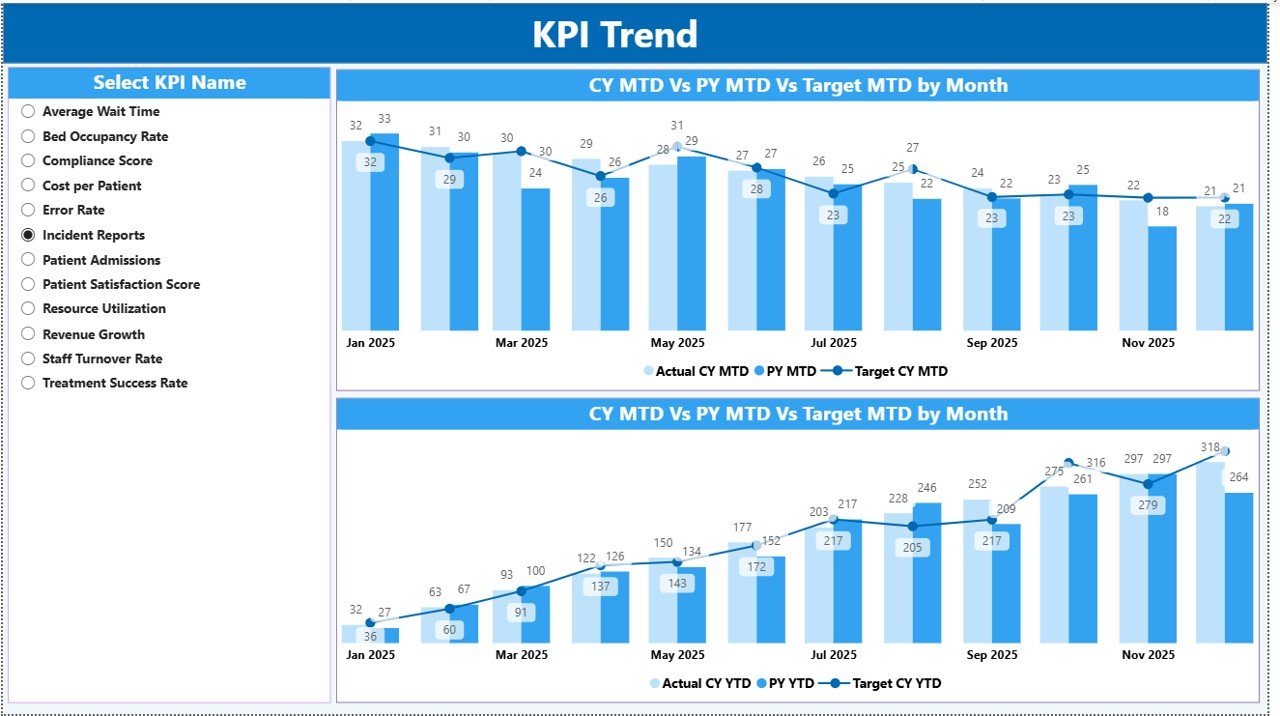
📌 KPI Trend Page
Visual analysis using combo charts for MTD and YTD performance trends.
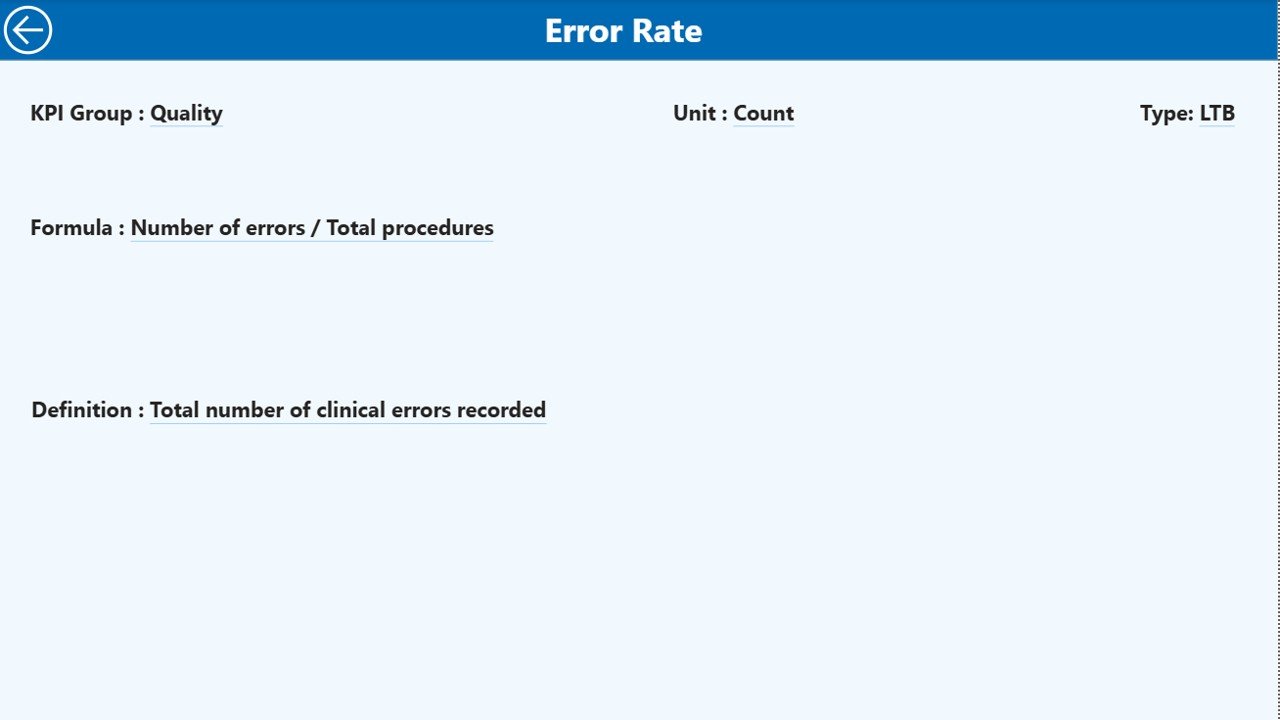
📌 KPI Definition Page
Drill-through page providing KPI formulas, definitions, and performance types.
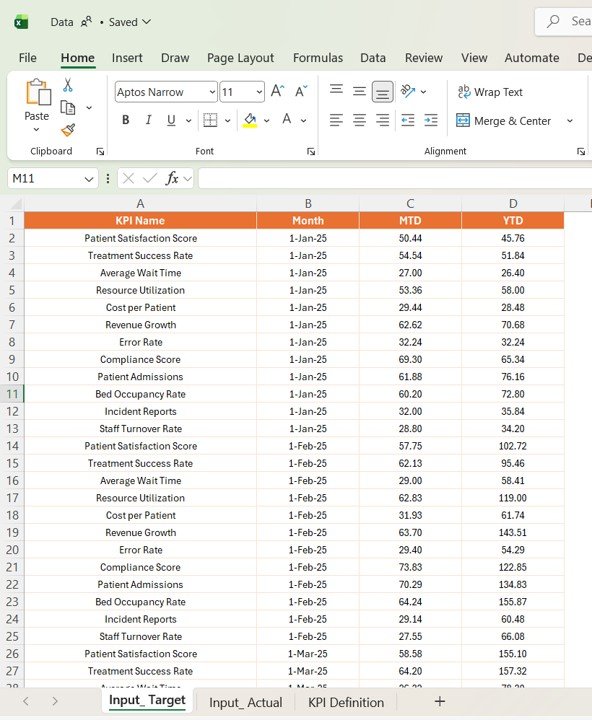
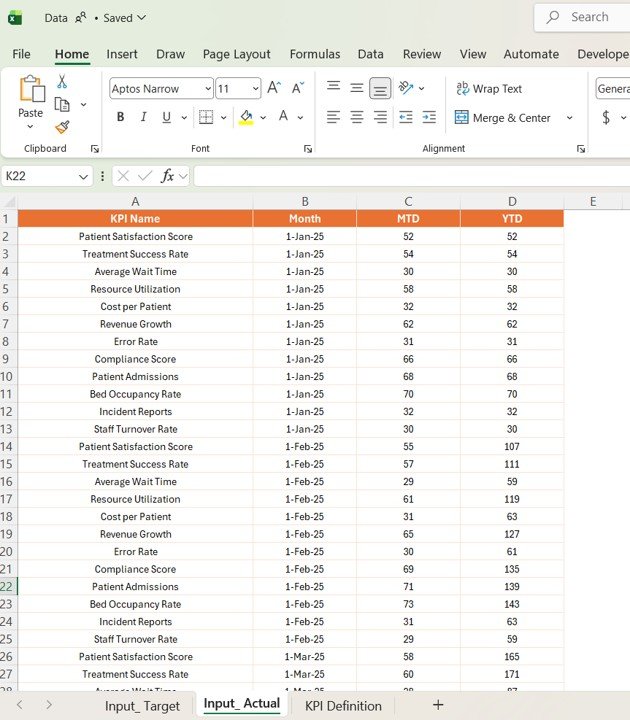
📌 Excel Data Source Included
Structured Excel file with Actual Data, Target Data, and KPI Definitions.
🛠️ How to Use the Speech Therapy KPI Dashboard in Power BI
Using this dashboard is simple and efficient! 💡
1️⃣ Update Excel Data Source
Enter actual, target, and KPI definition data.
2️⃣ Refresh Power BI Dashboard
Load updated data into Power BI.
3️⃣ Apply Filters & Slicers
Select month or KPI group for focused analysis.
4️⃣ Analyze KPIs
Review KPI cards, tables, and charts.
5️⃣ Identify Gaps
Spot underperforming KPIs instantly.
6️⃣ Improve Outcomes
Use insights to enhance therapy performance and patient care.
👥 Who Can Benefit from This Speech Therapy KPI Dashboard in Power BI
🧠 Speech Therapists – Track patient progress and therapy effectiveness
🏥 Healthcare Clinics – Monitor performance and improve service quality
📊 Healthcare Analysts – Generate insights quickly
👩⚕️ Medical Professionals – Enhance decision-making
🏢 Healthcare Managers – Optimize operations and efficiency
💡 Why This Dashboard is a Must-Have?
✔ Monitor therapy KPIs in real time
✔ Improve patient outcomes
✔ Standardize KPI tracking
✔ Reduce manual reporting
✔ Make faster, data-driven decisions
👉 If you want to improve therapy performance and deliver better patient care, this dashboard is your ultimate solution!