In today’s competitive specialty chemicals industry, organizations must continuously monitor production efficiency, quality standards, safety compliance, and financial performance. However, many companies still rely on disconnected spreadsheets and manual reporting processes, which slow down analysis and limit decision-making speed.
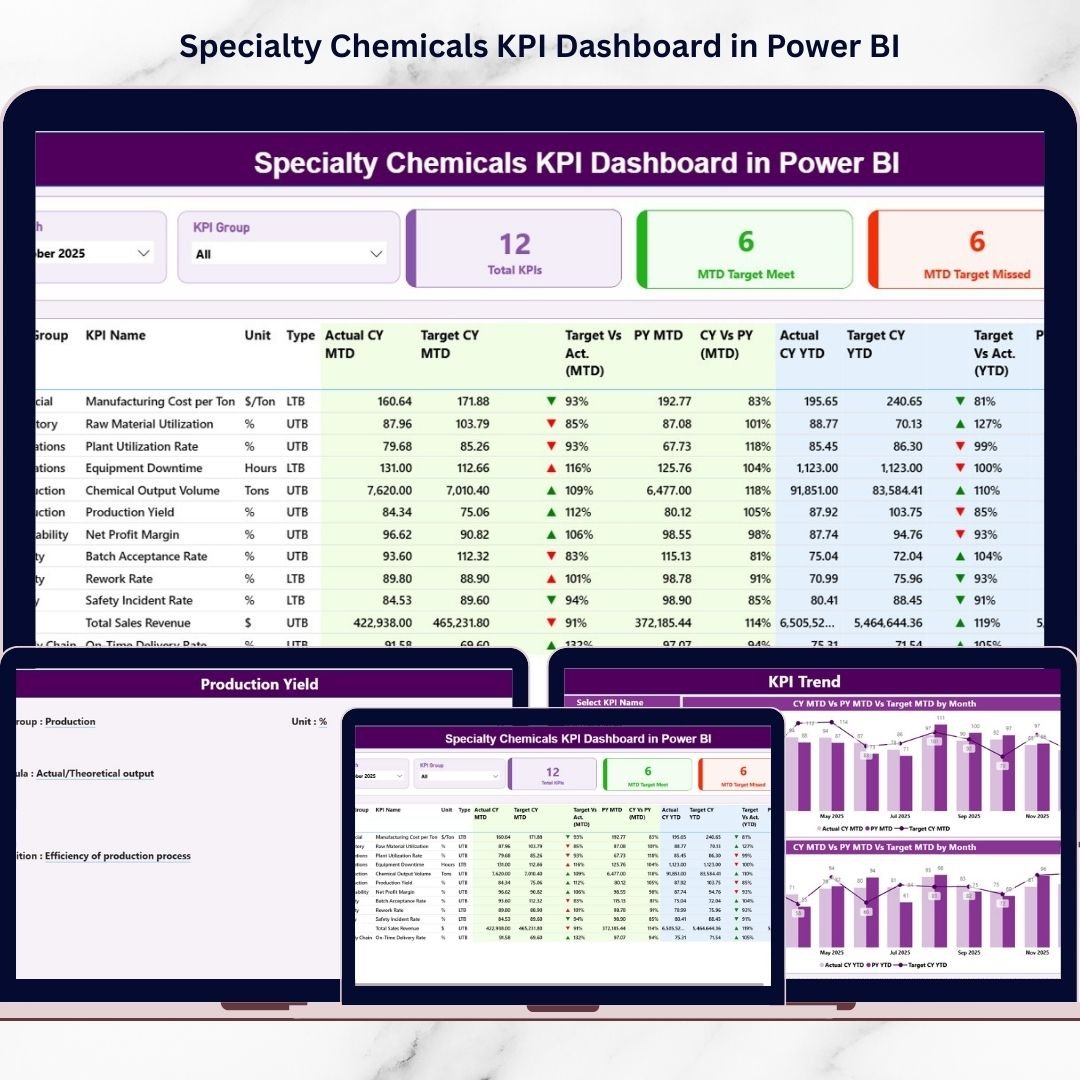
The Specialty Chemicals KPI Dashboard in Power BI provides a modern, intelligent solution to this challenge. This ready-to-use analytics dashboard transforms complex operational data into clear, interactive visual insights, enabling managers and leadership teams to monitor performance from one centralized platform.
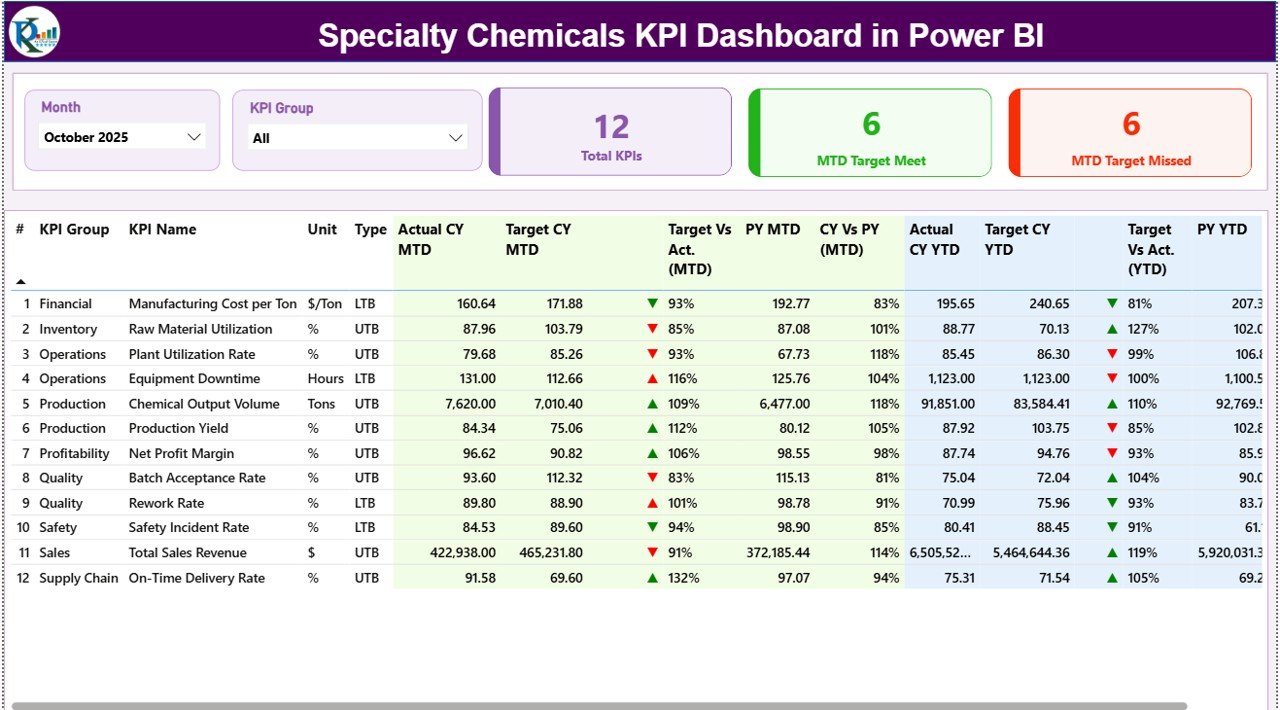
Instead of reviewing multiple Excel reports separately, users can analyze all key performance indicators (KPIs) through dynamic visuals, automated calculations, and interactive filters. Because Power BI updates visuals instantly after data refresh, organizations gain real-time visibility into performance trends and operational health.
Designed specifically for specialty chemical manufacturers, this dashboard integrates Excel data with powerful Power BI analytics. As a result, companies maintain simple data entry processes while benefiting from enterprise-level reporting and visualization capabilities.
Whether monitoring production yield, safety compliance, batch success rates, or operational efficiency, this dashboard helps teams identify performance gaps quickly and take corrective actions faster.
🚀 Key Feature of Specialty Chemicals KPI Dashboard in Power BI
📊 Centralized KPI Monitoring
Track operational, quality, safety, and financial KPIs in a single interactive dashboard.
🎛️ Dynamic Slicers & Filters
Analyze performance instantly by Month or KPI Group using interactive slicers.
📈 MTD & YTD Performance Tracking
Monitor both short-term and long-term performance simultaneously.
🎯 Target vs Actual Comparison
Visual indicators instantly highlight KPI achievements and gaps.
🔺 Performance Status Icons
Green and red indicators quickly show success or underperformance.
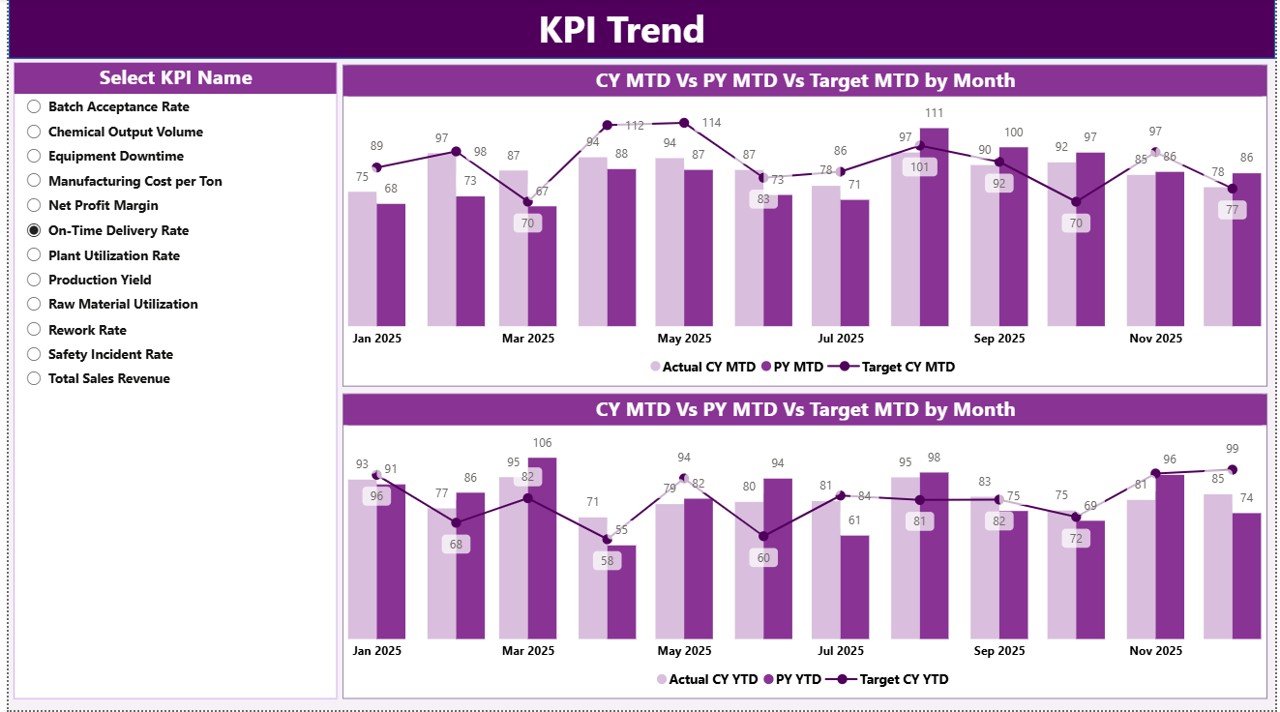
📉 Advanced Trend Analysis
Analyze KPI performance trends using dynamic combo charts.
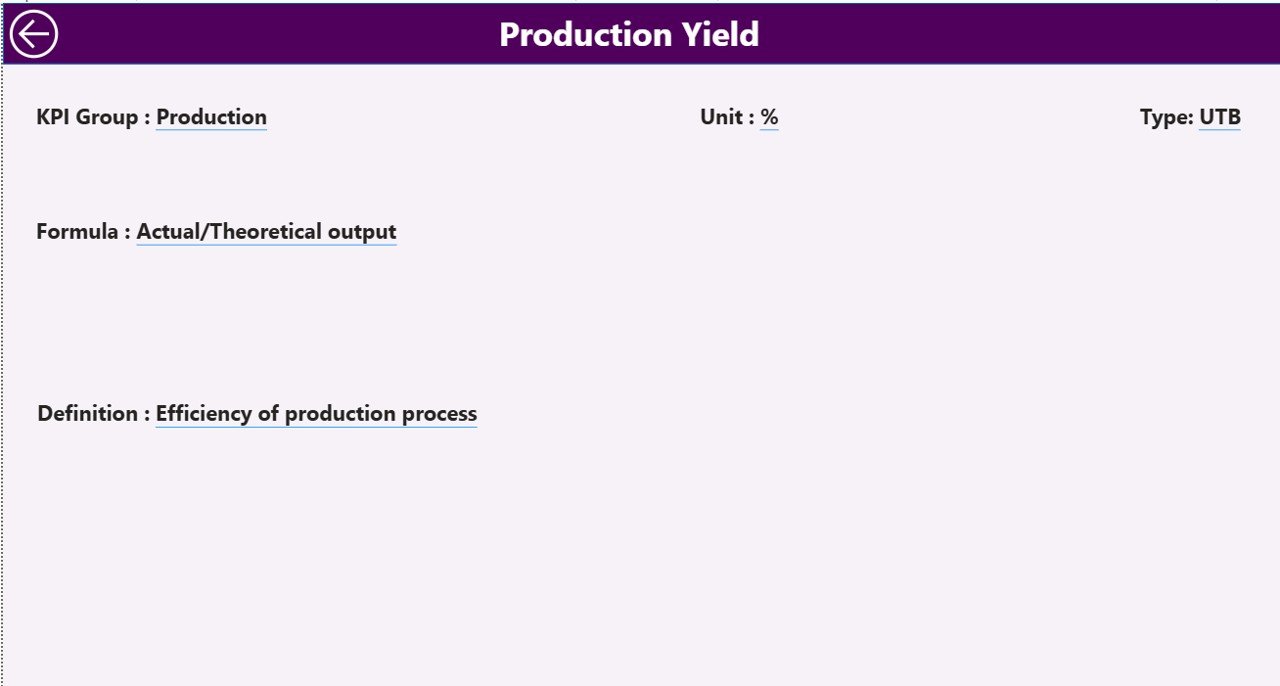
🔍 Drill-Through KPI Definitions
Access KPI formulas, definitions, and logic directly from the dashboard.
⚡ Excel + Power BI Integration
Update Excel data and refresh Power BI for automatic analytics updates.
📦 What’s Inside the Specialty Chemicals KPI Dashboard in Power BI
This professional dashboard includes a structured analytics framework with three powerful report pages:
✅ Summary Page
-
KPI performance overview
-
KPI cards showing targets met/missed
-
Detailed KPI performance table
-
MTD & YTD comparisons
✅ KPI Trend Page
-
Interactive KPI selection slicer
-
MTD trend analysis chart
-
YTD trend analysis chart
-
Target vs Actual vs Previous Year comparison
✅ KPI Definition Page
-
KPI formulas and definitions
-
KPI classification (LTB/UTB)
-
Drill-through navigation feature
Additionally, the dashboard connects to an Excel data source containing:
-
Input_Actual Sheet
-
Input_Target Sheet
-
KPI Definition Sheet
This structure ensures accurate and consistent reporting.
🛠️ How to Use the Specialty Chemicals KPI Dashboard in Power BI
Getting started is simple and requires no advanced technical expertise:
1️⃣ Define KPIs inside the KPI Definition sheet.
2️⃣ Enter actual performance data in the Input_Actual sheet.
3️⃣ Add targets in the Input_Target sheet.
4️⃣ Load or refresh data in Power BI.
5️⃣ Use slicers to filter performance instantly.
6️⃣ Analyze trends and KPI status visually.
Because calculations and visuals are automated, reporting becomes faster and more reliable.
👥 Who Can Benefit from This Specialty Chemicals KPI Dashboard in Power BI
This dashboard is ideal for professionals across specialty chemical operations:
🏭 Plant Managers
⚙️ Operations Leaders
🧪 Quality Control Teams
📊 Data Analysts
💰 Finance Managers
🛡️ Safety & Compliance Teams
📈 Executive Leadership
Organizations seeking structured KPI monitoring and data-driven decision-making will benefit the most.
By implementing this dashboard, companies reduce manual reporting, improve accountability, and enhance operational visibility. Instead of reacting to problems after they occur, teams proactively monitor performance and optimize operations continuously.
### Click here to read the Detailed blog post
Visit our YouTube channel to learn step-by-step video tutorials:
👉 https://youtube.com/@PKAnExcelExpert