
The Solar Energy KPI Dashboard in Excel is an essential tool for solar energy project managers, analysts, and energy providers looking to monitor, track, and optimize key performance indicators (KPIs) related to solar energy production and efficiency. This customizable Excel dashboard allows you to track vital metrics such as solar panel performance, energy production, operational costs, and system efficiency, helping you make informed decisions that maximize energy output and reduce operational costs.
With real-time data tracking and insightful visualizations, this dashboard helps solar energy professionals optimize their solar systems, track energy efficiency, and ensure that energy generation is consistent with expected goals. Whether you’re monitoring a single solar installation or an entire fleet of solar panels, this tool simplifies the tracking of solar performance, helping you improve sustainability and profitability in your solar energy business.
Key Features of the Solar Energy KPI Dashboard in Excel
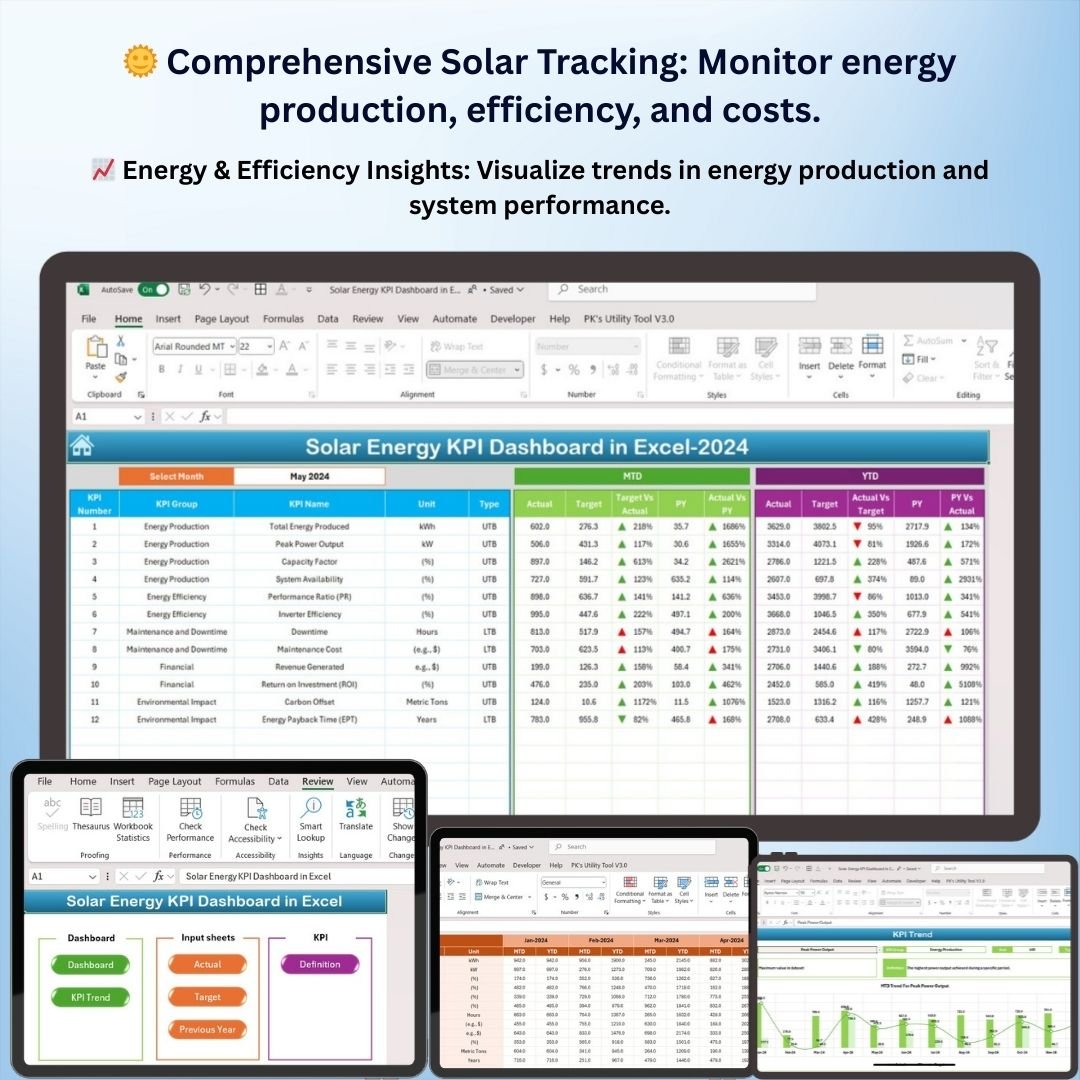
🌞 Comprehensive Solar Energy Performance Tracking
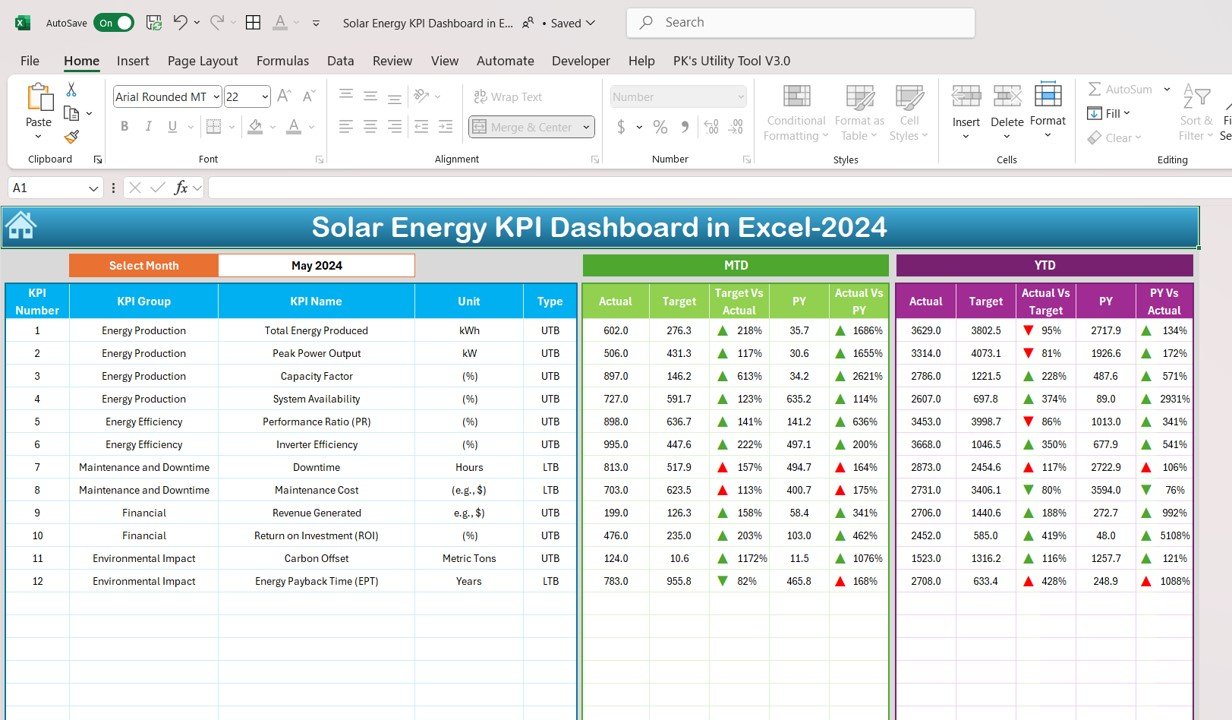
Track key KPIs such as total energy produced, system efficiency, panel performance, and operational costs. Stay on top of every aspect of your solar energy systems for optimal performance.
⚡ Real-Time Solar Energy Monitoring
Monitor the performance of your solar panels and systems in real-time. Track energy production, solar panel efficiency, and compare actual output to projected energy goals.
📈 Energy Production & Efficiency Insights
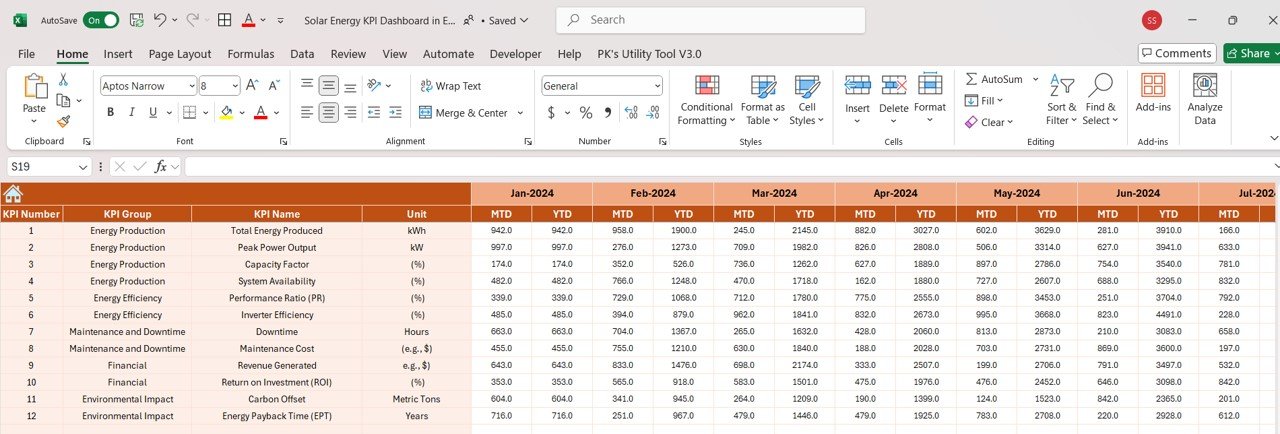
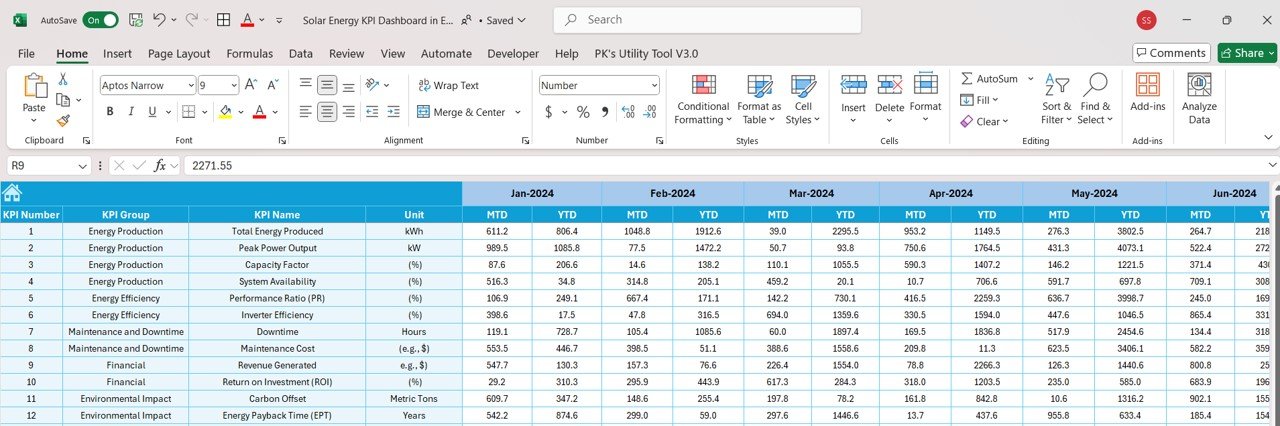
Analyze energy production trends, system uptime, and efficiency to identify areas for improvement. Use these insights to increase energy output and enhance the overall performance of your solar system.
📅 Customizable KPIs for Solar Energy Operations
Easily adjust the dashboard to track KPIs specific to your solar energy project, whether it’s panel performance, cost per kWh, or system maintenance.
🖥️ Interactive & User-Friendly Interface
The Excel-based dashboard is designed for simplicity and ease of use. Interactive features such as slicers, filters, and drill-down options allow you to explore and analyze solar energy performance data in detail.
Why You’ll Love the Solar Energy KPI Dashboard in Excel
✅ Track Key Solar Energy Metrics
Monitor performance metrics such as energy production, system efficiency, and operational costs in real-time. Get a full overview of your solar energy systems’ performance.
✅ Maximize Energy Production
Analyze system efficiency and panel performance to optimize energy production. Use the dashboard to identify trends and take corrective actions to improve output.
✅ Optimize Operational Efficiency
Track and analyze operational costs and efficiency to ensure that your solar systems are running optimally, reducing downtime and improving performance.
✅ Make Data-Driven Decisions
Leverage insights from key performance metrics to make informed decisions about system upgrades, maintenance, and energy generation, maximizing your ROI.
✅ Visualize Performance Trends
Use interactive charts and graphs to visualize energy production, panel efficiency, and operational performance over time, making it easy to spot trends and track improvements.
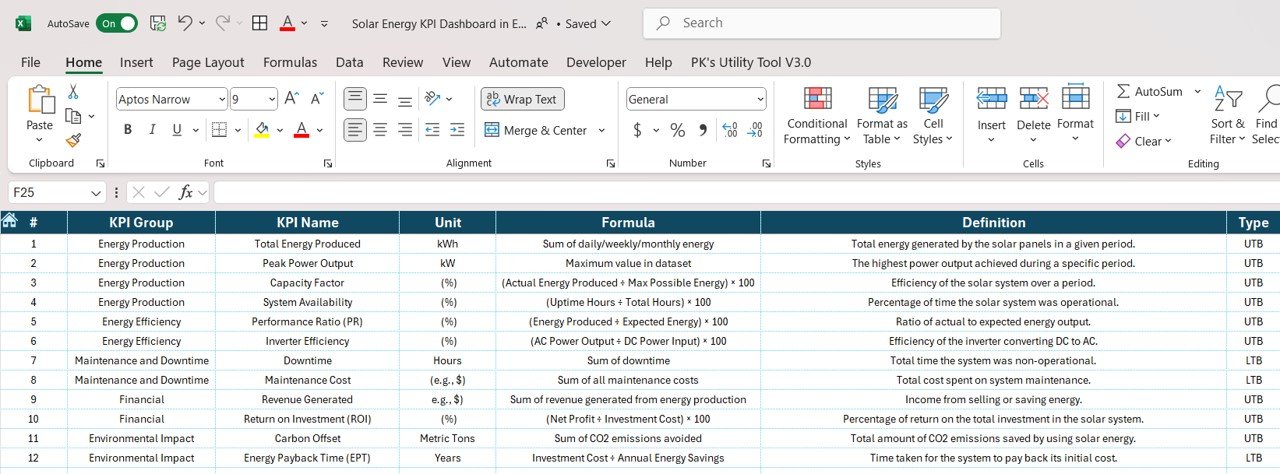
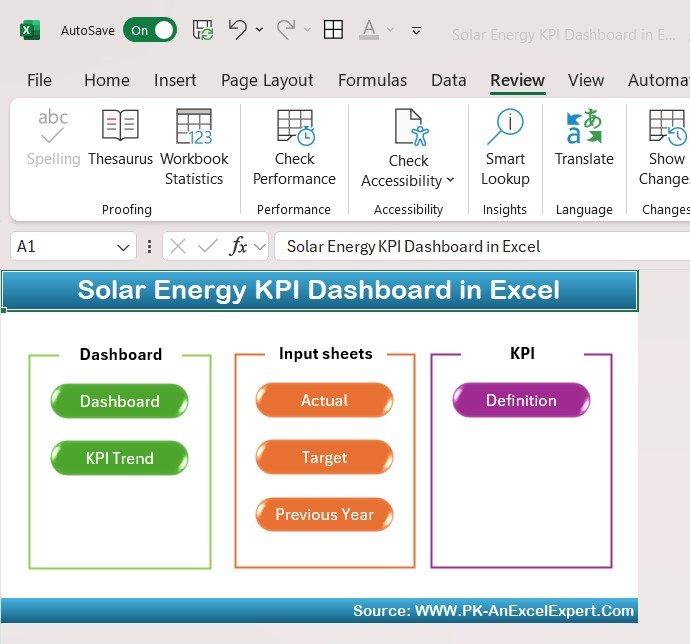
What’s Inside the Solar Energy KPI Dashboard Template?
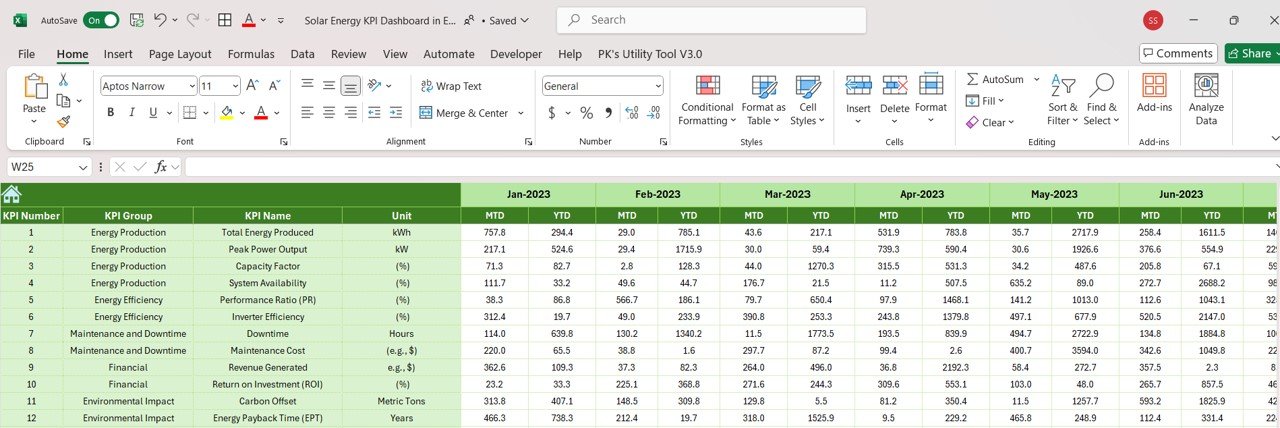
- Solar Panel Performance Tracking: Monitor panel efficiency and energy production for each solar panel or system.
- Energy Production Insights: Track total energy produced, efficiency rates, and cost per unit of energy.
- Operational Cost Analysis: Visualize system maintenance costs and operational expenses to ensure cost efficiency.
- Customizable KPIs: Adjust the dashboard to suit your specific solar energy projects, whether residential or commercial.
- Interactive Reporting: Use slicers and charts to analyze performance and gain insights into your solar system’s health.
How to Use the Solar Energy KPI Dashboard in Excel
1️⃣ Download the Template: Get access to the Solar Energy KPI Dashboard instantly.
2️⃣ Enter Solar Data: Input data such as energy production, system performance, and maintenance costs.
3️⃣ Track & Monitor KPIs: Use the dashboard to track real-time performance and compare actual data against targets.
4️⃣ Analyze & Optimize: Use insights from the dashboard to improve solar panel performance, reduce operational costs, and maximize energy production.
Who Can Benefit from the Solar Energy KPI Dashboard in Excel?
🔹 Solar Energy Providers & Installers
🔹 Renewable Energy Project Managers
🔹 Energy Analysts & Environmental Consultants
🔹 Operations & Maintenance Teams in Solar Projects
🔹 Businesses & Organizations with Solar Installations
🔹 Anyone Looking to Optimize Solar Energy Performance
Track, analyze, and optimize your solar energy systems with the Solar Energy KPI Dashboard in Excel. Monitor energy production, system performance, and operational costs to improve efficiency and profitability in your solar energy projects.
Click here to read the Detailed blog post
Visit our YouTube channel to learn step-by-step video tutorials
Youtube.com/@PKAnExcelExpert


Reviews
There are no reviews yet.