Managing social programs, funding utilization, and community impact can be challenging without clear visibility into performance data. Many social service organizations still depend on disconnected spreadsheets and manual reporting methods, which slow down decision-making and reduce transparency.
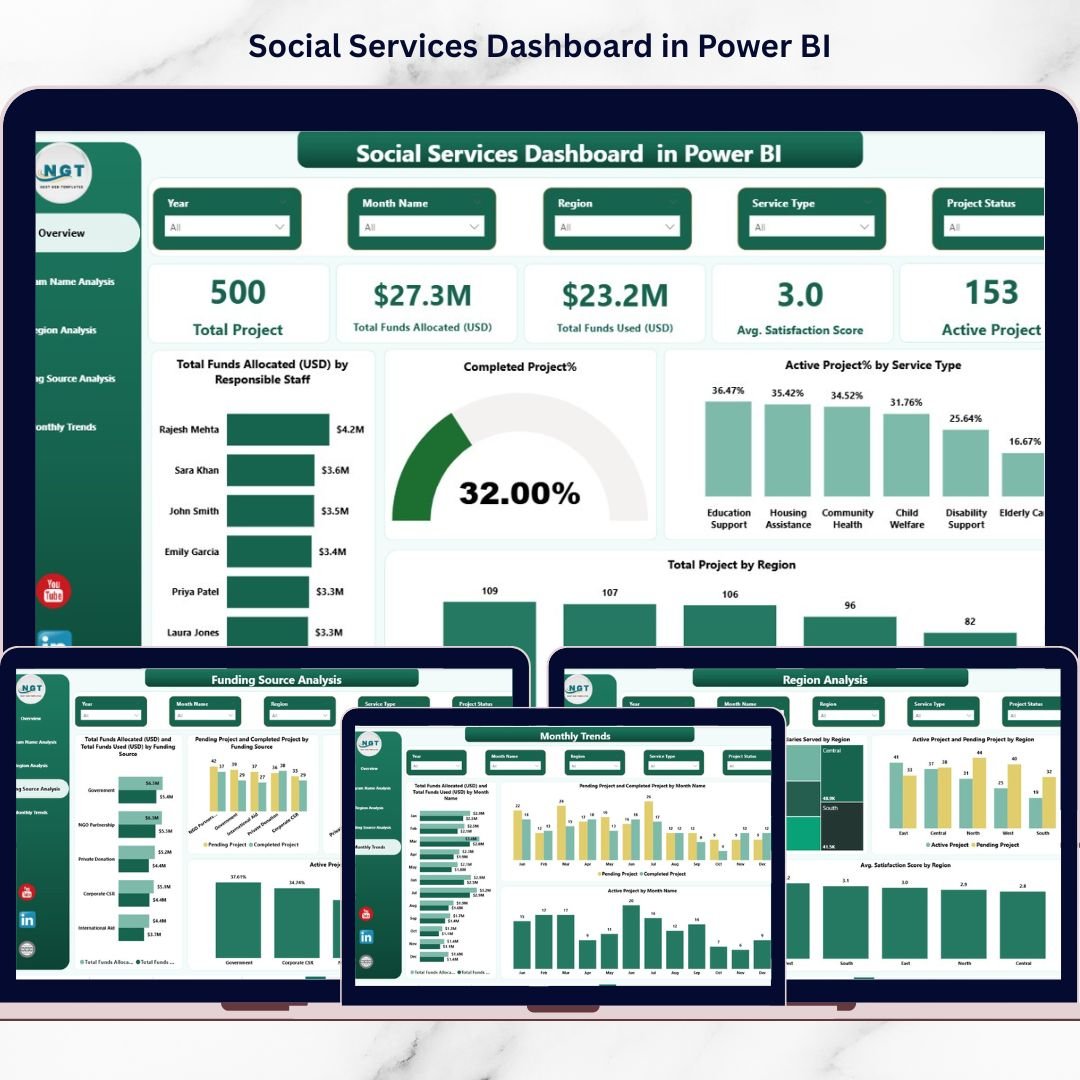
The Social Services Dashboard in Power BI is a powerful, ready-to-use analytics solution designed to transform complex program data into clear, interactive, and actionable insights. Built using Microsoft Power BI, this dashboard helps nonprofits, NGOs, and social institutions monitor projects, funding performance, beneficiary outcomes, and operational efficiency from a single centralized platform.
Instead of spending hours compiling reports, organizations can instantly analyze performance through dynamic visuals, automated calculations, and interactive filters. As data updates, the dashboard automatically refreshes insights, allowing leadership teams to make faster and smarter decisions.
Whether you want to track program success, evaluate funding utilization, or measure community impact, this dashboard provides a professional and data-driven approach to social service management.
## Key Features of Social Services Dashboard in Power BI
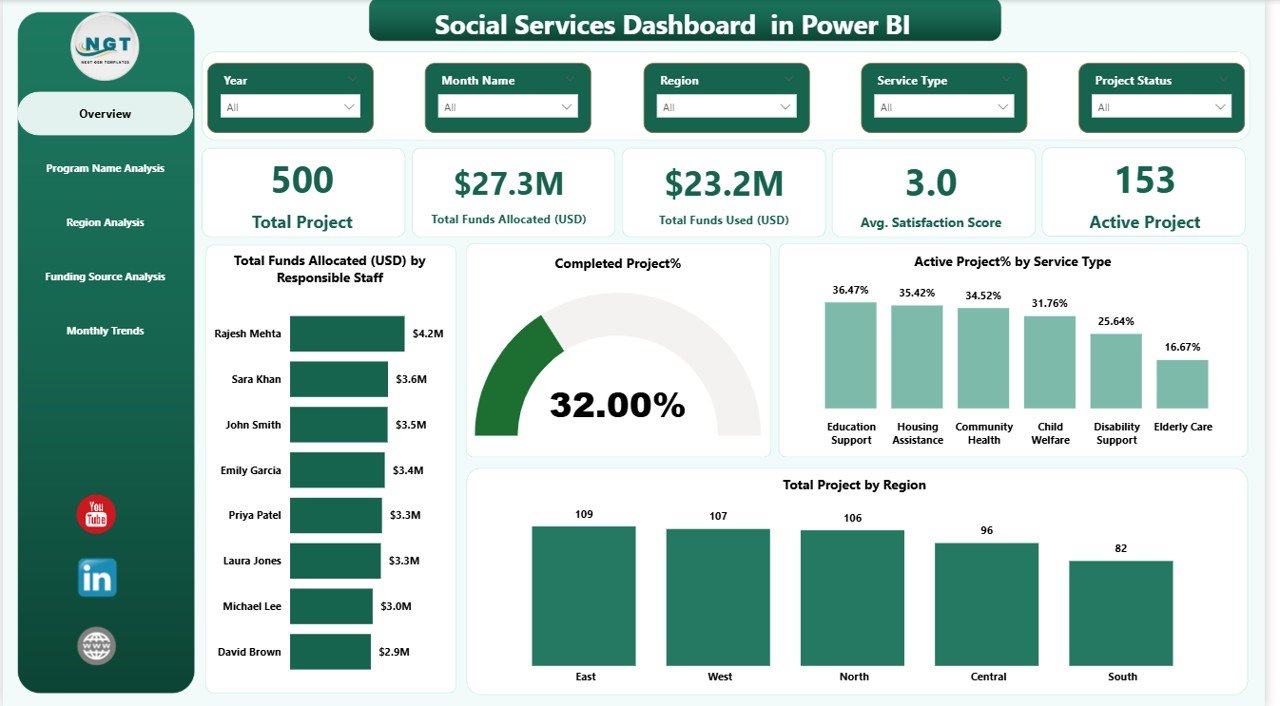
📊 Interactive KPI Monitoring – Track total projects, funds allocated, funds utilized, satisfaction scores, and active programs in real time.
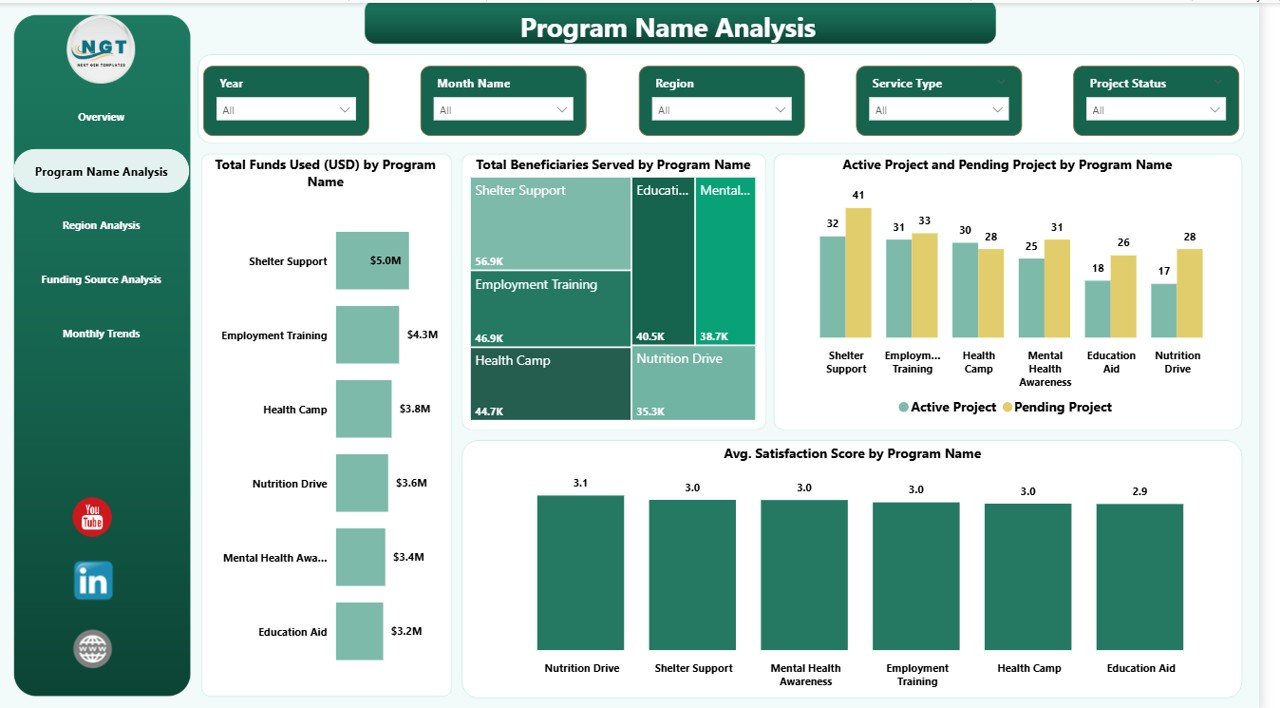
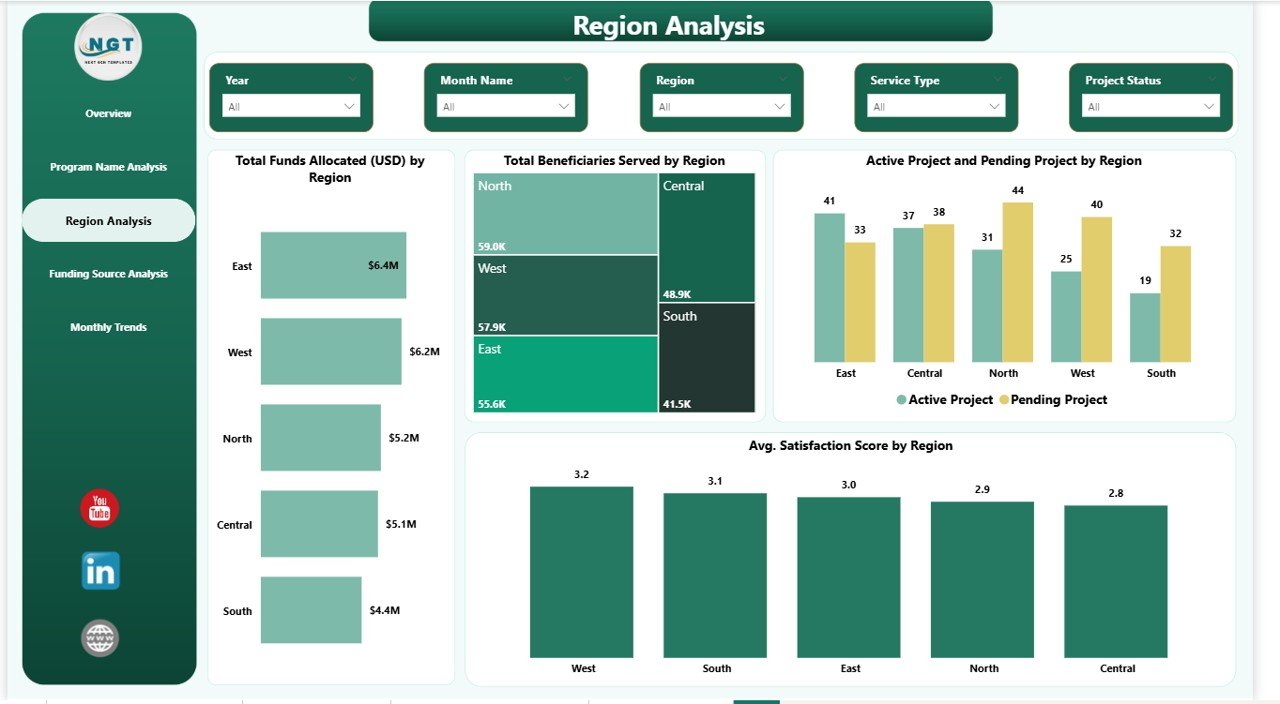
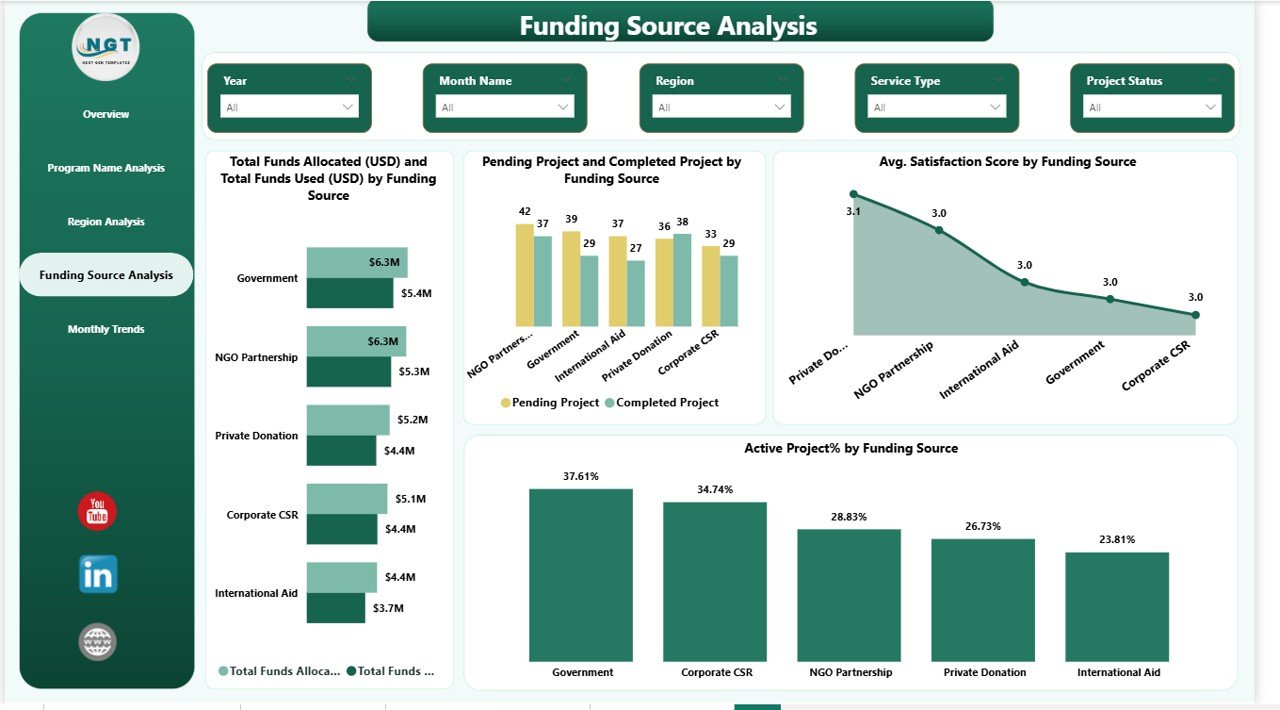
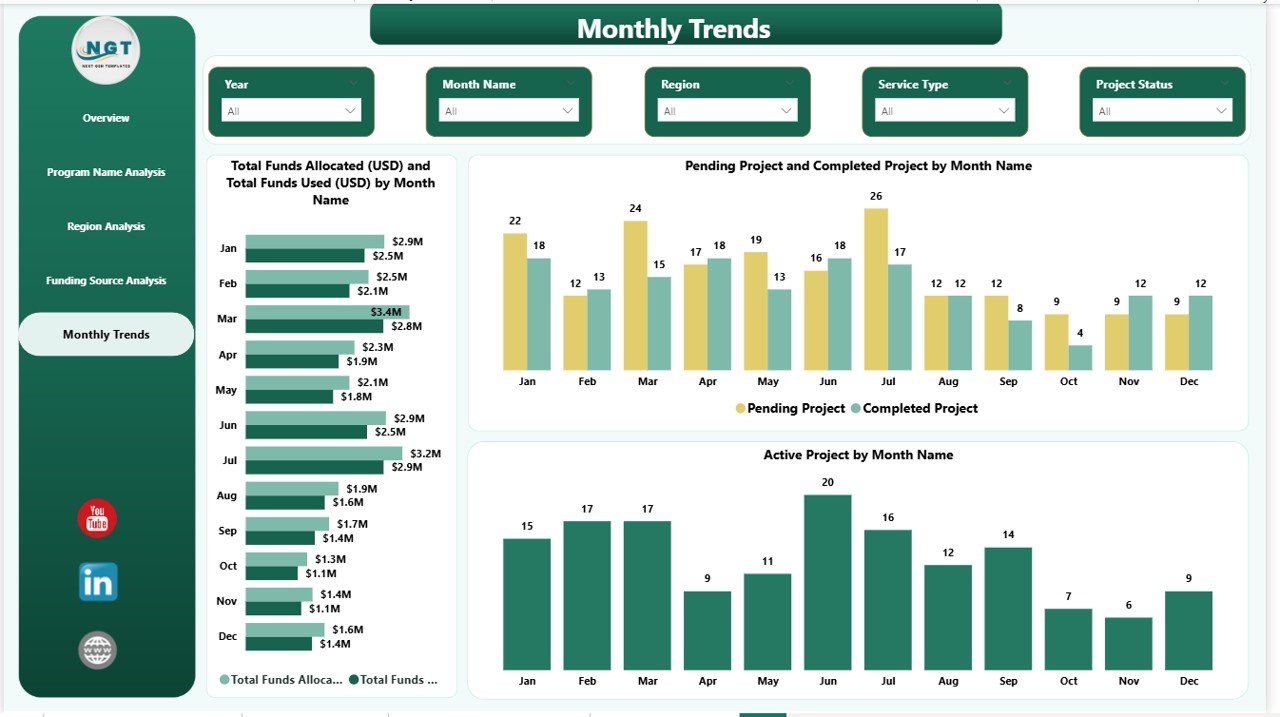
📈 Five Powerful Analysis Pages – Overview, Program Analysis, Region Analysis, Funding Source Analysis, and Monthly Trends for complete visibility.
🎯 Dynamic Filtering & Slicers – Analyze performance instantly by program, region, funding source, or time period.
💰 Funding Transparency – Monitor allocation vs utilization to ensure accountability and donor confidence.
🌍 Regional Performance Insights – Identify underserved areas and optimize resource distribution.
⚡ Automated Visual Reporting – Eliminate manual calculations with auto-updating charts and visuals.
🔎 Drill-Down Analysis – Explore detailed insights behind every KPI and chart.
📅 Trend Monitoring – Understand monthly performance patterns and forecast future needs.
## What’s Inside the Social Services Dashboard in Power BI
📁 Professionally designed Power BI dashboard file
📊 Five fully interactive analytical pages
📌 KPI cards highlighting organizational performance
📈 Dynamic charts for funding, beneficiaries, and project tracking
🎛️ Interactive slicers for customized analysis
📑 Structured data model for easy reporting
✅ Ready-to-use layout requiring minimal setup
The dashboard combines financial, operational, and social impact metrics into one easy-to-understand reporting system.
## How to Use the Social Services Dashboard in Power BI
1️⃣ Prepare your organizational data in Excel format.
2️⃣ Import the dataset into Power BI.
3️⃣ Refresh the dashboard to update visuals automatically.
4️⃣ Use slicers to filter data by region, program, or funding source.
5️⃣ Analyze KPI cards and charts to identify performance trends.
6️⃣ Share insights securely with stakeholders and leadership teams.
Even users without advanced technical skills can operate the dashboard easily due to its intuitive design.
## Who Can Benefit from This Social Services Dashboard in Power BI
🤝 Nonprofit organizations and NGOs
🏛️ Government social welfare departments
🌱 Community development agencies
💼 Donor and funding organizations
📊 Policy planners and analysts
📍 Social impact monitoring teams
📚 Research and evaluation professionals
Any organization managing social programs or community initiatives can use this dashboard to improve transparency, accountability, and decision-making.
By implementing this dashboard, organizations gain real-time visibility into program outcomes, financial performance, and beneficiary impact. Leadership teams no longer rely on delayed reports — instead, they make informed decisions supported by visual analytics.
The Social Services Dashboard in Power BI empowers organizations to measure impact clearly, optimize funding usage, and deliver better services to communities. If your organization wants to move toward data-driven social impact management, this dashboard provides the perfect starting point.
Click here to read the Detailed blog post
Watch the step-by-step video tutorial:
Visit our YouTube channel to learn step-by-step video tutorials:
👉 YouTube channel


