


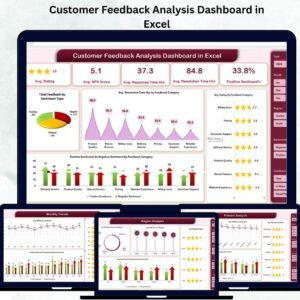
n today’s world of community programs and social impact initiatives, organizations need a simple yet powerful way to track performance, funding, and outreach. The Social Services Dashboard in Excel is a ready-to-use, interactive solution designed to help NGOs, non-profits, CSR teams, and welfare departments monitor their projects efficiently — all within Excel, without any coding or external software. 🌍📊
This smart template turns raw data into actionable insights, enabling you to visualize program performance, funding allocation, satisfaction scores, and beneficiary reach — all in one place.
💡 Key Features of Social Services Dashboard in Excel
✨ Real-Time Insights: Instantly view key metrics like total programs, allocated funds, used funds, satisfaction scores, and project completion rates.
📈 Dynamic Charts & KPIs: Visualize performance with interactive pivot-based charts and KPI cards.
🗂️ Multi-Dimensional Analysis: Track results by Program Name, Region, and Funding Source.
📅 Monthly Trend Monitoring: Observe progress month-by-month and identify seasonality or performance gaps.
💰 Funding Transparency: Clearly display how much each funding partner contributed and how effectively it was utilized.
👥 Beneficiary Tracking: Monitor outreach, satisfaction, and impact per program or region.
🧩 Completely Customizable: Add your own KPIs, filters, or visual themes without any technical skills.
⚙️ Automation Ready: Compatible with Excel formulas, macros, and slicers for a smoother experience.

📘 What’s Inside the Social Services Dashboard in Excel
The dashboard file is neatly organized into multiple Excel sheets, each serving a unique purpose for better data management and analysis:
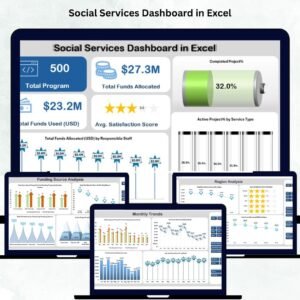
1️⃣ Overview Sheet: Displays KPI cards and summary charts like Funds Allocated vs. Funds Used, Active Projects (%), and Average Satisfaction Score.
2️⃣ Program Name Analysis: Focuses on program-wise performance with visuals for Funds Used, Beneficiaries Served, and Project Status.
3️⃣ Region Analysis: Reveals geographic insights such as Active Project % by Region and Satisfaction Score by Region.
4️⃣ Funding Source Analysis: Evaluates how each funding partner contributes and performs — ideal for donor reports.
5️⃣ Monthly Trends: Captures project completion rates, beneficiaries served, and budget flows over time.
6️⃣ Data Sheet: A clean and structured input area where users enter all program details — ensuring accuracy and automation across visuals.
🧭 How to Use the Social Services Dashboard in Excel
Using this template is simple and intuitive:
✅ Step 1: Enter program details in the Data Sheet — including Program Name, Region, Responsible Staff, Funds, and Satisfaction Scores.
✅ Step 2: Refresh Pivot Tables or Charts to auto-update all visuals.
✅ Step 3: Use Slicers to filter by region, month, or funding source for instant comparisons.
✅ Step 4: Review the Overview Page for management summaries and donor presentations.
✅ Step 5: Customize colors, labels, or KPIs as per your organization’s needs.
With built-in automation and Excel’s pivot functionality, you can go from data to decision in seconds.
👩💼 Who Can Benefit from This Social Services Dashboard
This Excel dashboard is designed for:
🏢 NGOs & Non-Profits: Simplify reporting for multi-program organizations.
💼 CSR Teams: Monitor community investments and showcase measurable impact.
🏛️ Government Agencies: Track welfare schemes and fund utilization transparently.
🎯 Donors & Sponsors: Get clear insights into how funds are allocated and results achieved.
👥 Program Managers: Compare program-wise outcomes and plan improvements.
With its user-friendly design, even non-technical users can analyze performance, track beneficiaries, and demonstrate accountability effectively.
Click here to read the Detailed Blog Post
Watch the step-by-step video tutorial:


Reviews
There are no reviews yet.