Smart wearables generate enormous amounts of data every day ⌚📈. From device usage and battery performance to user engagement and health metrics, businesses must track dozens of KPIs to stay competitive. However, when this data sits in scattered spreadsheets or raw system exports, insights get lost and decisions slow down.
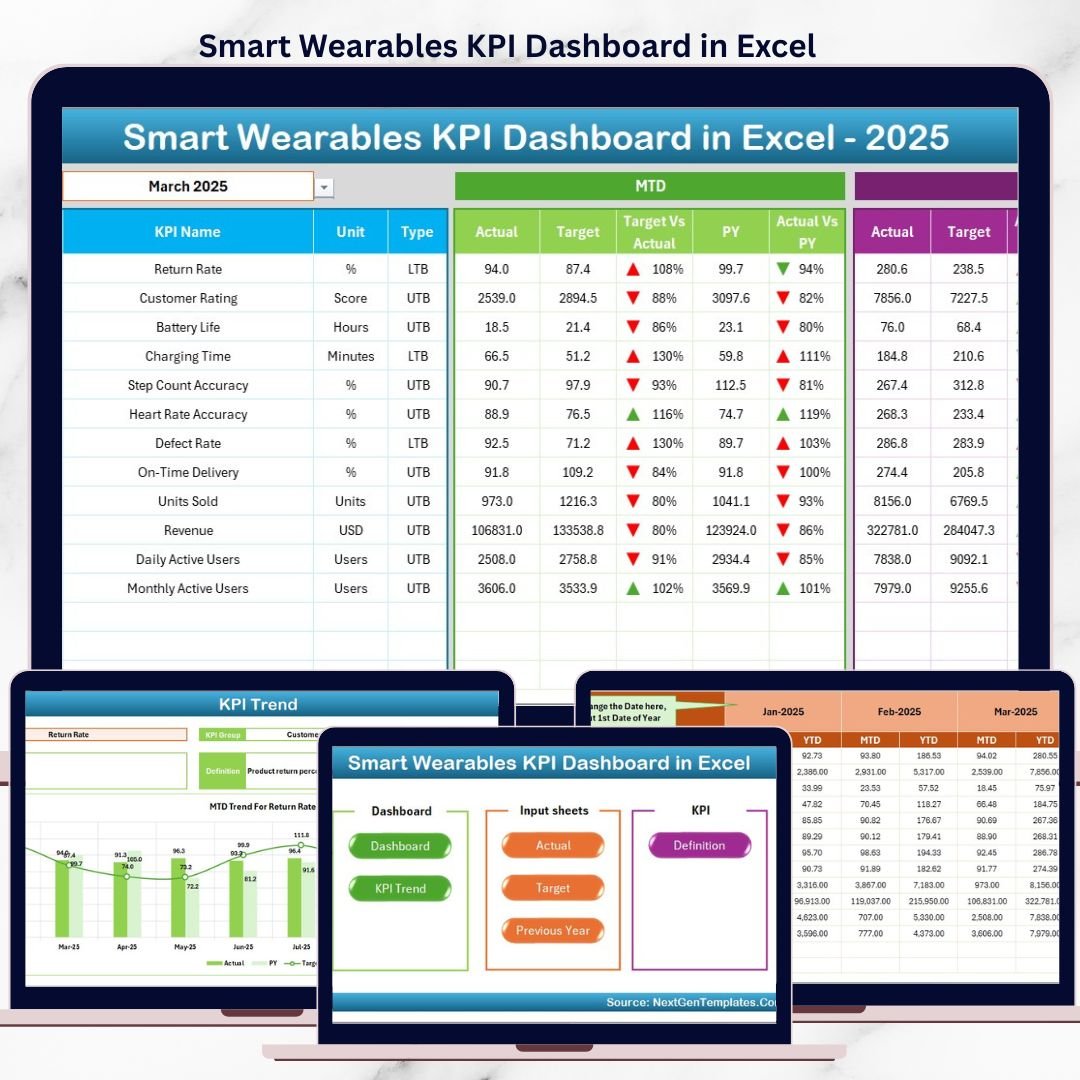
That is exactly why the Smart Wearables KPI Dashboard in Excel becomes a powerful, practical, and ready-to-use solution 🚀.
This professionally designed Excel dashboard converts complex smart wearable data into clear KPIs, visual trends, and performance comparisons. Instead of manually calculating numbers or creating reports every month, you can monitor MTD, YTD, Target, and Previous Year performance instantly from one centralized dashboard.
Built entirely in Microsoft Excel, this dashboard is easy to use, highly flexible, and scalable. Even non-technical users can analyze performance confidently using drop-downs, conditional formatting, and automated calculations—without writing complex formulas.
Whether you manage smart wearable products, health tech devices, fitness trackers, or IoT solutions, this dashboard helps you gain clarity, improve performance, and make faster data-driven decisions.
🔑 Key Features of Smart Wearables KPI Dashboard in Excel
📊 Centralized KPI monitoring in one Excel file
📅 Dynamic Month selector for instant analysis
📈 MTD & YTD Actual vs Target comparison
🔄 Previous Year vs Current Year analysis
⬆️⬇️ Conditional formatting with up/down arrows
📉 MTD & YTD KPI trend charts
📘 Built-in KPI Definition reference
🖱️ User-friendly navigation with Home sheet
⚡ No VBA, no coding, pure Excel solution
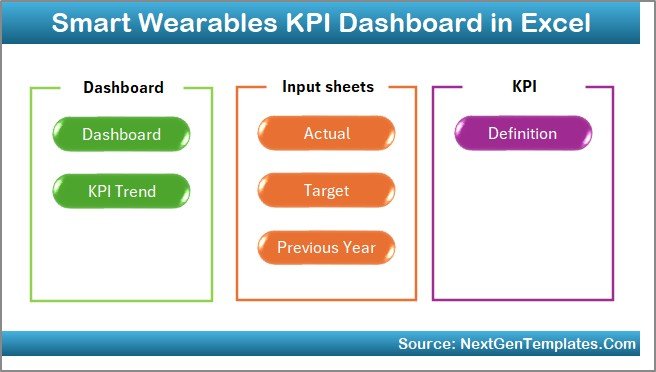
📂 What’s Inside the Smart Wearables KPI Dashboard in Excel
🏠 Home Sheet – Easy Navigation
The Home Sheet works as an index page for the entire dashboard.
What it includes:
-
🔘 6 clickable navigation buttons
-
🧭 Quick access to all worksheets
-
⏱️ Time-saving design for daily users
This ensures a smooth and professional user experience.
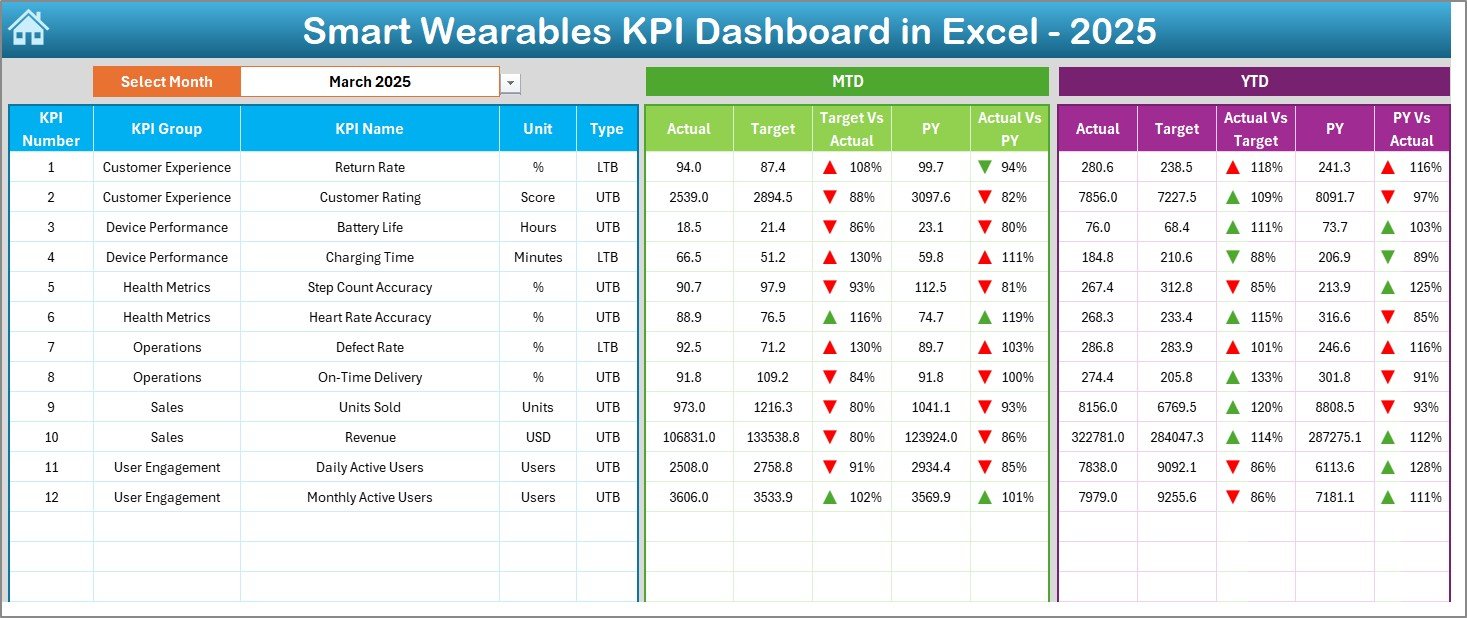
📊 Dashboard Sheet – Performance at a Glance
Smart Wearables KPI Dashboard
This is the main analytical page of the template.
Key highlights:
-
📅 Month drop-down at cell D3
-
🔄 Automatic update of all KPIs based on the selected month
-
📊 Clear comparison of:
-
MTD Actual vs Target
-
MTD Actual vs Previous Year
-
YTD Actual vs Target
-
YTD Actual vs Previous Year
-
⬆️⬇️ Conditional arrows instantly show performance direction, making insights easy to interpret.
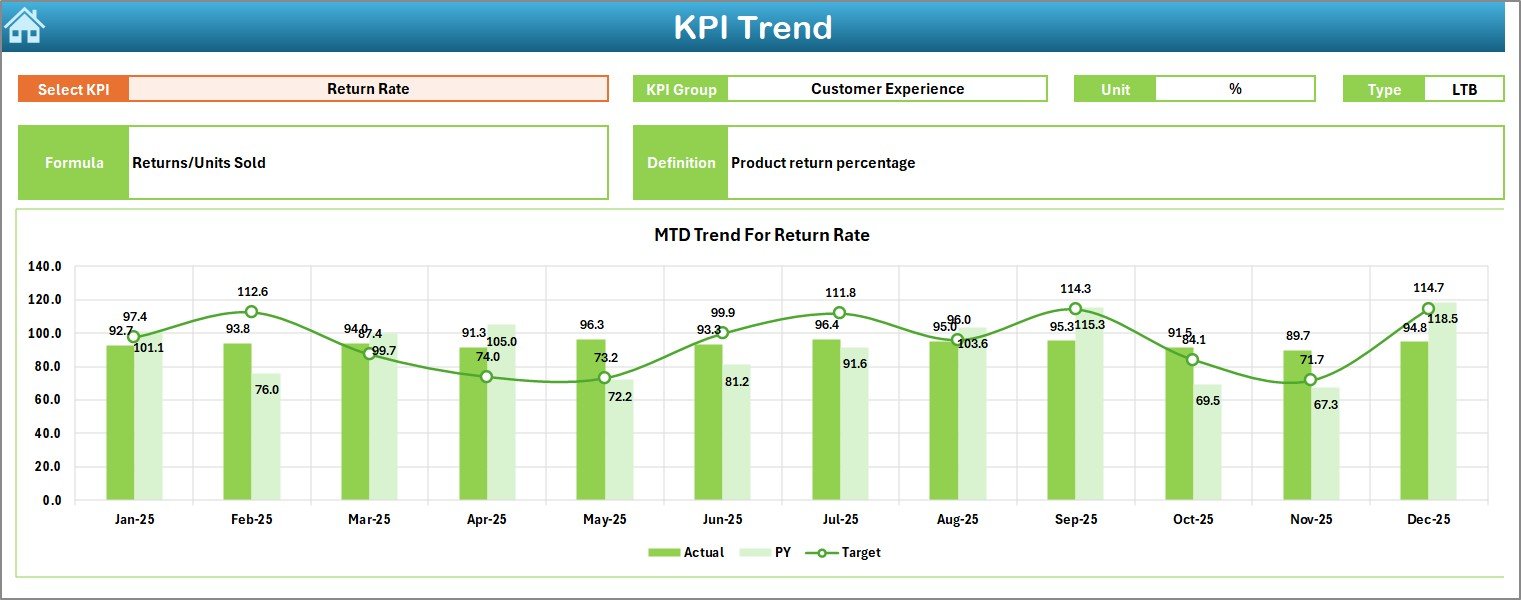
📉 KPI Trend Sheet – Deep KPI Analysis
The KPI Trend Sheet provides detailed KPI-level insights.
Interactive features:
-
🎯 KPI selection drop-down at cell C3
-
📌 Displays KPI Group, Unit, Type (UTB/LTB), Formula, and Definition
Visual analysis:
-
📈 MTD trend chart
-
📈 YTD trend chart
-
🔄 Actual vs Target vs Previous Year comparison
This sheet helps identify short-term fluctuations and long-term performance trends.
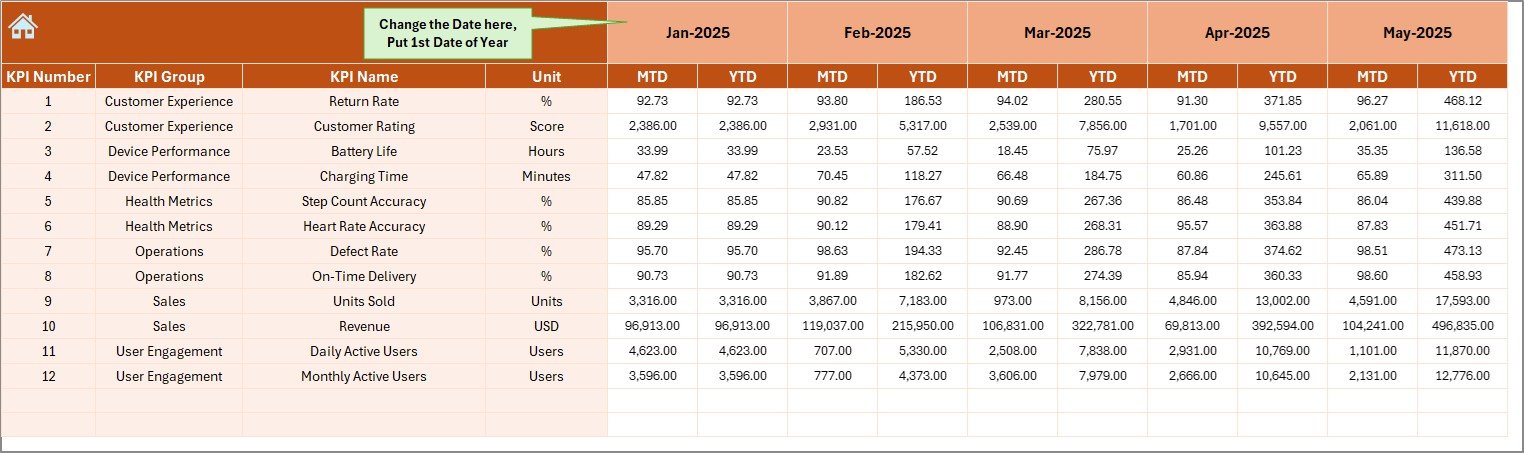
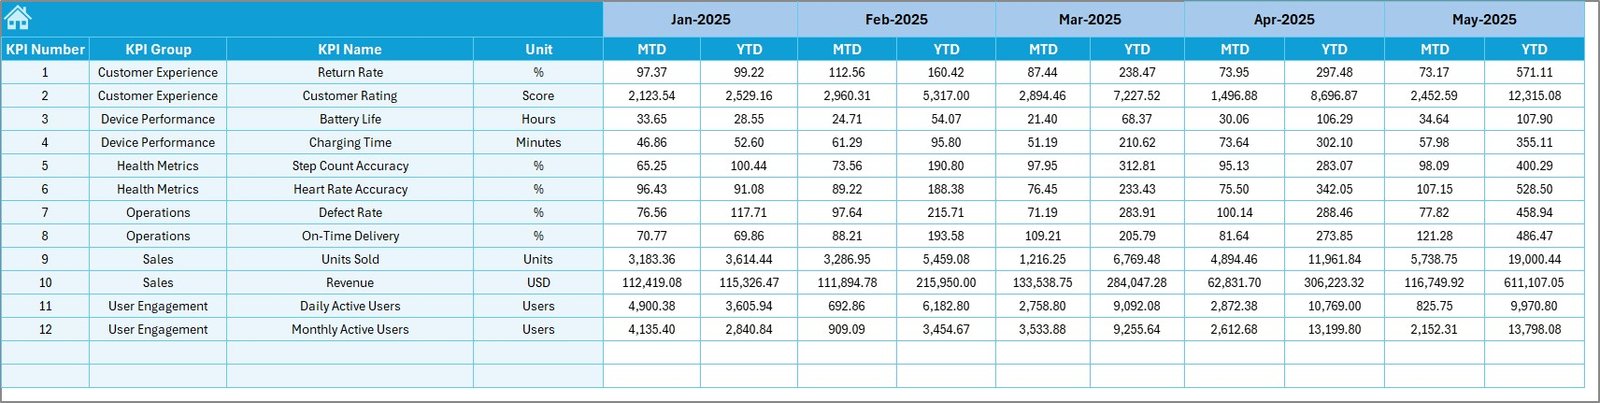
🧮 Actual Numbers Input Sheet – Data Entry Control
This sheet stores all actual KPI values.
How it works:
-
✍️ Enter MTD & YTD actual numbers
-
📆 Control the financial year start using cell E1
-
🔄 All calculations update automatically
This ensures accuracy and consistency across the dashboard.
🎯 Target Sheet – Performance Benchmarks
The Target Sheet defines expected performance.
Benefits:
-
🎯 Monthly MTD and YTD target entry
-
📊 Clear benchmarking against actuals
-
🚦 Supports variance analysis
Teams always know whether they are on track or falling behind.
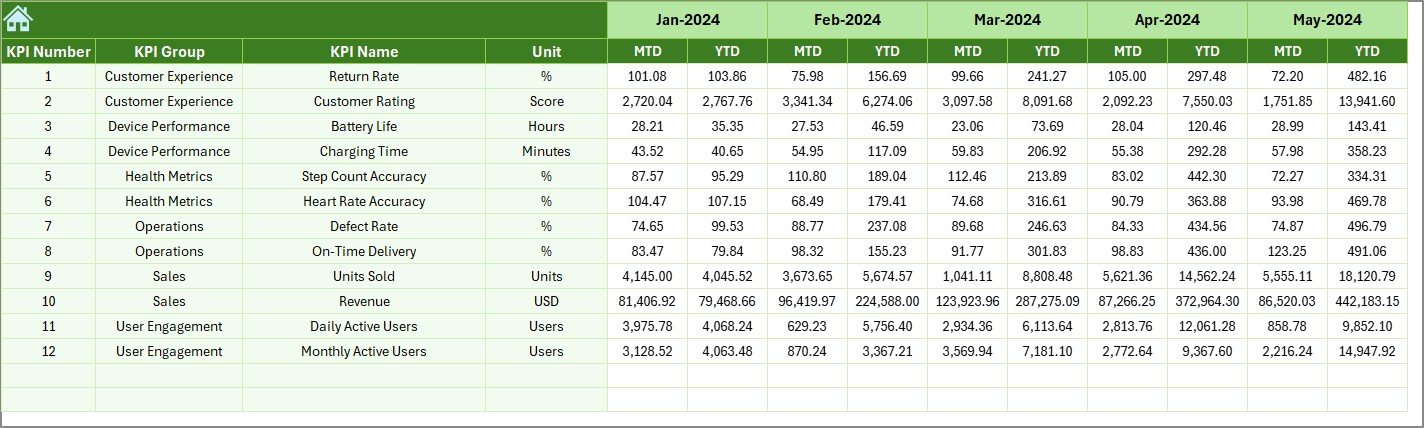
🔁 Previous Year Number Sheet – Year-Over-Year Insights
This sheet enables historical comparison.
Why it matters:
-
📉 Identify growth or decline patterns
-
📆 Detect seasonal trends
-
🧠 Support long-term strategy decisions
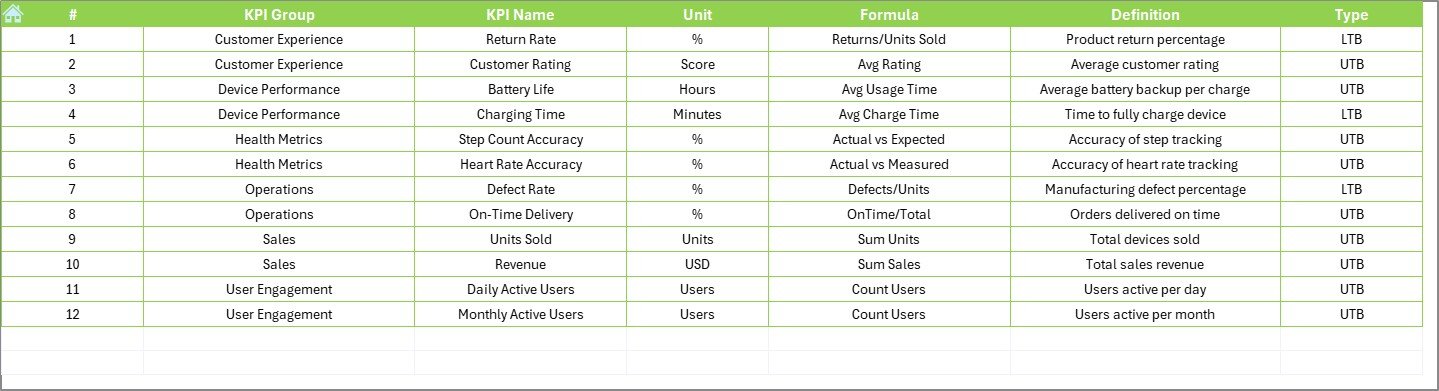
📘 KPI Definition Sheet – Single Source of Truth
The KPI Definition Sheet acts as a KPI dictionary.
Includes:
-
KPI Name
-
KPI Group
-
Unit
-
Formula
-
Definition
This avoids confusion and ensures consistent interpretation across teams.
⚙️ How to Use the Smart Wearables KPI Dashboard in Excel
1️⃣ Enter actual KPI data
2️⃣ Update target and previous year values
3️⃣ Select month from the drop-down
4️⃣ Review KPI performance and trends
5️⃣ Make faster, data-driven decisions
No complexity. Just insights ✔️
🎯 Who Can Benefit from This Dashboard?
⌚ Smart Wearable Manufacturers
🏃 Fitness & Health Tech Companies
📡 IoT & Wearable Analytics Teams
📊 Product Managers & Analysts
🚀 Startups & Growing Businesses
### 👉 Click here to read the Detailed blog post
▶️ Visit our YouTube channel to learn step-by-step video tutorials
https://youtube.com/@PKAnExcelExpert


Reviews
There are no reviews yet.