
Managing modern power grid operations without real-time performance visibility often leads to inefficiencies, delayed responses, and operational risks. Smart grids generate massive data from meters, substations, transformers, and control systems. However, raw data alone does not create value unless it is converted into meaningful insights.
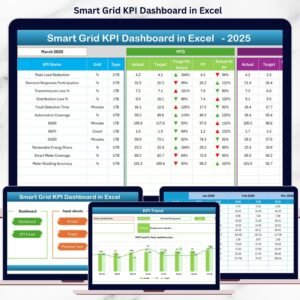
That is exactly where the Smart Grid KPI Dashboard in Excel becomes a powerful and practical performance management solution. This ready-to-use Excel dashboard helps utilities and energy teams track reliability, efficiency, outages, losses, demand, and asset performance from one centralized file—without complex BI tools.
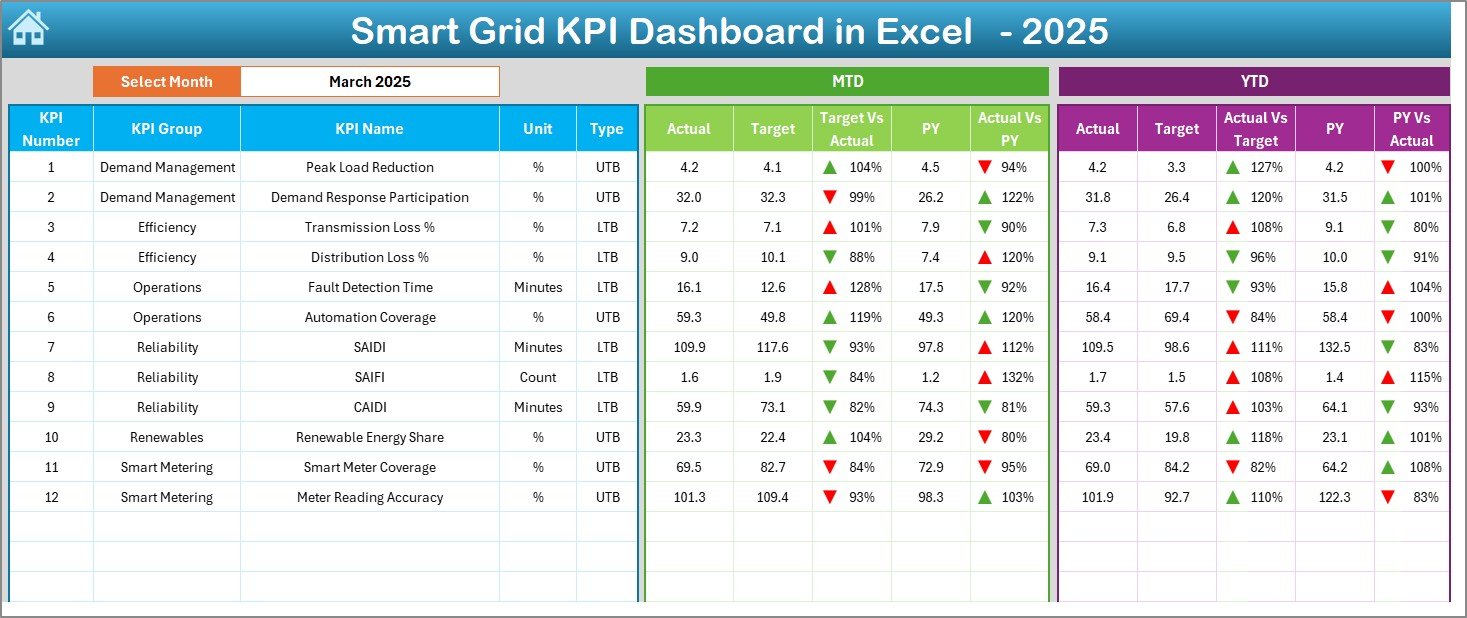
Built entirely in Microsoft Excel, this dashboard is cost-effective, easy to use, and suitable for both technical and non-technical users. You simply update the data, select a month, and instantly view MTD and YTD performance with visual indicators and trend analysis.
## 🚀 Key Features of Smart Grid KPI Dashboard in Excel
⚡ Centralized KPI Monitoring
Track all smart grid KPIs in one structured Excel dashboard instead of scattered reports.
📅 Dynamic Month Selection
Select the required month using a drop-down, and the entire dashboard updates automatically.
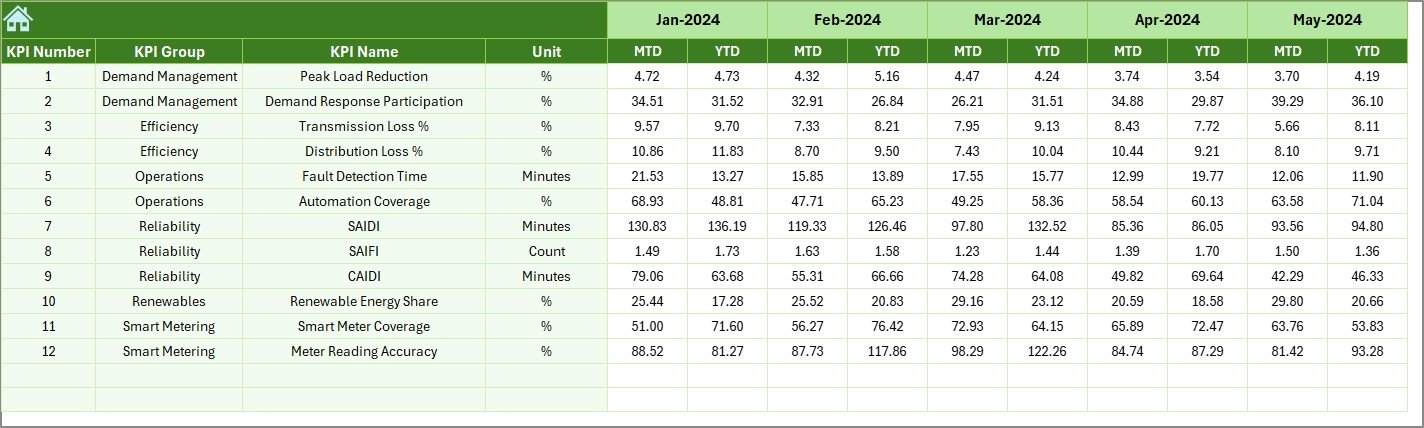
📊 MTD & YTD Performance Tracking
Monitor Monthly-to-Date and Year-to-Date Actual, Target, and Previous Year values.
🔼🔽 Smart Visual Indicators
Up/down arrows and conditional formatting instantly highlight performance direction.
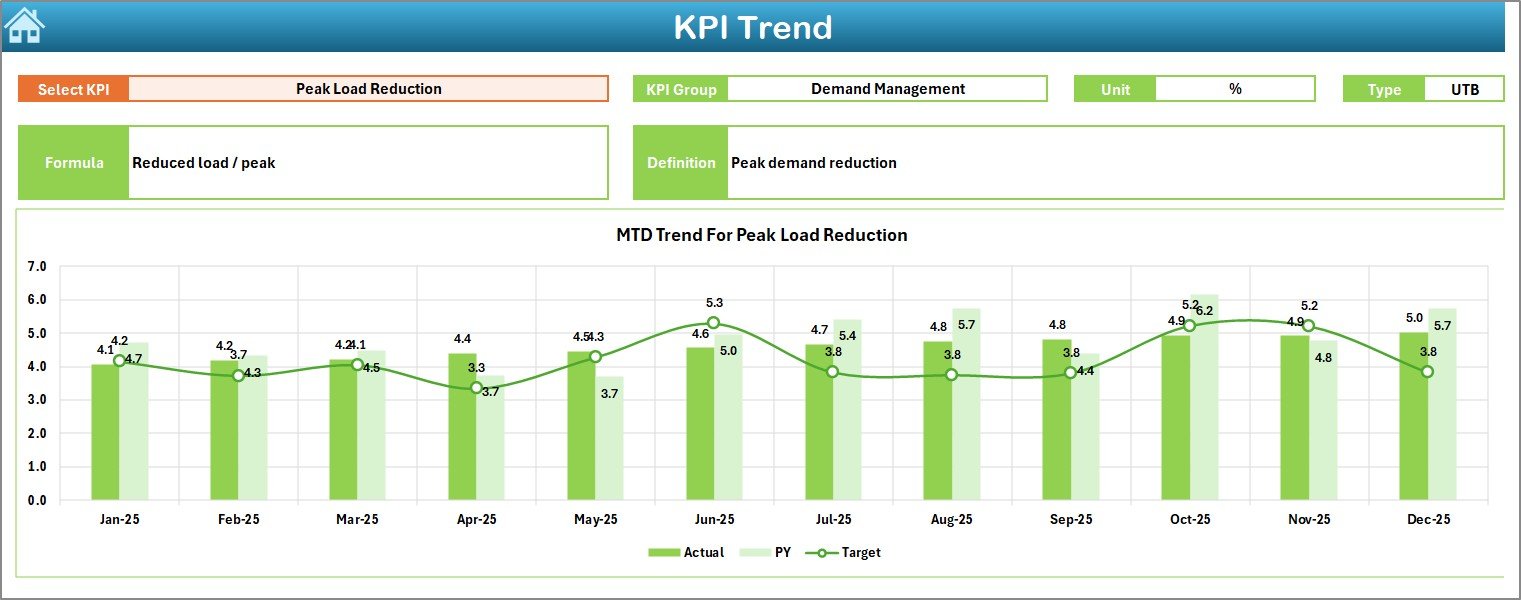
📈 Trend Analysis
Analyze KPI trends over time to identify seasonal patterns and performance shifts.
📂 Well-Structured Worksheets
Dedicated sheets for Summary, Dashboard, Trends, Actuals, Targets, Previous Year data, and KPI Definitions.
🧩 Fully Customizable
Add new KPIs, modify targets, or expand analysis as grid operations grow.
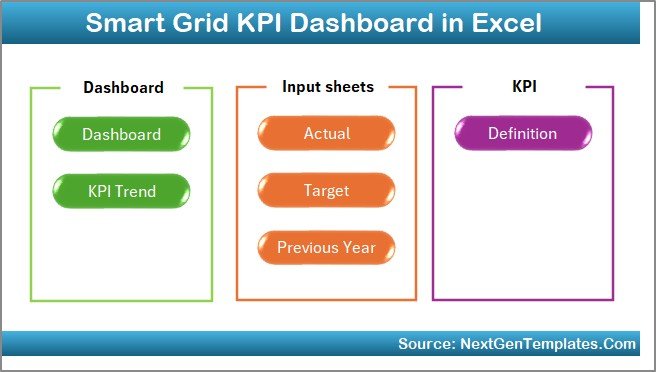
## 📦 What’s Inside the Smart Grid KPI Dashboard in Excel
📌 Summary Page – Easy navigation with one-click buttons
📌 Main Dashboard Sheet – MTD & YTD KPI comparisons with visual cues
📌 Trend Analysis Sheet – KPI-wise trend charts and detailed metadata
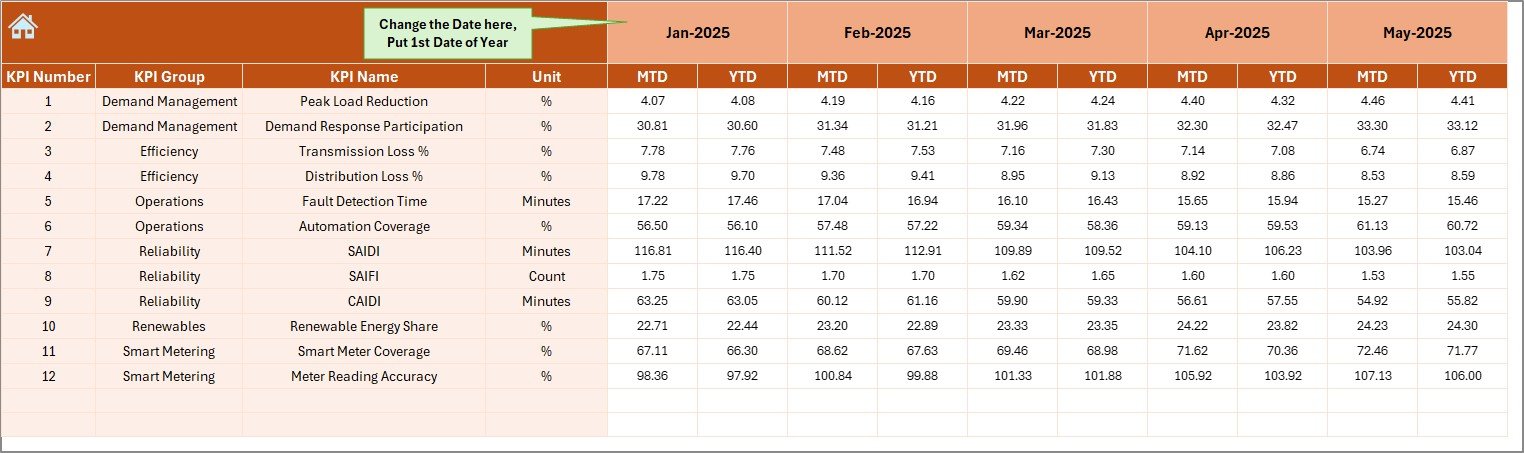
📌 Actual Numbers Input Sheet – Enter real operational data
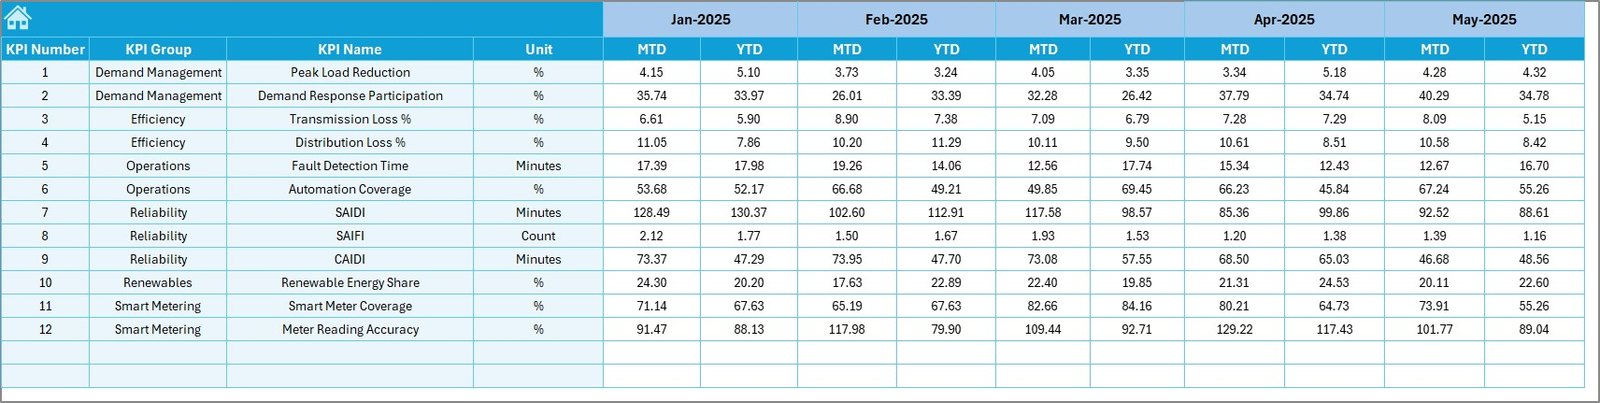
📌 Target Sheet – Maintain monthly and yearly performance targets
📌 Previous Year Data Sheet – Enable year-over-year comparison
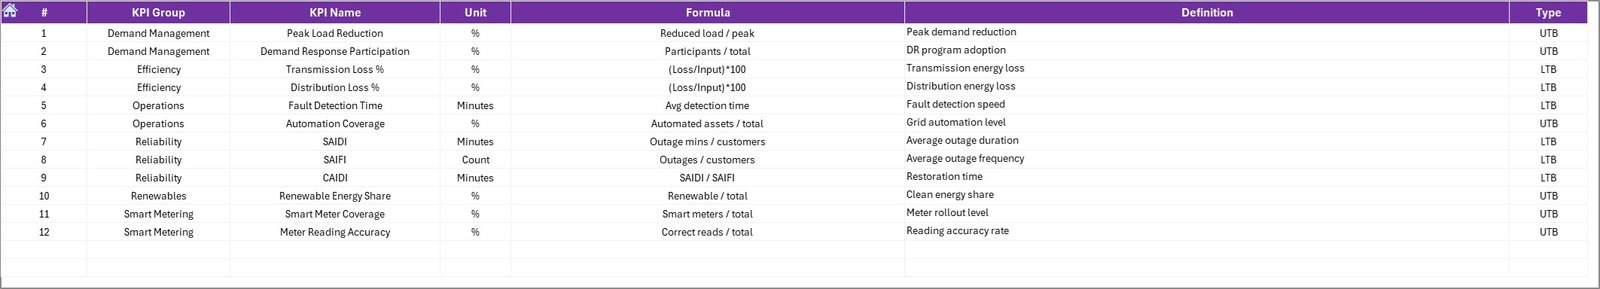
📌 KPI Definition Sheet – Clear KPI formulas, units, and definitions
Each sheet is logically designed to ensure smooth data flow and clear insights.
## 🛠️ How to Use the Smart Grid KPI Dashboard in Excel
📝 Step 1: Enter actual MTD and YTD values in the Actual Numbers sheet
🎯 Step 2: Define targets in the Target sheet
📅 Step 3: Add previous year data for comparison
📊 Step 4: Select the month from the dashboard drop-down
📈 Step 5: Analyze performance, trends, and deviations instantly
No advanced Excel knowledge is required. The dashboard handles calculations automatically.
## 👥 Who Can Benefit from This Smart Grid KPI Dashboard
⚙️ Power Utilities
⚡ Smart Grid Operators
🔌 Energy Distribution Companies
🌱 Renewable Energy Managers
📉 Grid Reliability & Maintenance Teams
📋 Regulatory & Compliance Teams
📊 Operations & Performance Managers
This dashboard supports operational, tactical, and strategic decision-making across all levels.
Click here to read the Detailed Blog Post
Watch the step-by-step video tutorial:


Reviews
There are no reviews yet.