Modern smart cities handle complex procurement operations involving multiple vendors, departments, budgets, and compliance requirements. However, managing purchasing performance using scattered Excel files and static reports often leads to delays, cost overruns, and weak accountability. That is why city administrators and procurement teams need a smarter, visual, and KPI-driven solution.
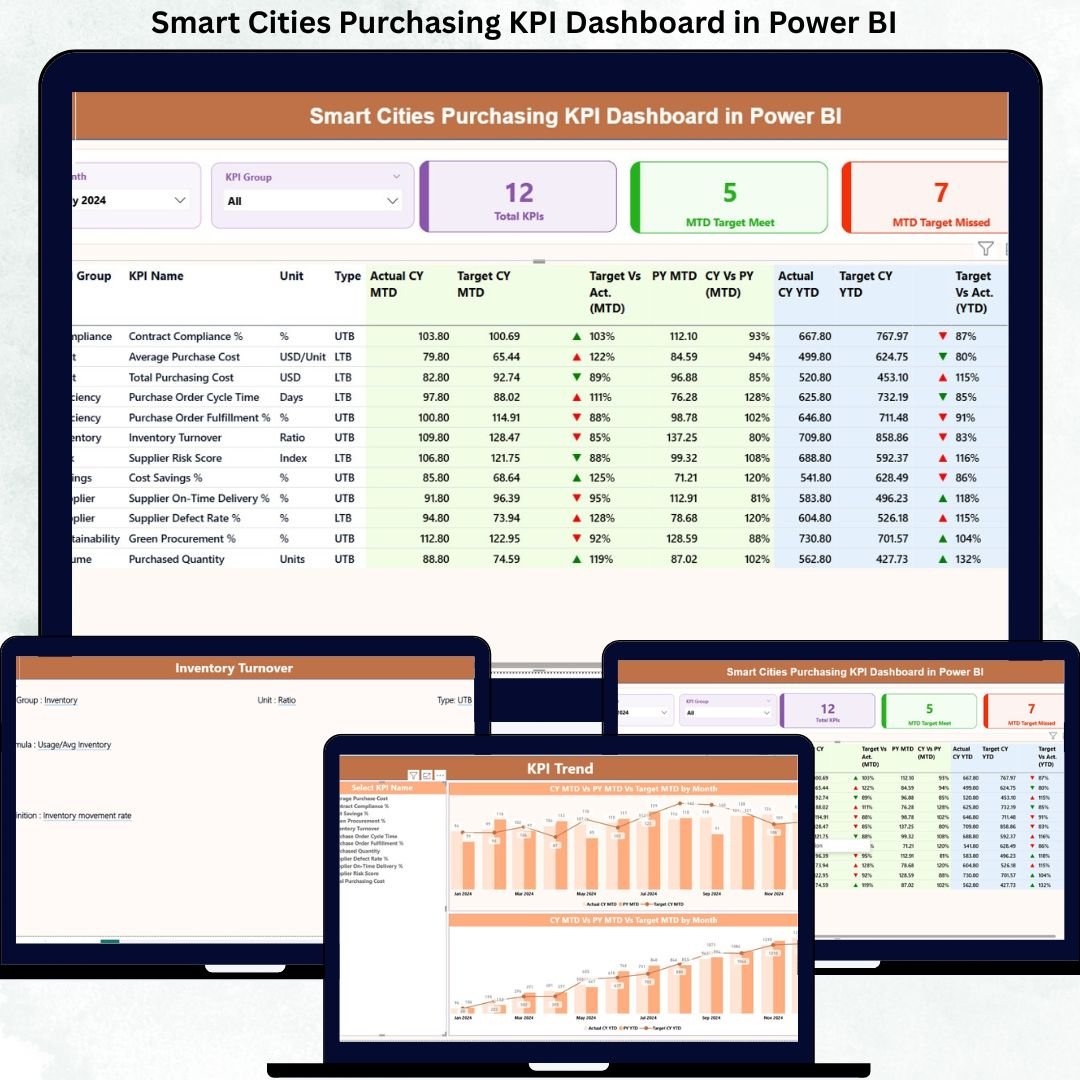
The Smart Cities Purchasing KPI Dashboard in Power BI is a ready-to-use analytical tool designed to bring complete transparency, speed, and control to public sector purchasing. This dashboard converts raw procurement data into powerful KPIs, visual indicators, trend analysis, and target comparisons—helping smart cities take faster and more confident decisions.
Built using Excel as the data source and Power BI as the visualization layer, this dashboard delivers enterprise-level insights without complex system integrations. As a result, smart city teams can focus on governance, efficiency, and cost control instead of manual reporting.
🔑 Key Features of Smart Cities Purchasing KPI Dashboard in Power BI
📊 Centralized Procurement Monitoring
Track all purchasing KPIs in one interactive dashboard instead of managing multiple reports.
📅 Dynamic Month & KPI Group Slicers
Filter performance instantly by reporting period or procurement category.
🎯 MTD & YTD Target vs Actual Tracking
Monitor Month-to-Date and Year-to-Date performance with automated calculations.
🚦 Visual Performance Indicators
Green and red icons instantly show whether KPIs meet or miss targets.
📈 Trend & Year-over-Year Analysis
Compare current performance with previous year data to identify improvement areas.
📂 Excel-Based Data Input
Update data easily without changing dashboard structure or visuals.
📦 What’s Inside the Smart Cities Purchasing KPI Dashboard
This dashboard includes three professionally designed Power BI pages, each serving a specific analytical purpose:
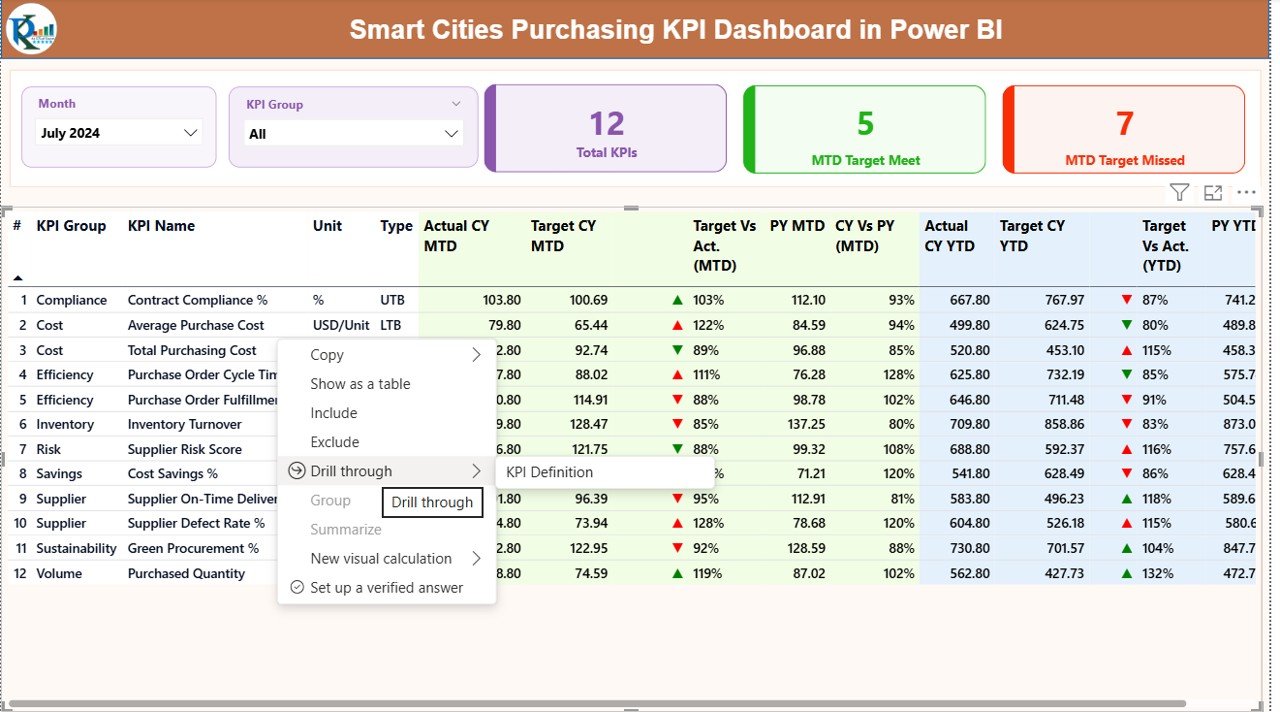
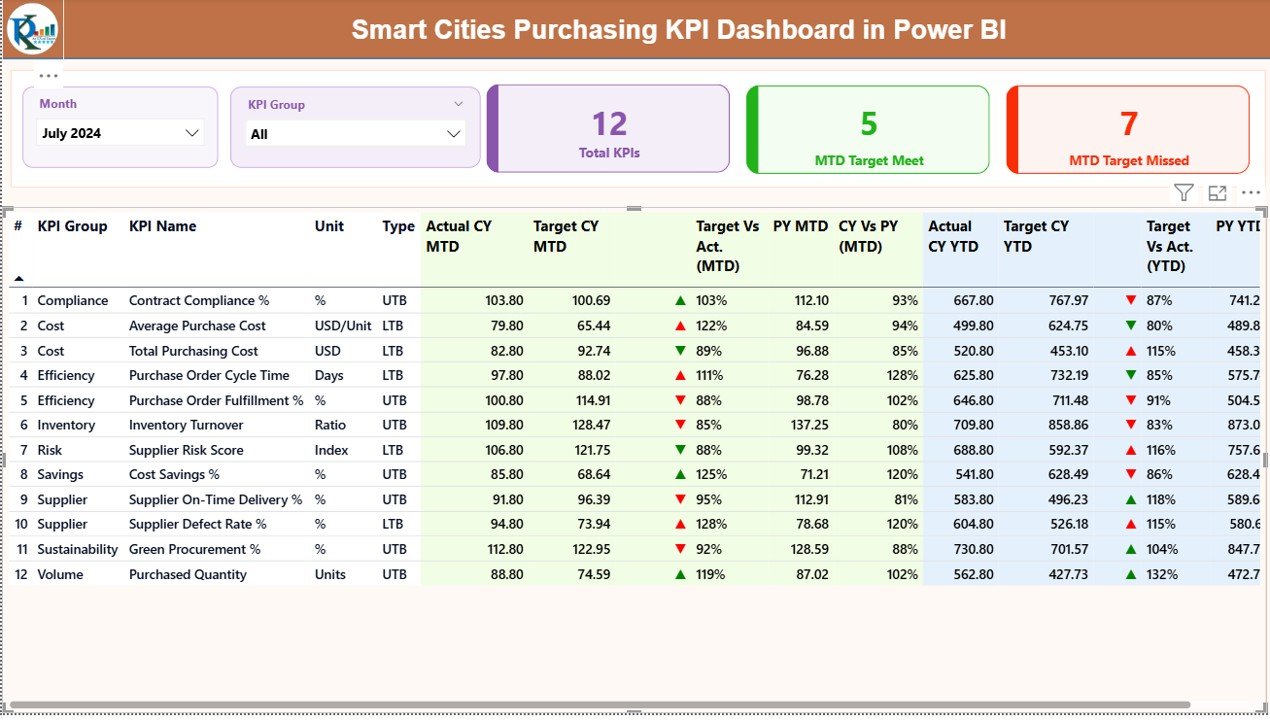
📌 Summary Page
Provides a high-level overview with KPI cards, slicers, and a detailed KPI performance table showing MTD, YTD, and YoY metrics.
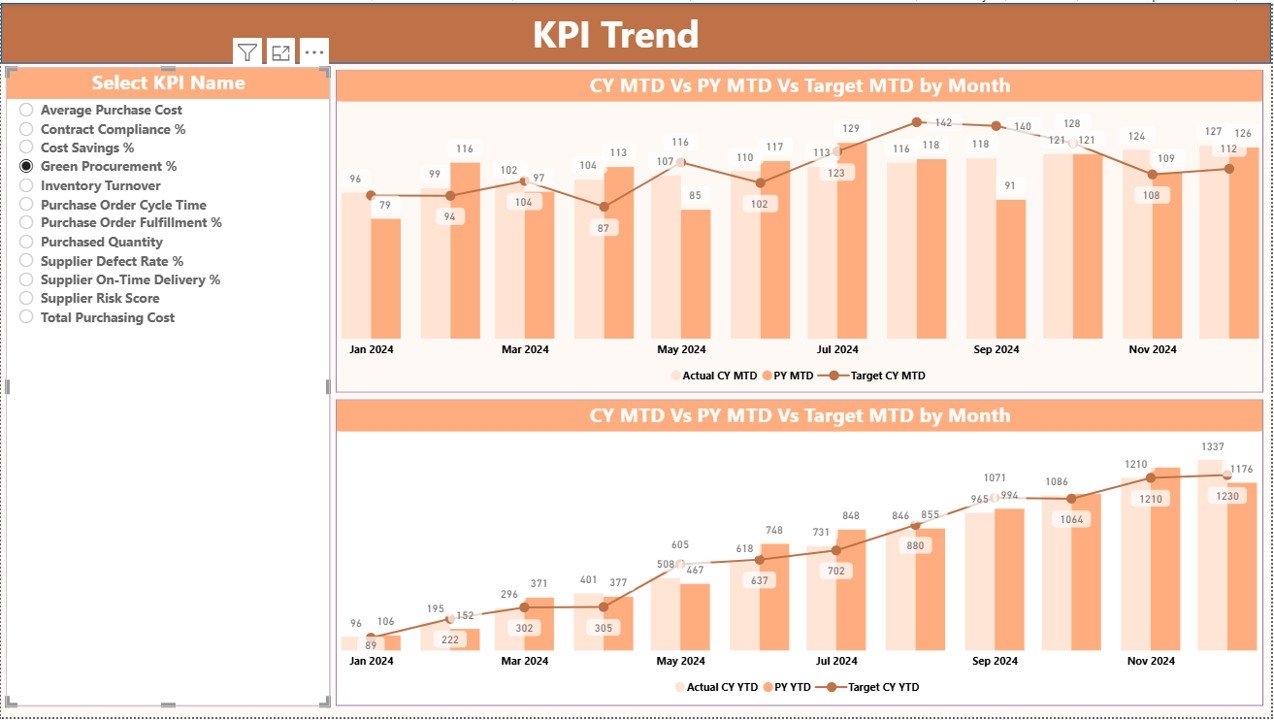
📌 KPI Trend Page
Displays interactive combo charts for MTD and YTD performance, allowing users to analyze trends and forecasting accuracy.
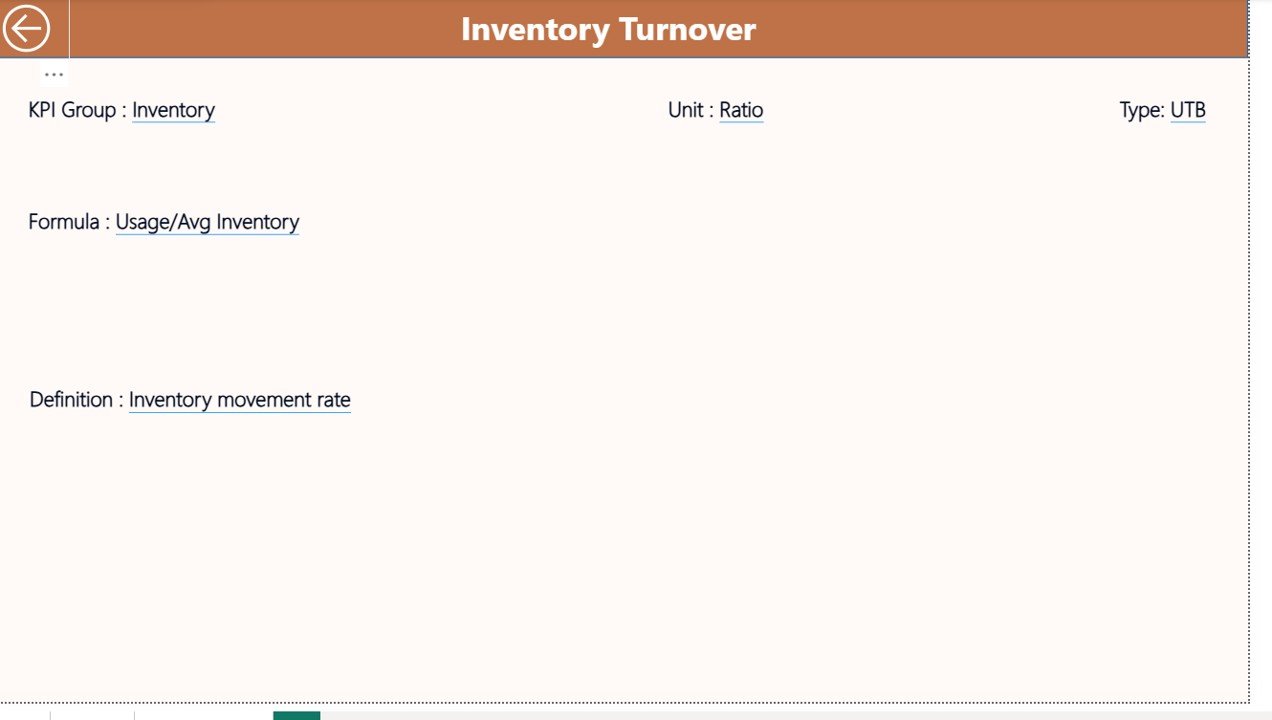
📌 KPI Definition Page
Acts as a reference layer showing KPI formulas, definitions, units, and KPI type (LTB or UTB) to ensure governance and clarity.
Additionally, the Excel data model includes structured sheets for Actuals, Targets, and KPI Definitions, making the dashboard scalable and audit-ready.
⚙️ How to Use the Smart Cities Purchasing KPI Dashboard
Using this dashboard is simple and efficient:
📝 Enter Actual and Target values in the Excel input sheets
🔄 Refresh the Power BI dashboard
📊 Review KPI cards, tables, and trend charts
🚀 Identify gaps, risks, and improvement opportunities
📈 Make data-driven procurement decisions
No advanced Power BI skills are required—just update the Excel file and analyze results instantly.
👥 Who Can Benefit from This Smart Cities Purchasing KPI Dashboard
This dashboard is ideal for:
🏙 Smart City Procurement Teams
💰 City Finance & Budgeting Departments
🏗 Urban Planning & Infrastructure Authorities
📋 Public Sector Project Managers
🏛 Municipal Leadership & Decision Makers
Whether managing a small municipality or a large metropolitan program, this dashboard adapts seamlessly.
🎯 Why This Dashboard Is a Must-Have for Smart Cities
By using this dashboard, smart cities gain:
✅ Faster procurement decisions
✅ Improved transparency and accountability
✅ Stronger cost control
✅ Better vendor performance tracking
✅ Data-driven governance
Ultimately, this dashboard transforms procurement from a reactive process into a strategic pillar of smart city success.
Click hare to read the Detailed blog post
Watch the step-by-step video tutorial:
Visit our YouTube channel to learn step-by-step video tutorials
https://youtube.com/@PKAnExcelExpert


Reviews
There are no reviews yet.