Smart city procurement involves massive budgets, strict compliance, and public accountability. Yet many procurement teams still struggle with fragmented spreadsheets, delayed reports, and limited visibility. As projects scale, decision-making becomes slower and riskier.
That is exactly where the Smart Cities Procurement KPI Dashboard in Excel delivers unmatched value. This professionally designed Excel dashboard transforms complex procurement data into clear, visual, and actionable insights—all inside a single, easy-to-use workbook. Without expensive BI tools or complex systems, you gain full control over procurement performance with confidence and clarity.
This dashboard is not just a report—it is a decision-making engine built specifically for modern smart city procurement operations.
🔑 Key Features of Smart Cities Procurement KPI Dashboard in Excel
🚀 Centralized KPI Monitoring
Track all procurement KPIs in one structured Excel dashboard instead of managing multiple disconnected files.
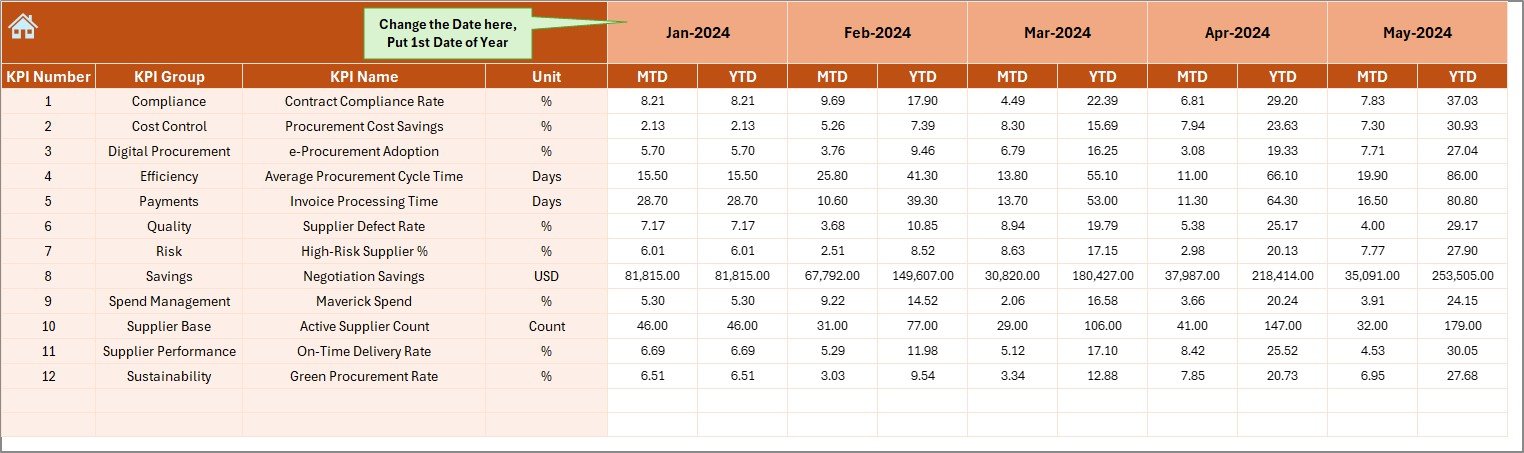
📅 MTD & YTD Performance Tracking
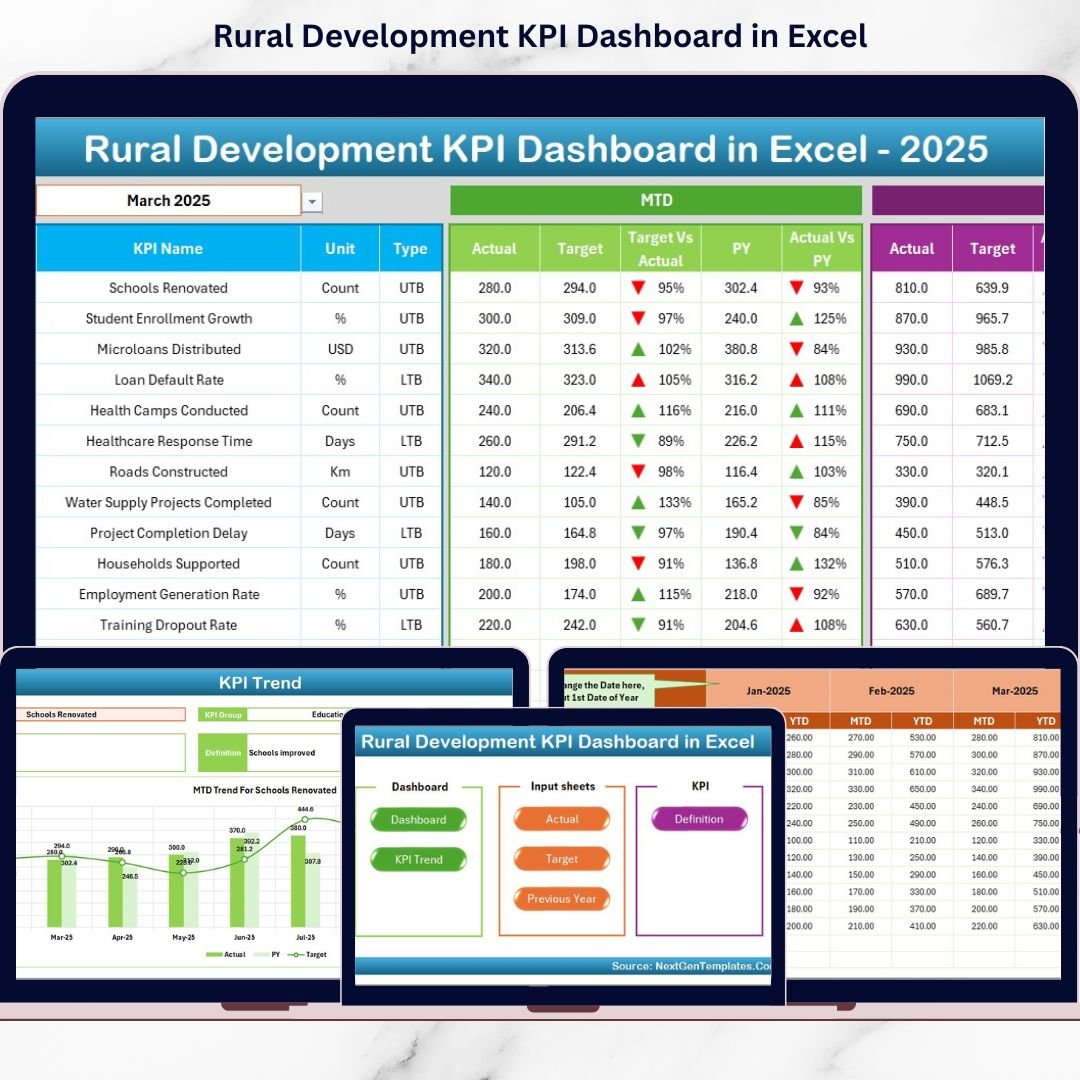
Analyze Month-to-Date and Year-to-Date Actuals, Targets, and Previous Year values side by side for better clarity.
🎯 Target vs Actual Analysis
Instantly identify cost overruns, savings, and efficiency gaps using automated variance calculations.
📉 Previous Year Comparison
Measure year-over-year improvement or decline to support long-term procurement planning.
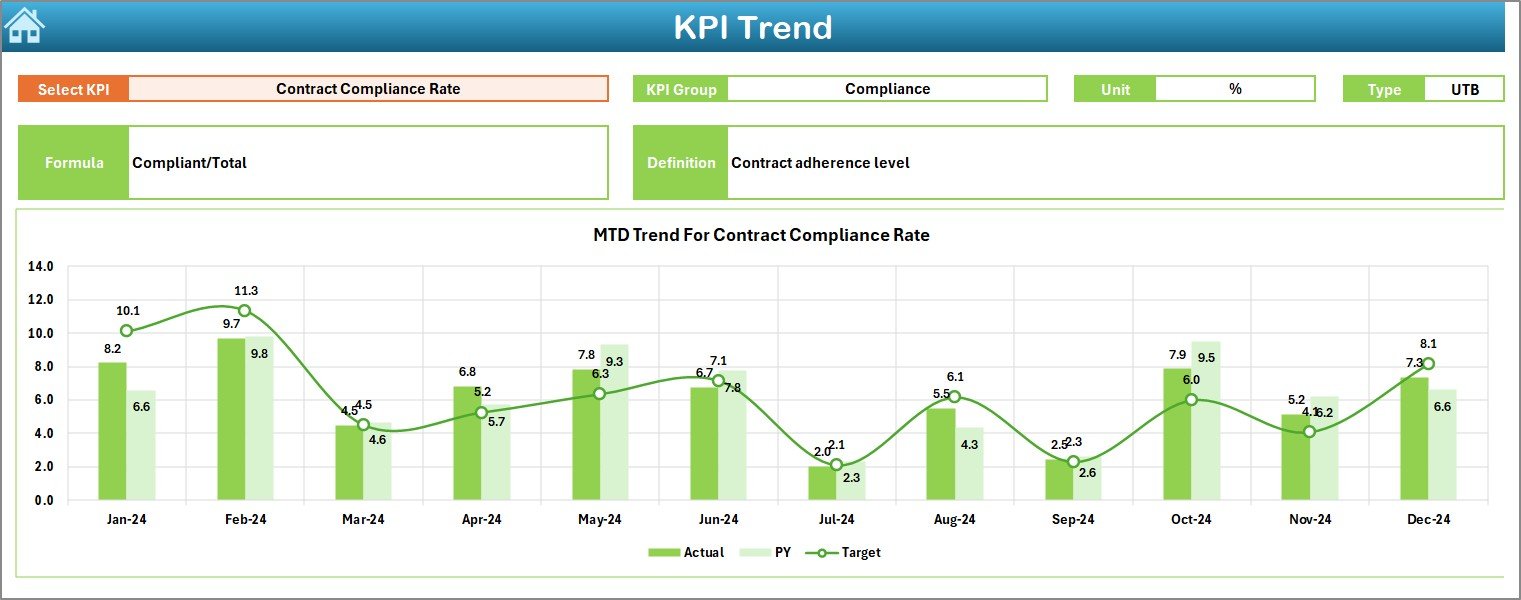
📈 Interactive Trend Analysis
Visual trend charts help you identify patterns, risks, and opportunities before issues escalate.
🔄 Dynamic Month Selection
Change the month from a simple drop-down, and the entire dashboard updates automatically.
🧭 User-Friendly Navigation
One-click navigation buttons ensure smooth movement across all dashboard sections.
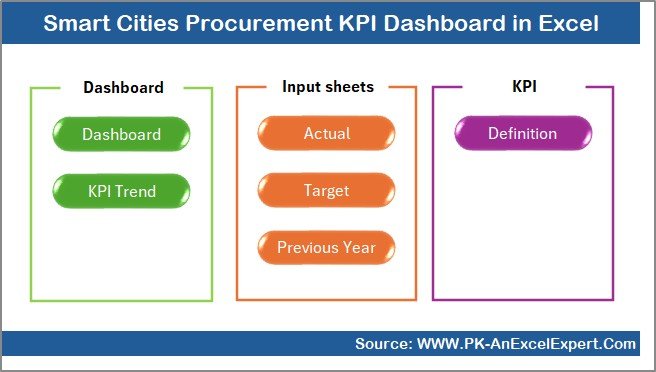
📦 What’s Inside the Smart Cities Procurement KPI Dashboard in Excel
📌 Summary Page
A clean index sheet with navigation buttons for instant access to all dashboard sections.
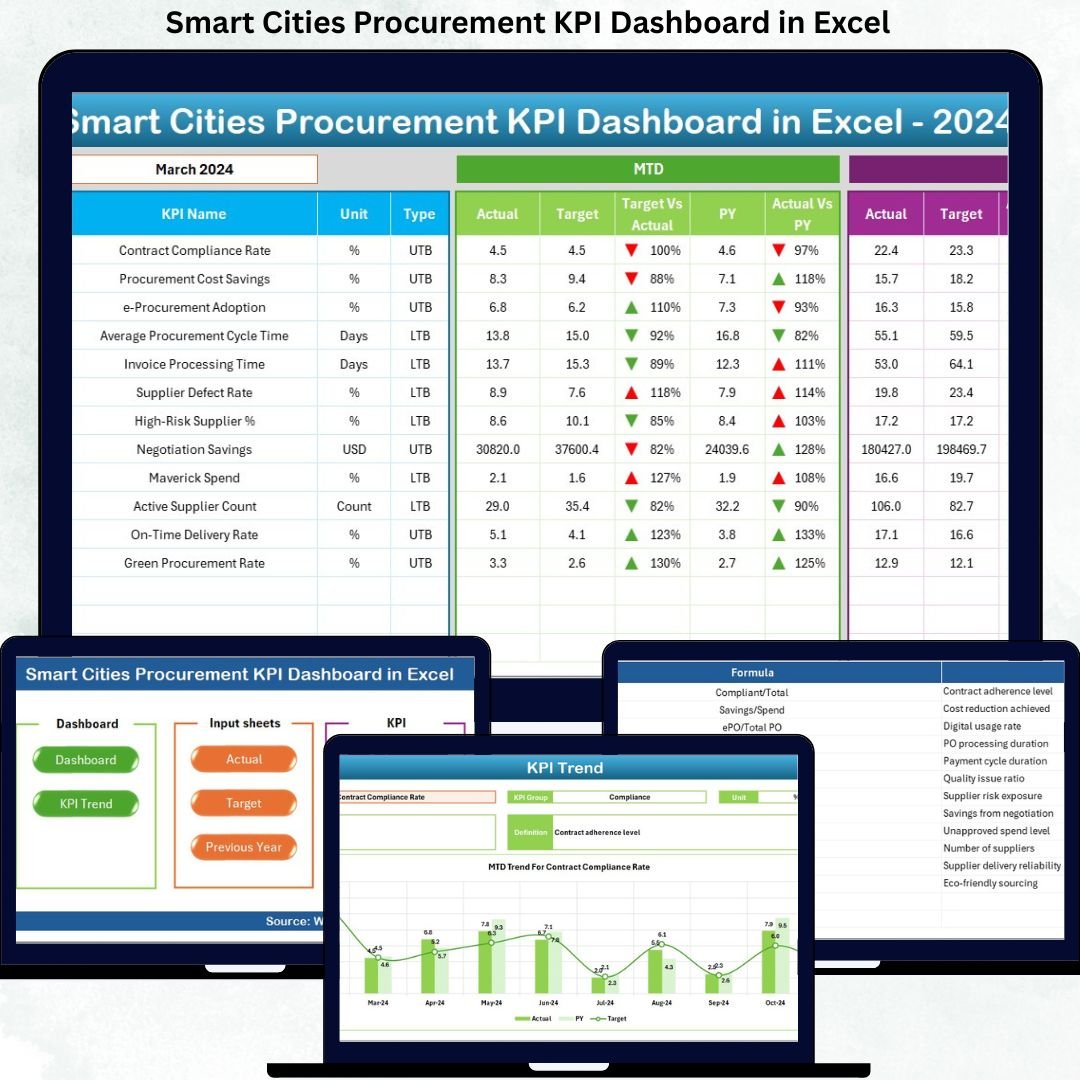
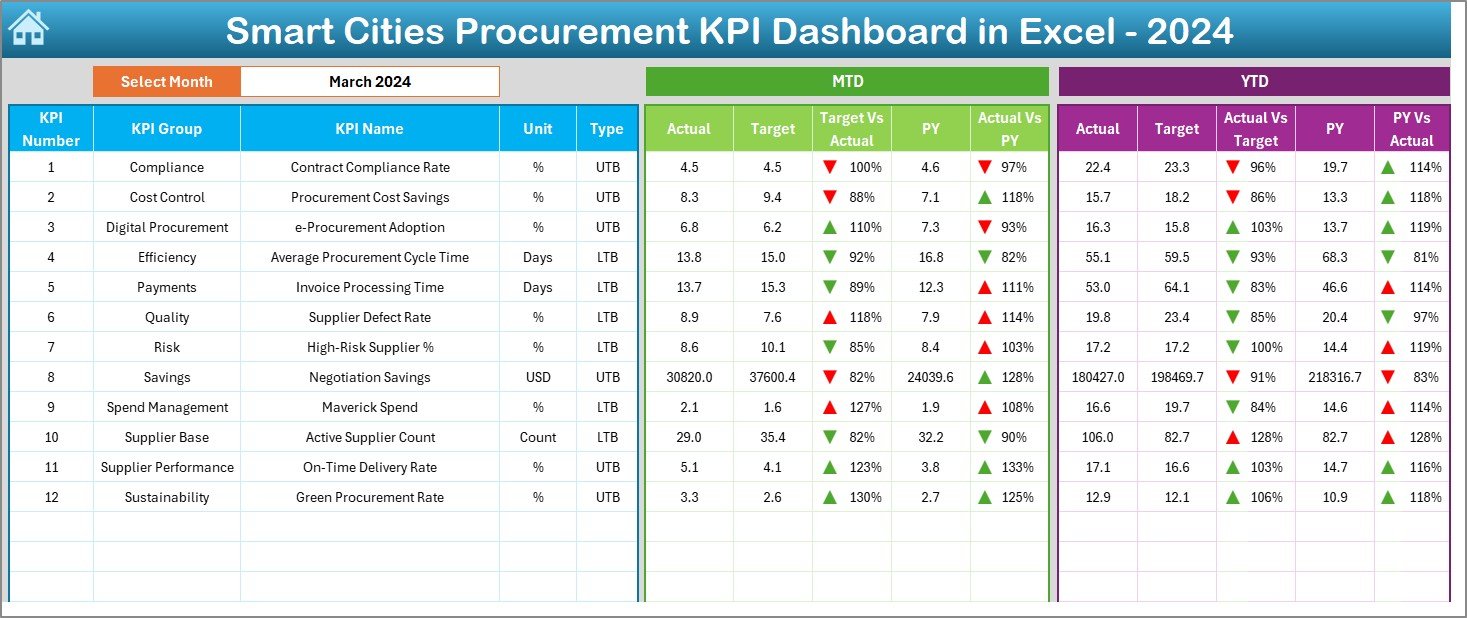
📊 Dashboard Sheet
A complete KPI snapshot displaying MTD and YTD Actuals, Targets, Previous Year values, and variance indicators.
📈 Trend Sheet
Deep KPI analysis with MTD and YTD trend charts, KPI formulas, definitions, and performance type (LTB/UTB).
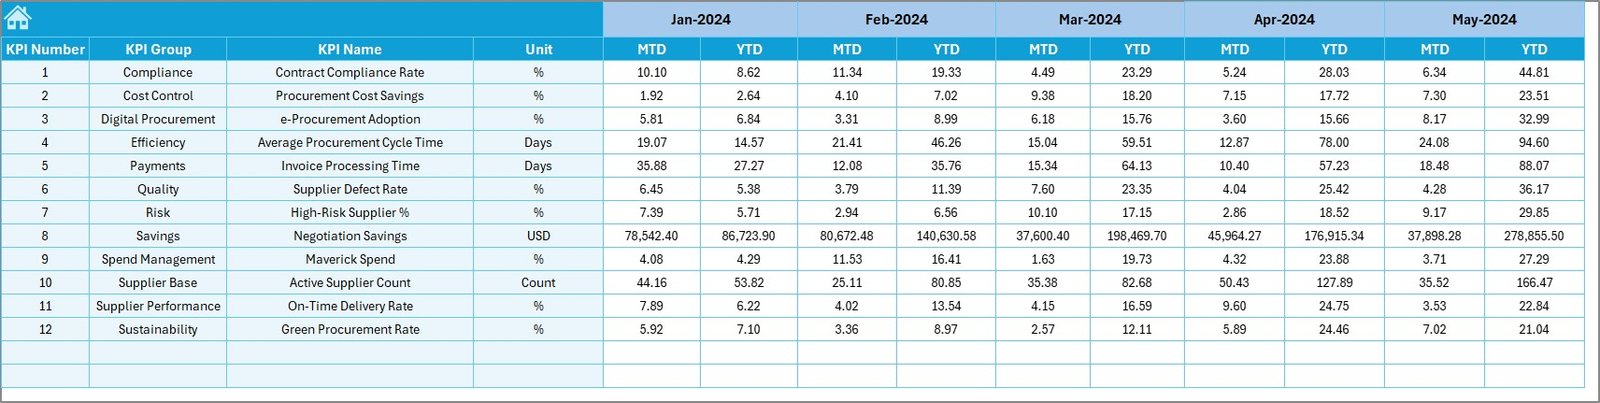
🧮 Actual Numbers Input Sheet
Structured sheet to enter monthly procurement performance data accurately.
🎯 Target Sheet
Dedicated sheet for setting monthly and yearly procurement targets for each KPI.
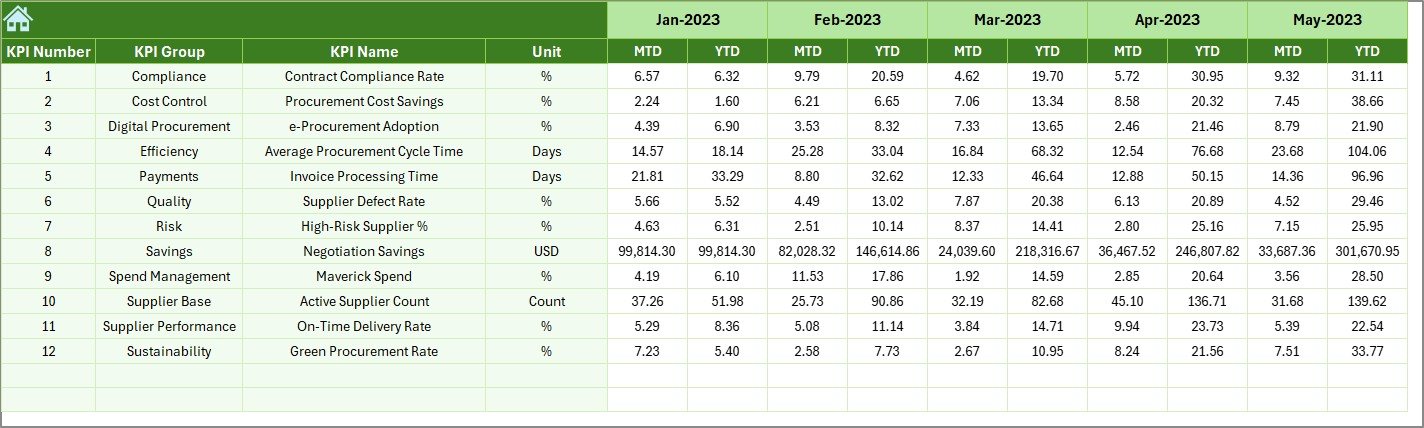
📜 Previous Year Numbers Sheet
Historical data storage to enable year-over-year performance comparison.
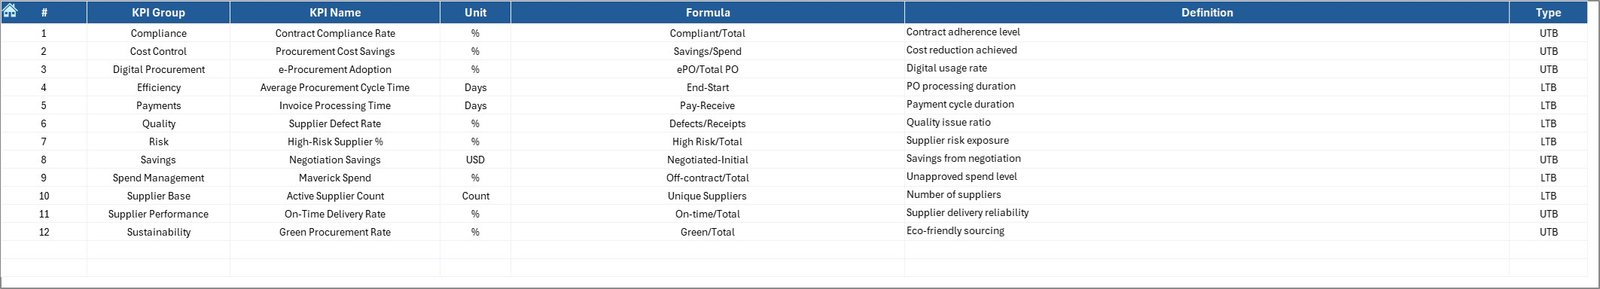
📘 KPI Definition Sheet
Clearly defined KPIs with group, unit, formula, definition, and KPI type for consistency.
🛠️ How to Use the Smart Cities Procurement KPI Dashboard in Excel
1️⃣ Enter monthly procurement actuals in the Actual Numbers sheet
2️⃣ Update targets in the Target sheet
3️⃣ Add last year’s data in the Previous Year sheet
4️⃣ Select the required month from the Dashboard drop-down
5️⃣ Instantly review KPI performance, trends, and variances
No macros. No coding. Just structured Excel intelligence that works instantly.
🎯 Who Can Benefit from This Smart Cities Procurement KPI Dashboard in Excel
🏛️ Government & Urban Development Authorities
📦 Smart City Procurement Managers
📊 Finance & Compliance Teams
📑 Vendor & Contract Management Teams
🏗️ Infrastructure & Utilities Procurement Teams
📈 PMOs handling large public projects
If procurement transparency, cost control, and performance tracking matter to you—this dashboard is built for you.
Click here to read the Detailed Blog Post
Watch the step-by-step video tutorial:
Visit our YouTube channel to learn step-by-step video tutorials
👉 https://youtube.com/@PKAnExcelExpert


Reviews
There are no reviews yet.