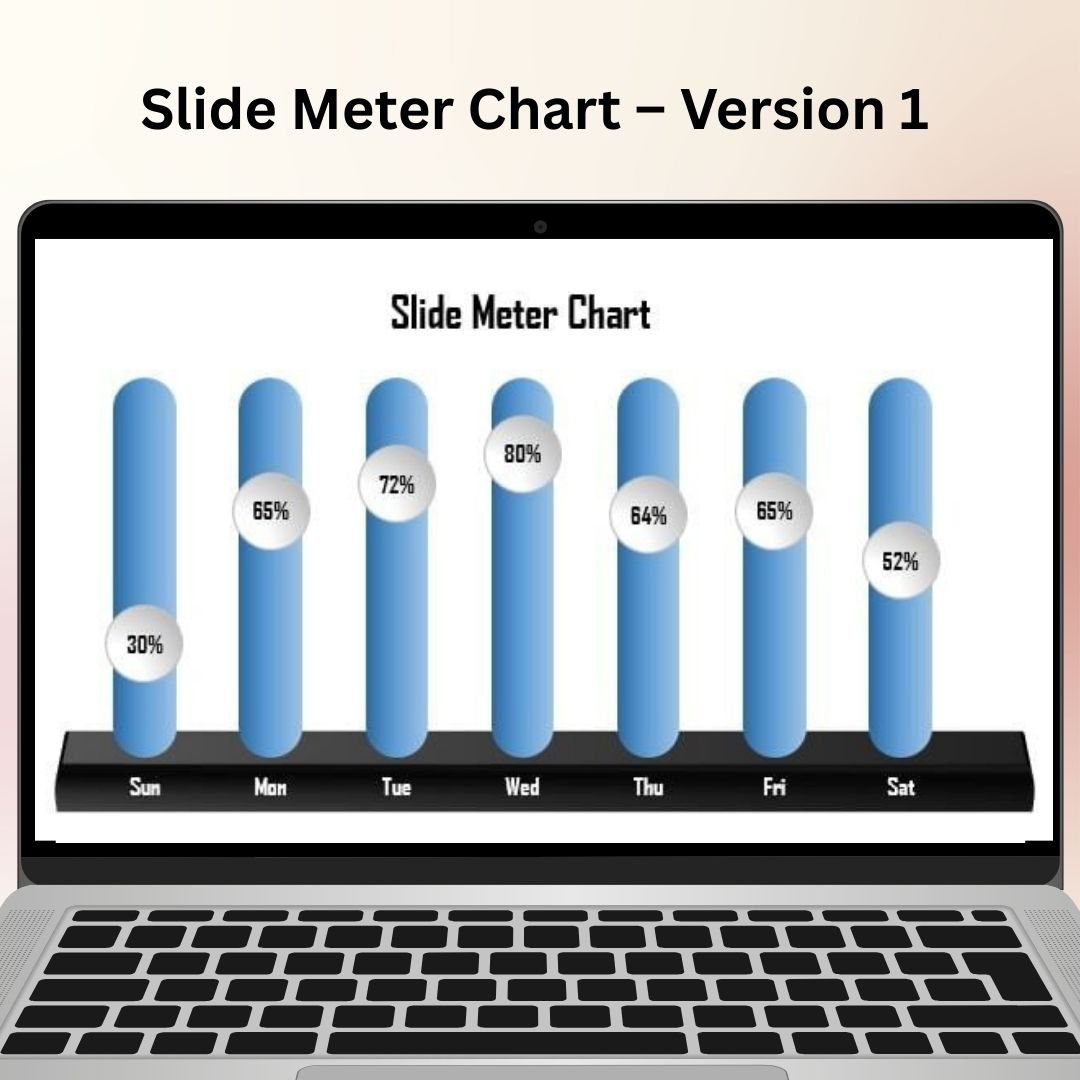
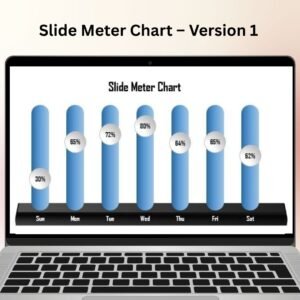
The Slide Meter Chart Version 1 in Excel is an innovative and visually appealing way to display and track performance metrics, progress, and results. This chart provides a dynamic and engaging way to represent data by simulating a slide meter, making it ideal for business reports, performance reviews, and dashboards. Whether you’re tracking sales progress, project milestones, or any other key performance indicator (KPI), this chart offers a clear, interactive, and easy-to-understand visualization of your data.
The Slide Meter Chart Version 1 works by using a sliding scale that visually represents the progress of a specific metric, showing how close you are to reaching your target. This dynamic chart is highly customizable, allowing you to adjust the target, data values, and design to match your specific needs. Perfect for managers, analysts, and anyone looking to present performance data in an engaging way, the Slide Meter Chart Version 1 will enhance your data presentations and improve communication of key metrics.
Key Features of the Slide Meter Chart Version 1
📌 Dynamic and Engaging Design
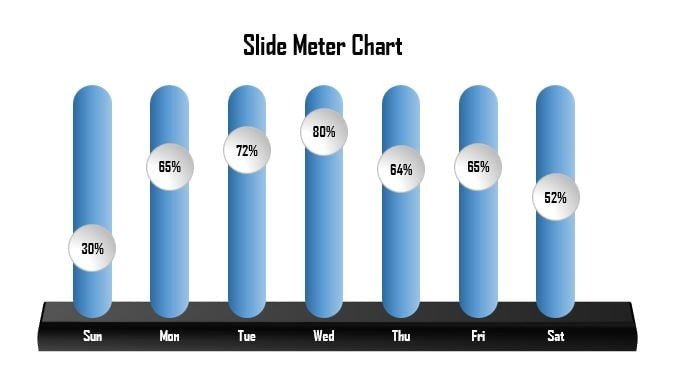
The Slide Meter Chart Version 1 features a visually striking design that simulates a meter, which moves based on the data entered. This unique approach makes it easier for your audience to quickly understand performance and progress.
🛠 Customizable Target and Data Values
The chart allows you to customize both the target and data values, so you can track any performance metric that is important to your business. Whether you’re tracking sales, customer satisfaction, or project completion, you can adjust the chart to reflect your specific needs.
💡 Easy Progress Monitoring
The sliding scale design makes it easy to monitor progress towards your target. As your data changes, the chart automatically adjusts, providing a real-time visual update of how close you are to achieving your goal.
🔢 Real-Time Data Updates
As you input or update your data, the Slide Meter Chart updates automatically, providing real-time feedback on your performance. This ensures that the chart always reflects the most current status of your data.
🚀 Ideal for Dashboards and Reports
This chart is perfect for use in dashboards, performance reviews, and business reports. Its eye-catching design adds visual appeal to your presentations, while also making complex data easy to understand.
📊 Simple to Customize
The Slide Meter Chart Version 1 is designed to be easy to customize and set up. Whether you’re a beginner or an advanced Excel user, you can adjust the chart’s design, color, labels, and data values in just a few simple steps.
⚙ Why You’ll Love the Slide Meter Chart Version 1
✅ Dynamic and Interactive – The sliding scale provides real-time updates as you input new data. ✅ Customizable Design – Tailor the target, data values, and chart appearance to fit your needs. ✅ Easy Progress Tracking – Instantly see how close you are to achieving your target. ✅ Perfect for Reports and Dashboards – Enhance presentations with this visually appealing chart. ✅ User-Friendly Setup – Simple to use and customize, even for beginners.
📂 What’s Inside the Slide Meter Chart Version 1?
- Interactive Slide Meter Design: A dynamic chart that visually represents data progress.
- Customizable Data and Target Values: Adjust the chart to track any performance metric.
- Real-Time Data Updates: The chart updates automatically as you change data.
- Step-by-Step Setup Instructions: Clear instructions for setting up and customizing the chart.
🔍 How to Use the Slide Meter Chart Version 1
1️⃣ Download the Template – Instant access to the Excel file upon purchase. 2️⃣ Enter Your Data – Input your performance data and set your target value. 3️⃣ Customize the Design – Adjust the colors, labels, and appearance to match your style. 4️⃣ Track Progress – Watch the slide meter update as your data changes. 5️⃣ Present and Share – Use the chart in your reports or dashboards to visually communicate performance.
🎯 Who Can Benefit from the Slide Meter Chart Version 1? 🔹 Business Analysts
🔹 Sales Managers
🔹 Project Managers
🔹 Marketing Teams
🔹 Financial Analysts
🔹 Anyone needing to track progress towards performance goals
The Slide Meter Chart Version 1 is an excellent tool for tracking performance, setting goals, and visualizing progress. With its dynamic design and easy customization options, it will help you present your data in an engaging and clear way.
Click here to read the Detailed blog post
https://www.pk-anexcelexpert.com/slide-meter-chart-version-1/
Visit our YouTube channel to learn step-by-step video tutorials
Watch the step-by-step video tutorial:


&url=https://nextgentemplates.com/product/informative-kpi-indicator-chart-version-2/&media=https://nextgentemplates.com/wp-content/uploads/2025/03/Informative-KPI-Indicator-Chart-Version-2-1024x1024.jpg)
&url=https://nextgentemplates.com/product/info-graphics-with-column-chart-part-1/&media=https://nextgentemplates.com/wp-content/uploads/2025/03/Info-graphics-with-Column-chart-Part-1-1024x1024.jpg)
&url=https://nextgentemplates.com/product/informative-kpi-indicator-chart-version-1/&media=https://nextgentemplates.com/wp-content/uploads/2025/03/Informative-KPI-Indicator-Chart-Version-1-1024x1024.jpg)
&url=https://nextgentemplates.com/product/info-graphics-with-column-chart-part-2/&media=https://nextgentemplates.com/wp-content/uploads/2025/03/Info-graphics-with-Column-chart-Part-2-1024x1024.jpg)
Reviews
There are no reviews yet.