


Skill development programs decide the future of a nation’s workforce. However, managing large-scale skill development missions without clear performance tracking leads to delays, inefficiencies, and missed targets. That is why the Skill Development Missions KPI Dashboard in Power BI is designed as a powerful, ready-to-use performance monitoring solution.
This professionally designed Power BI dashboard converts raw skill development data into clear KPIs, interactive visuals, and actionable insights. Instead of struggling with manual Excel reports, you gain instant visibility into performance, trends, and gaps—all in one centralized dashboard.
Built for governments, training institutions, NGOs, and development agencies, this dashboard helps decision-makers move from guesswork to data-driven execution.
🚀 Key Features of Skill Development Missions KPI Dashboard in Power BI
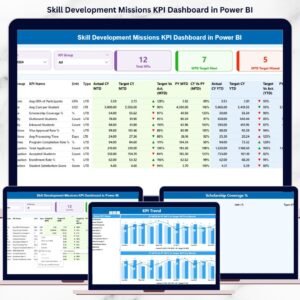
📊 Interactive Summary Dashboard
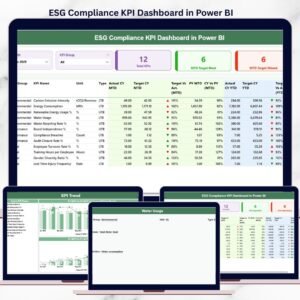
Get an instant overview of mission performance with dynamic KPI cards, slicers, and a detailed KPI table.
🎯 MTD & YTD Performance Tracking
Monitor Month-to-Date and Year-to-Date actuals against targets and previous year values with automatic calculations.
📈 KPI Status Indicators
Green and red arrow icons instantly highlight target achievement and performance gaps.
🔍 Flexible KPI Group & Month Slicers
Analyze performance by KPI category and reporting month without technical complexity.
📉 Trend Analysis with Combo Charts
Track KPI movement over time using MTD and YTD trend charts for deeper insights.
📘 Dedicated KPI Definition Page
Ensure clarity with drill-through access to KPI formulas, definitions, units, and KPI types.
⚡ Excel-Powered Data Input
Simply update Excel sheets—Power BI refreshes everything automatically.
📦 What’s Inside the Skill Development Missions KPI Dashboard in Power BI
🧩 Summary Page
-
Month and KPI Group slicers
-
Total KPIs count card
-
MTD Target Meet count
-
MTD Target Missed count
-
Detailed KPI table with MTD & YTD metrics
📊 KPI Trend Page
-
MTD Actual vs Target vs Previous Year chart
-
YTD Actual vs Target vs Previous Year chart
-
KPI selection slicer for focused analysis
📘 KPI Definition Page
-
KPI Formula
-
KPI Definition
-
Unit of Measurement
-
KPI Type (LTB / UTB)
📂 Excel Data Source Files
-
Input_Actual sheet
-
Input_Target sheet
-
KPI Definition sheet
🛠️ How to Use the Skill Development Missions KPI Dashboard in Power BI
1️⃣ Enter actual KPI values in the Input_Actual Excel sheet
2️⃣ Define monthly and yearly targets in the Input_Target sheet
3️⃣ Maintain KPI clarity using the KPI Definition sheet
4️⃣ Refresh the Power BI file
5️⃣ Instantly analyze performance using slicers, tables, and charts
No advanced Power BI skills required. This dashboard is ready to use from day one.
🎯 Who Can Benefit from This Skill Development Missions KPI Dashboard
🏛️ Government Skill Development Departments
🎓 Training & Vocational Institutes
🤝 NGOs & Development Agencies
📊 Program Managers & Policy Planners
📈 Monitoring & Evaluation Teams
📑 Data Analysts & MIS Professionals
If your organization manages skill development programs, this dashboard becomes a mission-critical performance tool.
Click here to read the Detailed Blog Post
Watch the step-by-step video tutorial:


Reviews
There are no reviews yet.