
The Shipping Port KPI Dashboard in Excel is a vital tool for port operators, logistics managers, and business owners who need to monitor and optimize the performance of their shipping ports. This Excel-based dashboard helps track key performance indicators (KPIs) such as cargo volume, container throughput, ship arrivals, turnaround times, and operational costs, allowing you to optimize port operations and ensure efficient logistics management.
With real-time tracking, customizable charts, and detailed reporting features, this dashboard offers actionable insights into port efficiency, helping you reduce bottlenecks, improve operational flow, and enhance overall service quality at your port.

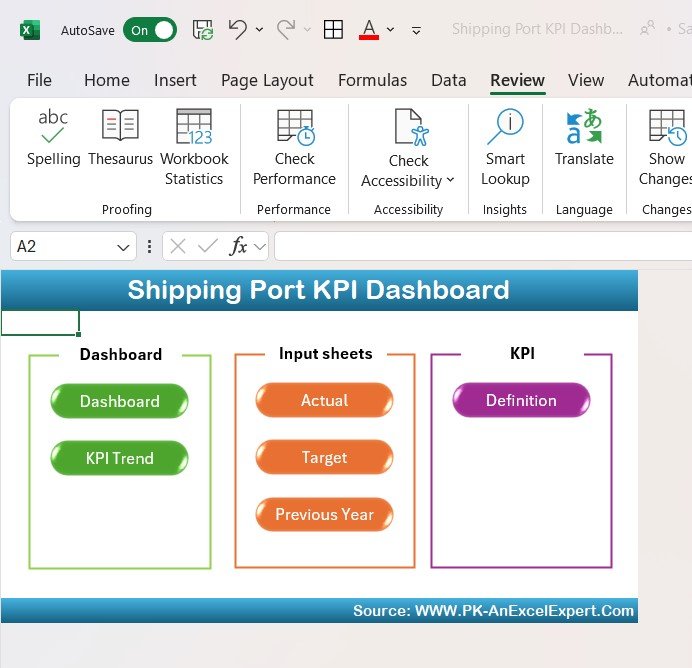
Key Features of the Shipping Port KPI Dashboard in Excel:
🚢 Cargo Volume and Throughput Tracking
Monitor cargo volume, container throughput, and overall handling performance to track the capacity utilization of the port and optimize operations.
⏱ Turnaround Time Monitoring
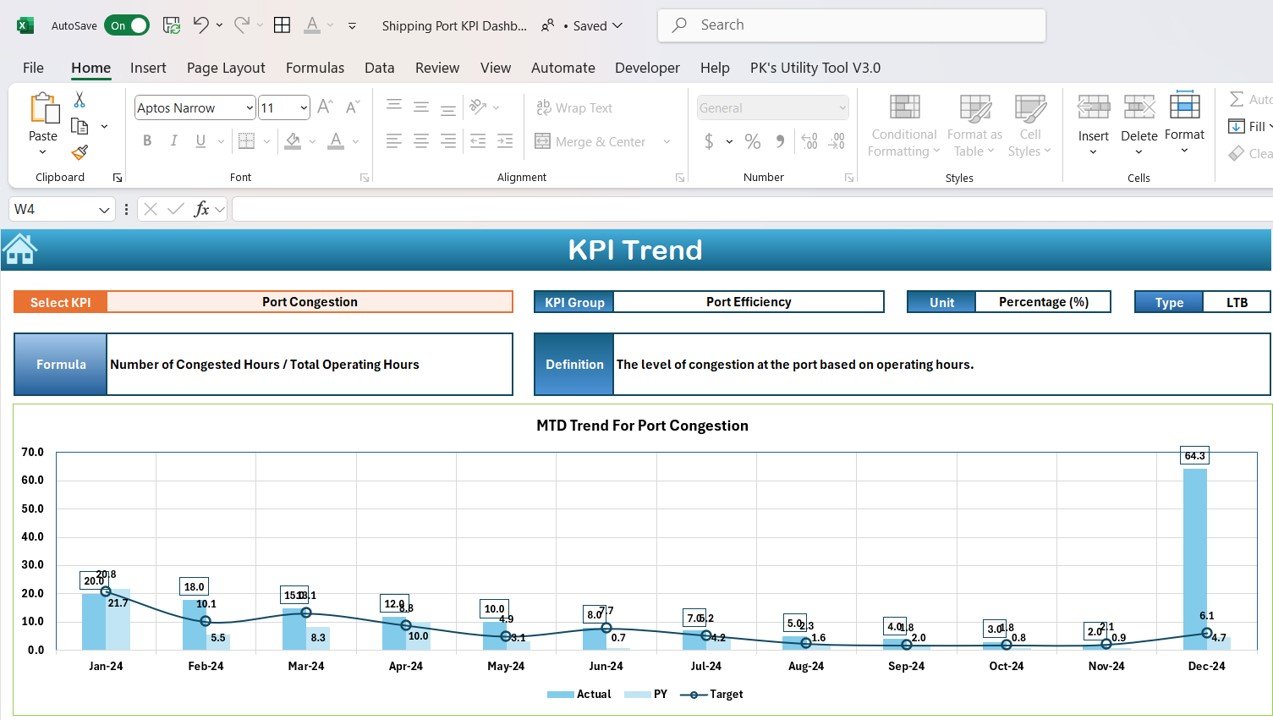
Track the turnaround time for vessels to improve port efficiency, reduce delays, and optimize berth scheduling.
📉 Ship Arrival and Departure Tracking
Monitor ship arrivals, departures, and schedules to ensure timely loading, unloading, and port turnaround.
💰 Cost and Revenue Analysis
Track operational costs, port fees, and revenue from cargo handling to evaluate financial performance and profitability.
⚙️ Operational Efficiency
Measure key operational factors such as crane productivity, dock utilization, and workforce performance to optimize port processes and minimize delays.
🚀 Why You’ll Love the Shipping Port KPI Dashboard in Excel:
✅ Monitor Port Performance – Track essential KPIs like cargo volume, ship arrival times, and turnaround efficiency to optimize your port’s operations.
✅ Optimize Operational Efficiency – Track turnaround times, cargo handling rates, and berth utilization to reduce delays and improve port throughput.
✅ Enhance Cost Efficiency – Analyze operational costs, port fees, and revenue to ensure that your port remains financially sustainable and profitable.
✅ Improve Shipping Operations – Monitor ship schedules, vessel arrivals, and departures to ensure timely operations and effective logistics management.
✅ Customizable and Easy-to-Use – This Excel dashboard is simple to navigate, with customizable options to suit your specific shipping port performance tracking needs.
✅ Data-Driven Decisions – Use real-time data and insights to make informed decisions about port operations, workforce allocation, and equipment usage.
What’s Inside the Shipping Port KPI Dashboard in Excel:
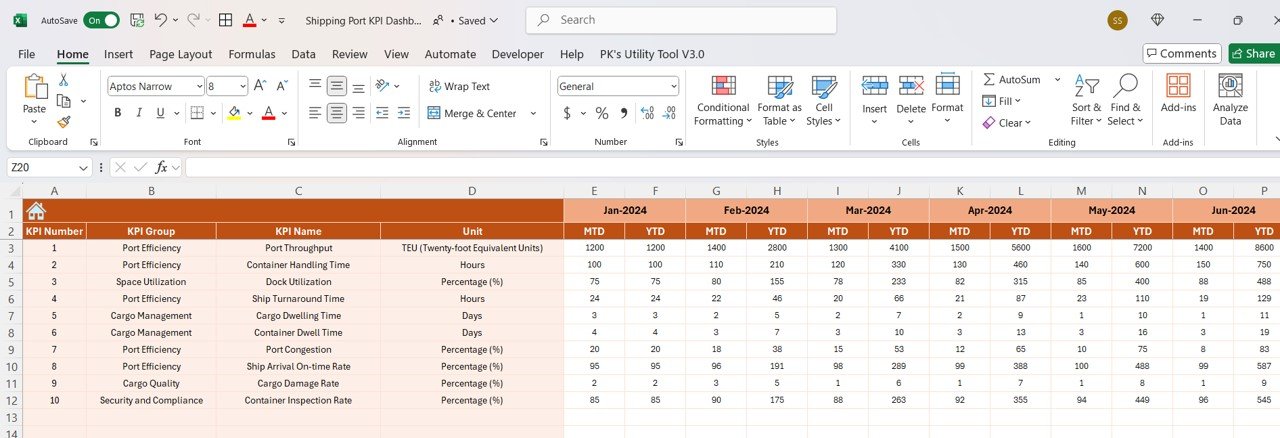
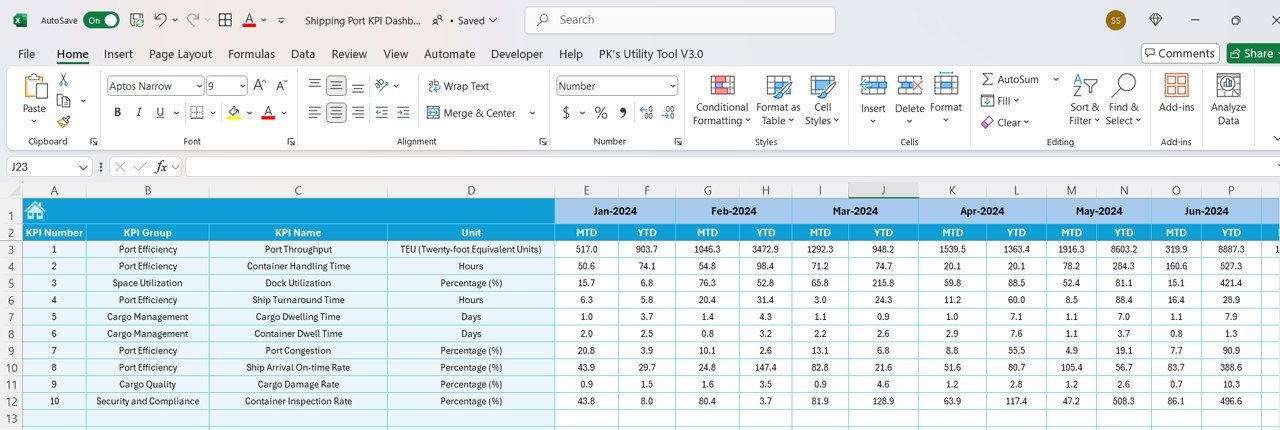
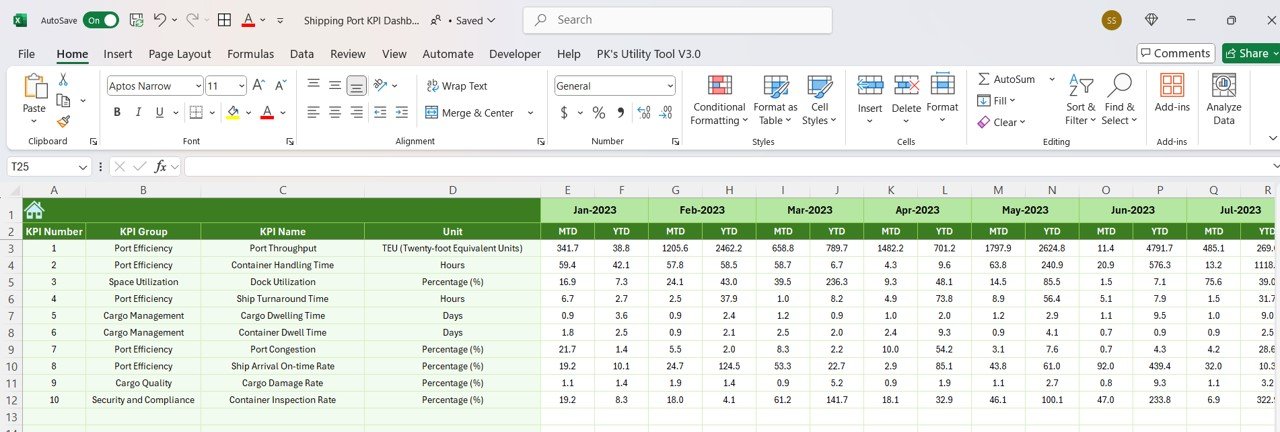
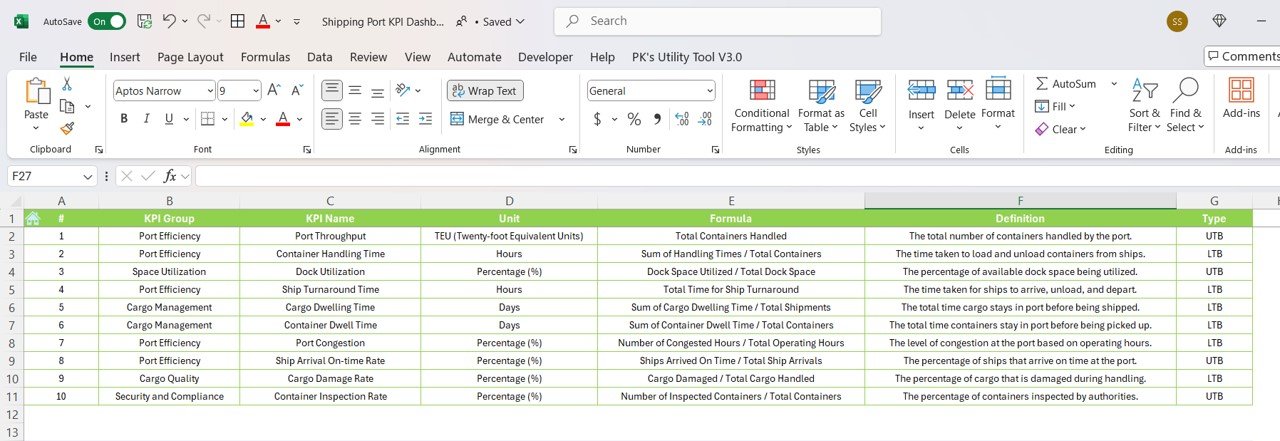
- Cargo Volume Tracking: Monitor the total cargo handled and container throughput to measure port capacity and identify opportunities to improve efficiency.
- Turnaround Time Metrics: Track the time it takes for ships to complete their unloading and loading process to minimize port delays.
- Ship Arrival and Departure Monitoring: Track ship arrivals, departures, and scheduling to ensure on-time shipping and unloading.
- Cost and Revenue Tracking: Track costs associated with port operations, such as fees, maintenance, and labor, alongside revenue from cargo handling.
- Operational Efficiency Tracking: Monitor key performance metrics such as crane productivity and dock utilization to ensure effective use of port resources.
- Custom Reports: Generate tailored reports to share with management, clients, or stakeholders, providing clear insights into the port’s performance.
How to Use the Shipping Port KPI Dashboard in Excel:
1️⃣ Download the Template – Instantly access your Excel file upon purchase.
2️⃣ Enter Port Data – Input data such as cargo volume, vessel arrival times, turnaround times, and operational costs into the dashboard.
3️⃣ Track Key Metrics – Monitor important KPIs such as cargo throughput, ship turnaround times, and dock utilization in real-time.
4️⃣ Analyze Trends – Use interactive charts and graphs to analyze port performance over time and identify areas for operational improvement.
5️⃣ Generate Reports – Create custom reports to present port performance data to stakeholders, clients, or regulatory authorities.
Who Can Benefit from the Shipping Port KPI Dashboard in Excel:
- Port Operators
- Logistics Managers
- Shipping Companies
- Port Authorities
- Operations Managers
- Business Owners in Shipping and Transport
- Supply Chain Analysts
- Financial Analysts in Port Operations
The Shipping Port KPI Dashboard in Excel is the perfect solution for optimizing port operations, reducing operational costs, and improving efficiency. It helps you monitor key performance indicators, enhance resource utilization, and ensure your port remains competitive and profitable.
Click here to read the Detailed blog post
https://www.pk-anexcelexpert.com/shipping-port-kpi-dashboard-in-excel/
Visit our YouTube channel to learn step-by-step video tutorials
Youtube.com/@PKAnExcelExpert


Reviews
There are no reviews yet.