

The Scientific Research KPI Dashboard in Excel is an essential tool for research managers, scientists, and academic institutions who need to monitor and evaluate the progress of scientific research projects. This Excel-based dashboard allows you to track key performance indicators (KPIs) such as research productivity, grant funding, project timelines, publication output, and research collaboration, ensuring that your research goals are met efficiently and effectively.
With easy-to-use features, customizable metrics, and real-time data tracking, this dashboard helps you optimize research operations, improve collaboration, and assess the performance of your research teams.

Key Features of the Scientific Research KPI Dashboard in Excel:
🔬 Research Productivity Tracking
Track the number of completed experiments, research papers, and projects to monitor productivity and ensure that research targets are being met.
💰 Grant Funding Monitoring
Track research funding, including grants received and utilized, to ensure that your research programs are financially supported and sustainable.
📅 Project Timeline and Milestone Tracking
Monitor project timelines, milestones, and deadlines to ensure that research projects are completed on schedule.
📊 Publication Output Monitoring
Track the number of research papers published, citations received, and the impact factor of journals, ensuring that your research is making a significant impact.
🤝 Collaboration and Partnerships Tracking
Monitor research collaborations, partnerships, and joint research initiatives with other institutions or industries to enhance the scope of your research efforts.
🚀 Why You’ll Love the Scientific Research KPI Dashboard in Excel:
✅ Track Research Productivity – Monitor research outputs such as papers, experiments, and publications to ensure that your research team is progressing as expected.
✅ Monitor Grant Funding – Track how much funding has been secured and utilized for each project, ensuring that financial resources are being effectively managed.
✅ Optimize Project Timelines – Track research project timelines and milestones to keep projects on track and ensure timely completion.
✅ Assess Publication Impact – Monitor your research team’s publication outputs and impact, ensuring that your research is contributing to the scientific community.
✅ Enhance Collaboration – Track the progress and impact of research collaborations, improving partnerships and broadening the scope of research.
✅ Customizable and Easy-to-Use – This Excel dashboard is simple to use and can be fully customized to meet the specific needs of your scientific research initiatives.
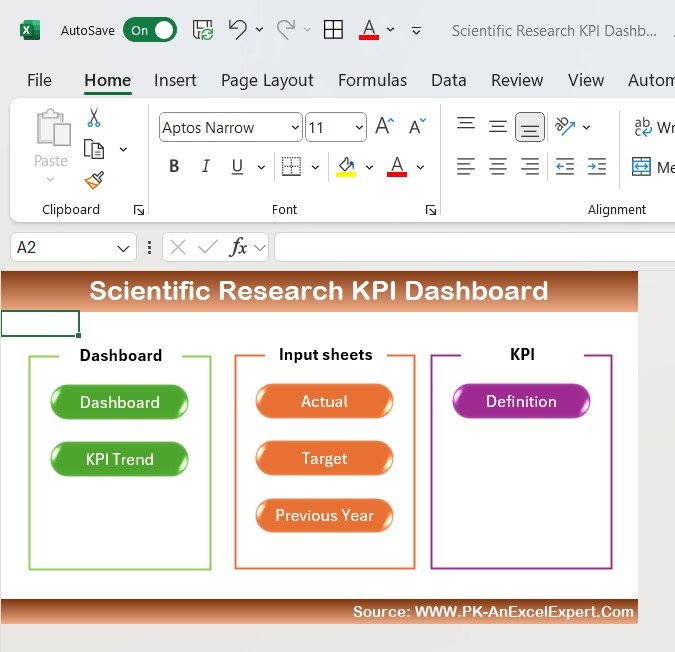
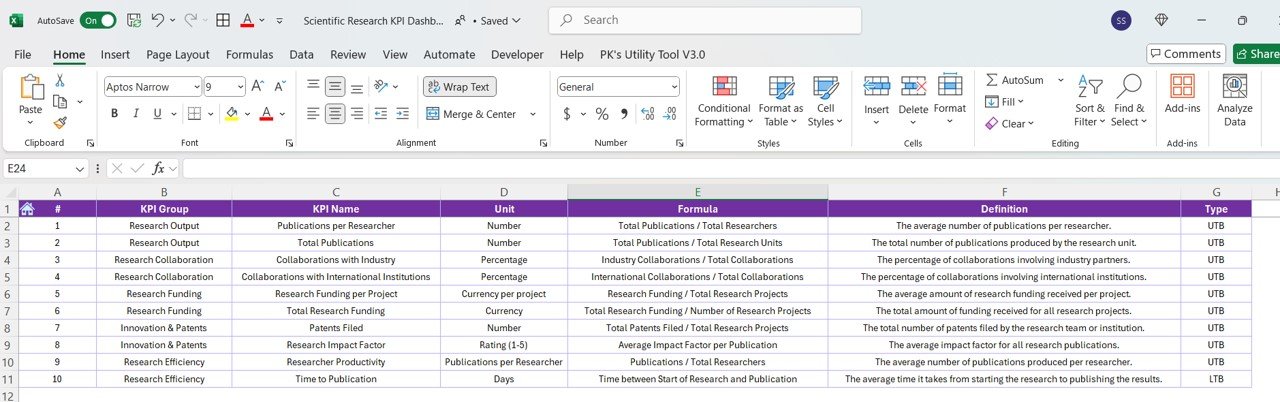
What’s Inside the Scientific Research KPI Dashboard in Excel:
- Research Productivity Tracking: Monitor the number of completed experiments, research papers, and projects to assess productivity and research output.
- Grant Funding: Track grants received and the financial status of research projects to ensure they are adequately funded.
- Project Milestone Tracking: Keep track of key project milestones, timelines, and deadlines to ensure research projects stay on schedule.
- Publication and Citation Tracking: Measure the number of research papers published, the impact factor of journals, and citations to evaluate the impact of your research.
- Collaboration Monitoring: Track collaborative research efforts, partnerships, and joint initiatives with other institutions or organizations.
- Custom Reports: Generate detailed, customizable reports that summarize research progress, funding usage, and publication outputs for stakeholders and management.
How to Use the Scientific Research KPI Dashboard in Excel:
1️⃣ Download the Template – Instantly access your Excel file upon purchase.
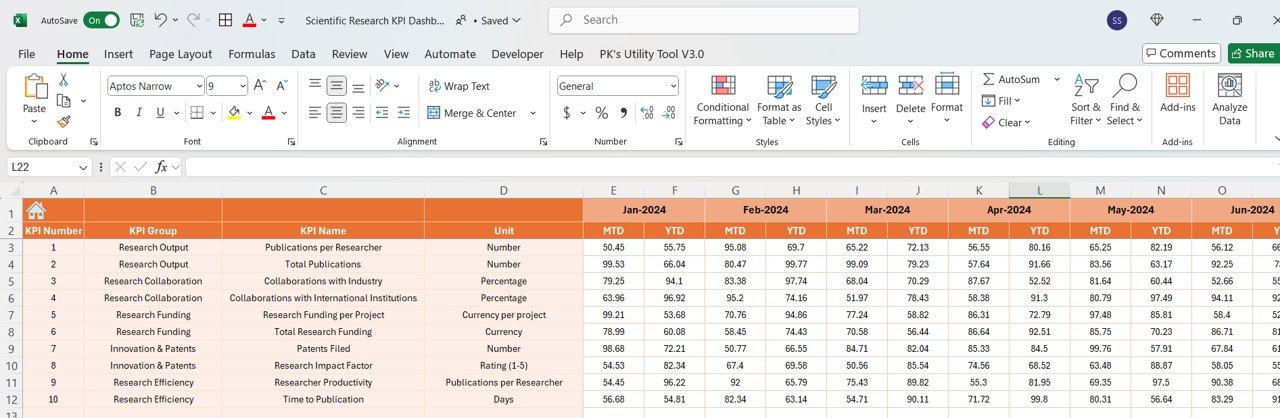
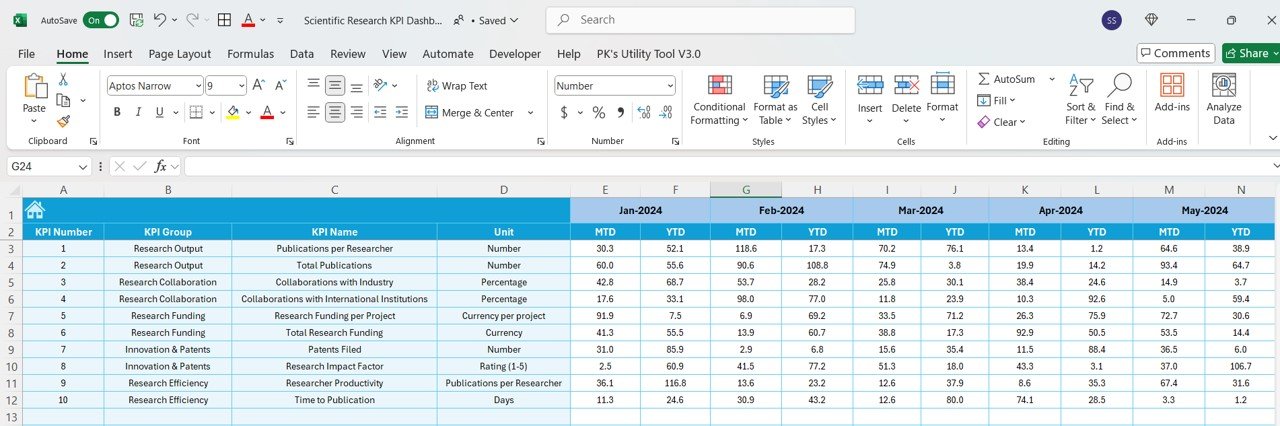
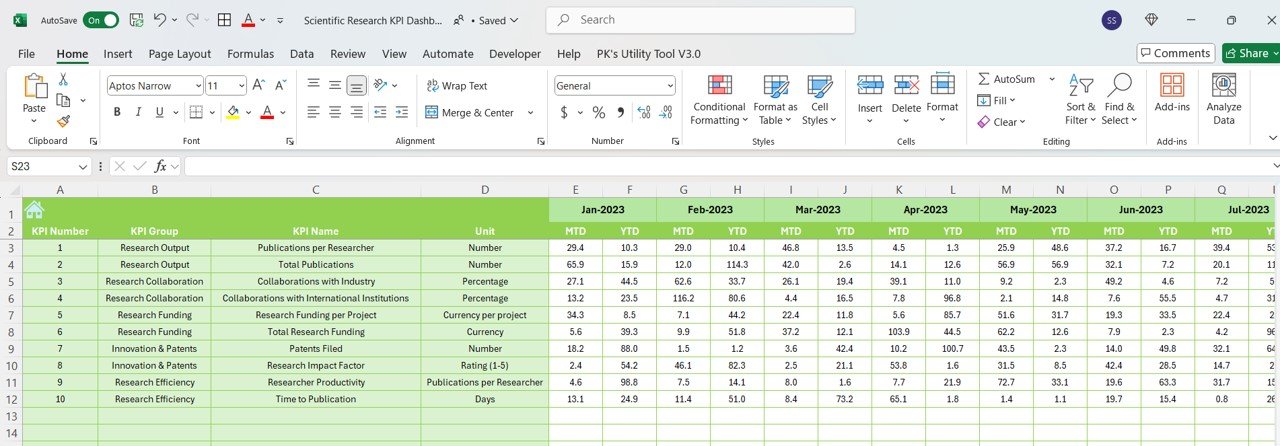
2️⃣ Input Research Data – Enter details about research projects, publications, funding, and collaborations into the dashboard.
3️⃣ Track Key Metrics – Monitor KPIs such as research productivity, grant usage, publication impact, and project milestones in real-time.
4️⃣ Analyze Trends – Use interactive charts to analyze trends in research progress, funding, and publication output.
5️⃣ Generate Reports – Create customized reports to share insights with research teams, stakeholders, or funding agencies.
Who Can Benefit from the Scientific Research KPI Dashboard in Excel:
- Research Managers
- Academic Institutions
- Scientists and Research Teams
- Research Directors
- Grant and Funding Managers
- Collaboration Managers
- Data Analysts in Research
- Project Managers in Research Fields
The Scientific Research KPI Dashboard in Excel is the perfect tool for monitoring the performance of scientific research projects, managing funding, and improving research outputs. Whether you are in a university setting, a private research organization, or a government-funded program, this dashboard helps ensure that your research efforts are on track, financially supported, and making a significant impact.
Click here to read the Detailed blog post
https://www.pk-anexcelexpert.com/scientific-research-kpi-dashboard-in-excel/
Visit our YouTube channel to learn step-by-step video tutorials
Youtube.com/@PKAnExcelExpert


Reviews
There are no reviews yet.