In the fast-paced corporate world, keeping track of workplace safety and compliance isn’t optional—it’s essential. But what if you could monitor everything from incident reports to department-wise compliance trends—all in one place?Safety and Compliance Dashboard in Excel
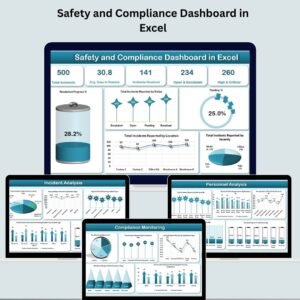
🚨 Introducing the Safety and Compliance Dashboard in Excel—a powerful, ready-to-use template that puts data-driven safety management right at your fingertips. Built entirely in Microsoft Excel, this dashboard offers a crystal-clear view of safety incidents, resolution progress, compliance performance, and team accountability—without needing any coding or BI tools.Safety and Compliance Dashboard in Excel
Whether you’re a safety officer, HR professional, compliance manager, or operations lead, this dashboard is your go-to solution for improving workplace safety and driving performance with real-time insights.Safety and Compliance Dashboard in Excel

✨ Key Features of Safety and Compliance Dashboard in Excel
This dynamic Excel dashboard comes with multiple tabs designed for visibility, tracking, and action:
✅ Overview Sheet
Your control tower for safety performance. It displays:
-
Total Incidents Reported
-
Resolved & Pending Cases
-
Escalation Summary
-
High & Critical Cases
-
Average Resolution Days
Plus, visual charts like: -
📊 Incidents by Status, Location, and Severity
-
📈 Progress Trends and Open Case Ratios
🔍 Incident Analysis Sheet
Break down every type of incident to identify trends:
-
Total Incidents by Type
-
Time to Resolve per Type
-
Resolution Rate per Incident Type
-
High vs Low Severity Breakdown
🧩 Compliance Monitoring Sheet
Track safety policy adherence across departments:
-
Department-Wise Compliance
-
Resolution Time per Compliance Type
-
Compliance-Based Incident Analysis
-
📉 Progress % for each compliance metric
👥 Personnel Analysis Sheet
Who’s performing well? Who needs coaching?
-
Incidents Assigned per Employee
-
Avg. Resolution Time by Person
-
Progress & Performance per Resolver
📅 Monthly Trends Sheet
Stay ahead with time-based analysis:
-
Incidents by Month
-
Resolution & Pending Trends
-
Average Days to Resolve Over Time
📥 Data Sheet
Manual input sheet for all incident logs:
-
Includes fields for Incident Type, Date, Department, Severity, Status, and more
-
🔄 Auto-refreshes all visuals instantly
📦 What’s Inside the Safety and Compliance Dashboard?
When you download the product, you get:
-
✔ A professionally formatted Excel file
-
✔ Prebuilt pivot tables and formulas
-
✔ All charts and visuals auto-linked to your data
-
✔ Dropdowns for quick entry
-
✔ Color-coded insights (Red = risk, Green = good)
-
✔ Easy customization options
No plugins. No macros. Just plug in your data—and go!
🛠️ How to Use the Safety and Compliance Dashboard
-
Open the Excel file and go to the
Data Sheettab. -
Enter your incident data including dates, types, severity, and status.
-
Instantly view updates on the Overview and analysis sheets.
-
Filter by location, person, or department as needed.
-
Share or export the file as PDF or PowerPoint for reporting.
💡 Pro Tip: Update the data weekly to keep everyone informed and accountable!
👥 Who Can Benefit from This Dashboard?
This dashboard is designed for:
-
🏭 Manufacturing units
-
🏥 Healthcare organizations
-
🏫 Schools and universities
-
🧑🔧 Safety and compliance teams
-
👩💼 HR and administration managers
-
🧑⚖️ Audit and inspection coordinators
Basically—any workplace that needs to track, resolve, and report safety incidents with accuracy and speed.
🔗 Click here to read the Detailed blog post
🎥 Visit our YouTube channel to learn step-by-step video tutorials















Reviews
There are no reviews yet.