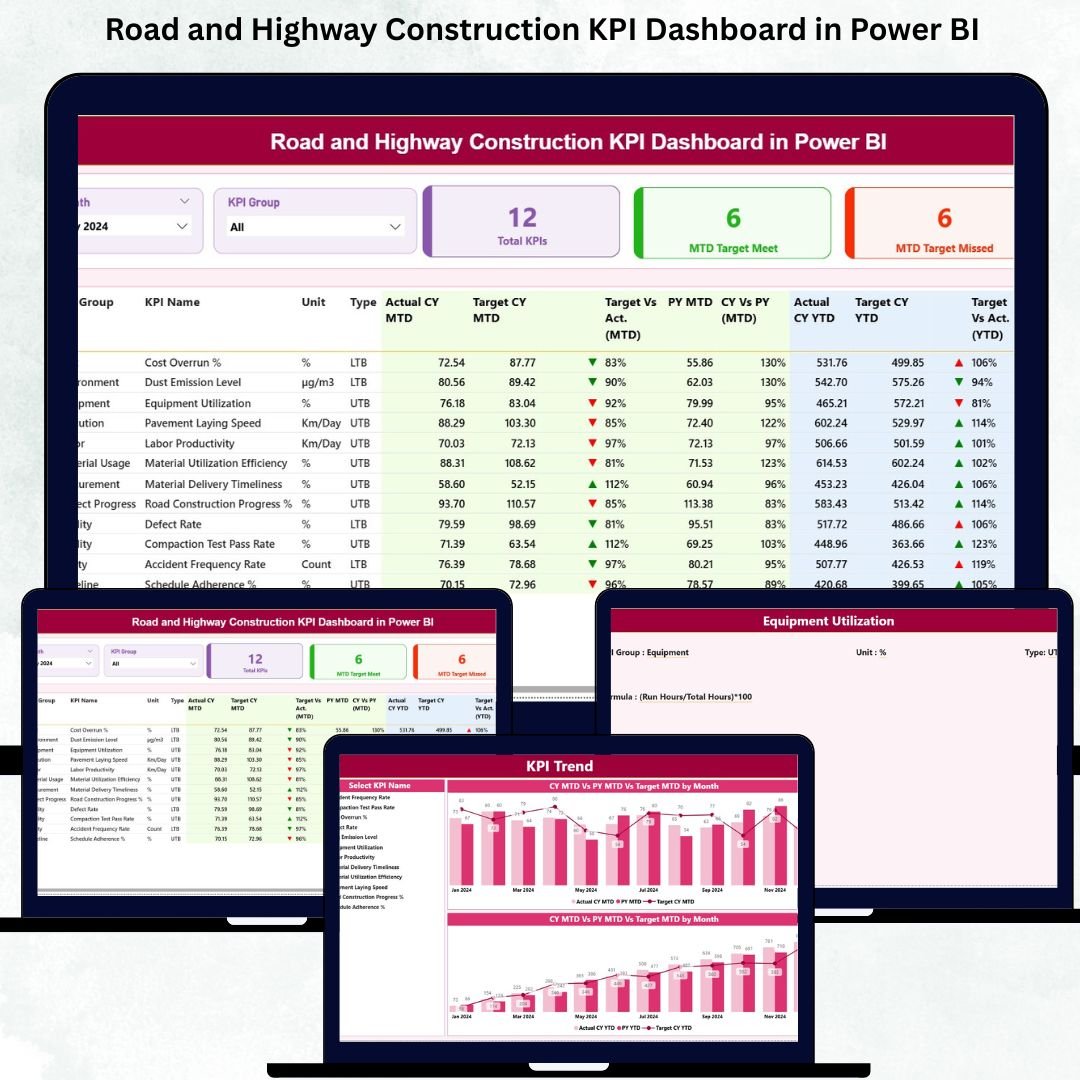
Road and Highway Construction KPI Dashboard in Power BI Managing Road and highway construction projects requires deep visibility, timely reporting, and accurate performance tracking. Every project involves multiple teams, heavy machinery, contractors, material usage, weather impacts, safety standards, and strict timelines. Because so many moving parts are involved, even a small reporting delay can affect budgets, schedules, and compliance.
This is exactly why the Road and Highway Construction KPI Dashboard in Power BI is a game-changer. Road and Highway Construction KPI Dashboard in Power BI It centralizes all major KPIs, turns complex data into simple visuals, and gives you real-time insights to help your project run smoothly. Road and Highway Construction KPI Dashboard in Power BI Whether you’re monitoring progress, safety, quality, or contractor productivity, this dashboard delivers a complete, structured, and dynamic view of your performance—without manual reporting.
Road and Highway Construction KPI Dashboard in Power BI Built with Power BI and connected to a clean Excel dataset, this dashboard helps project managers, contractors, government authorities, and construction leaders make fast and confident decisions. Update your Excel sheets → Refresh Power BI → Get instant performance insights.
Let’s explore what this powerful product offers 👇
✨ Key Features of the Road and Highway Construction KPI Dashboard in Power BI
🚧 Complete Construction KPI Monitoring
Track daily progress, productivity, machinery usage, safety indicators, material consumption, quality scores, and more—all in one dashboard.
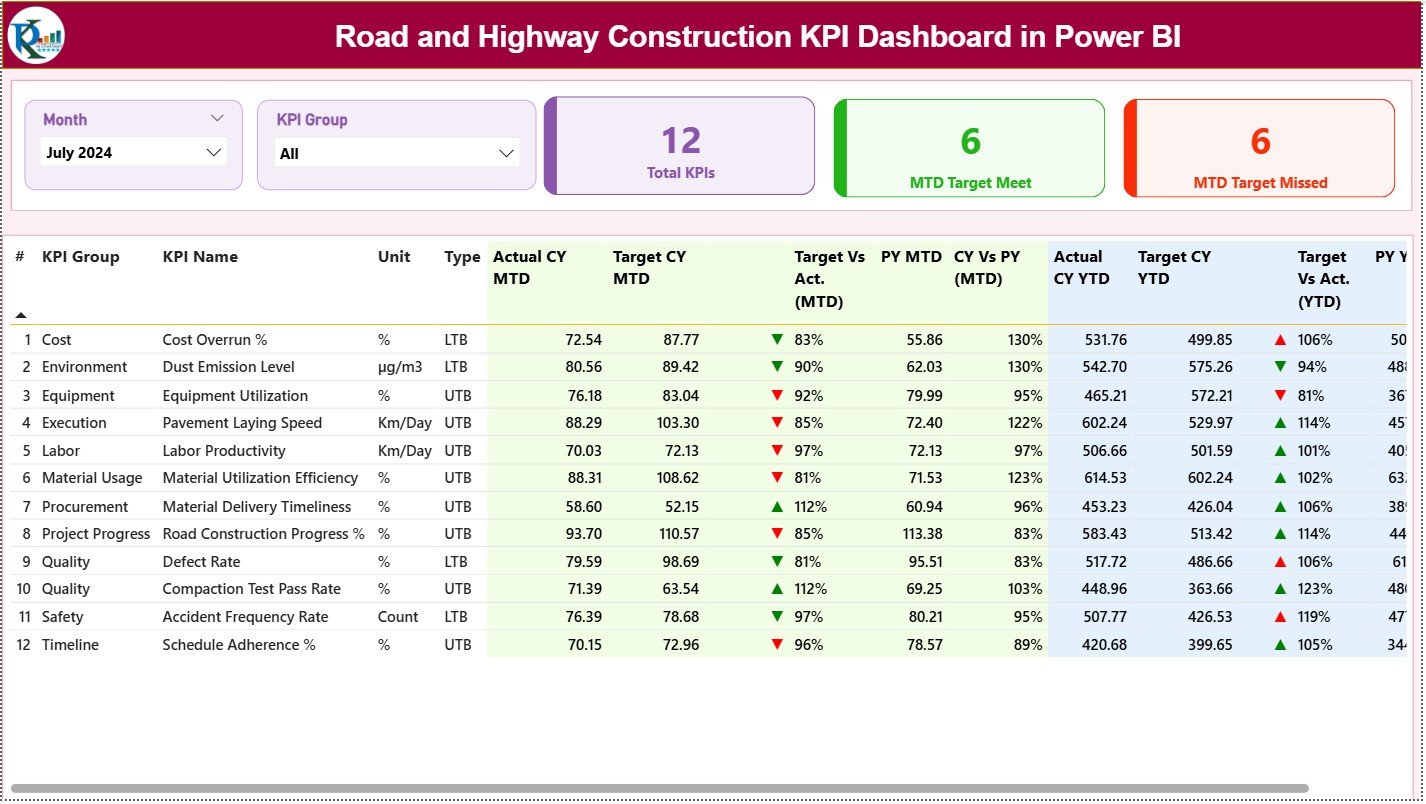
🎯 Smart Filters for Quick Review
Use Month and KPI Group slicers to instantly filter KPIs by Progress, Safety, Contractors, Quality, Cost, or Productivity.
📊 MTD & YTD Visual Performance
See Actual Vs Target values for both Month-to-Date and Year-to-Date with automated percentage calculations.
🟢🔴 Target Icons for Instant Clarity
Green ▲ = Target Met
Red ▼ = Target Missed
Quickly understand which KPIs need attention.
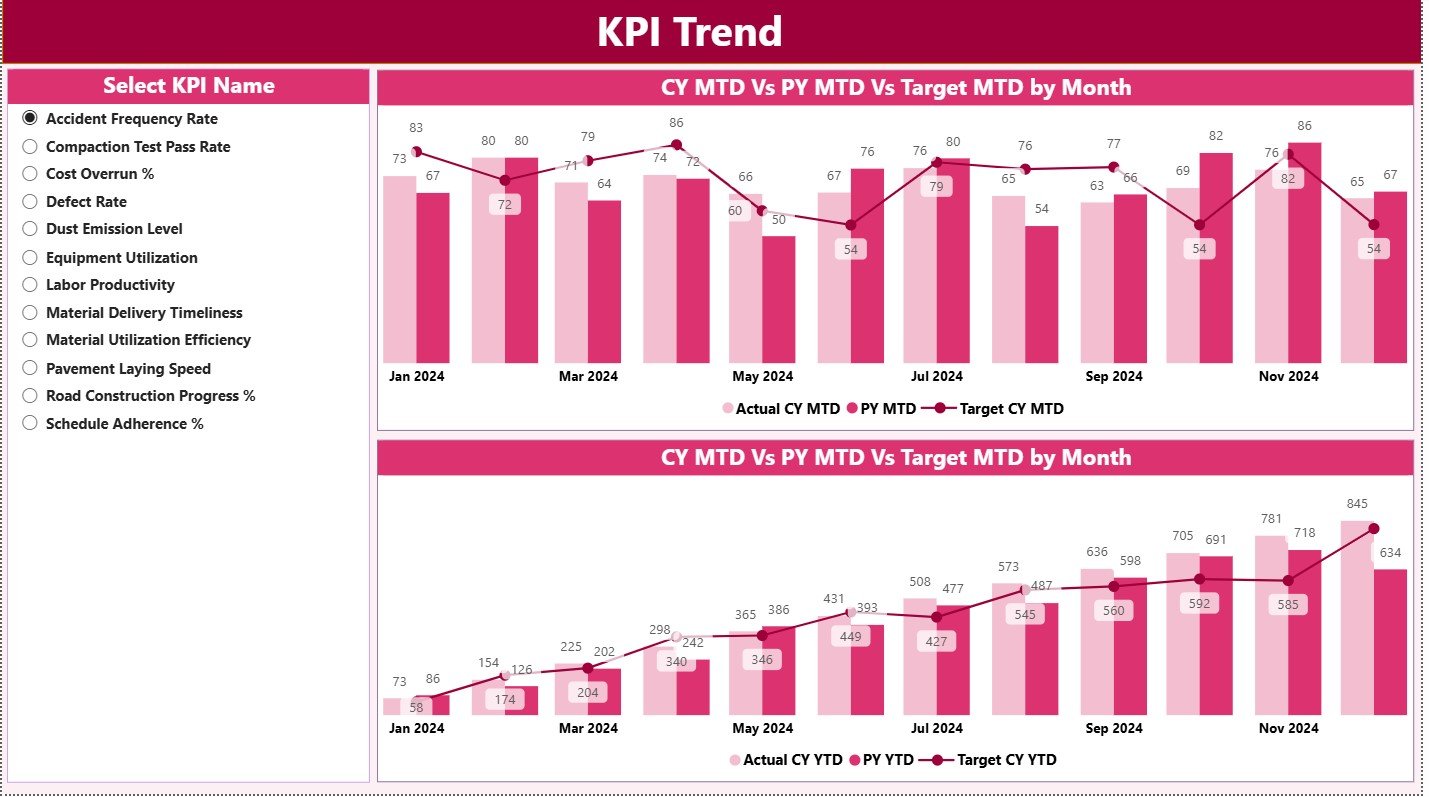
📈 Trend Analysis for Smarter Decisions
Combo charts for MTD and YTD help you compare CY vs PY performance and identify progress patterns.
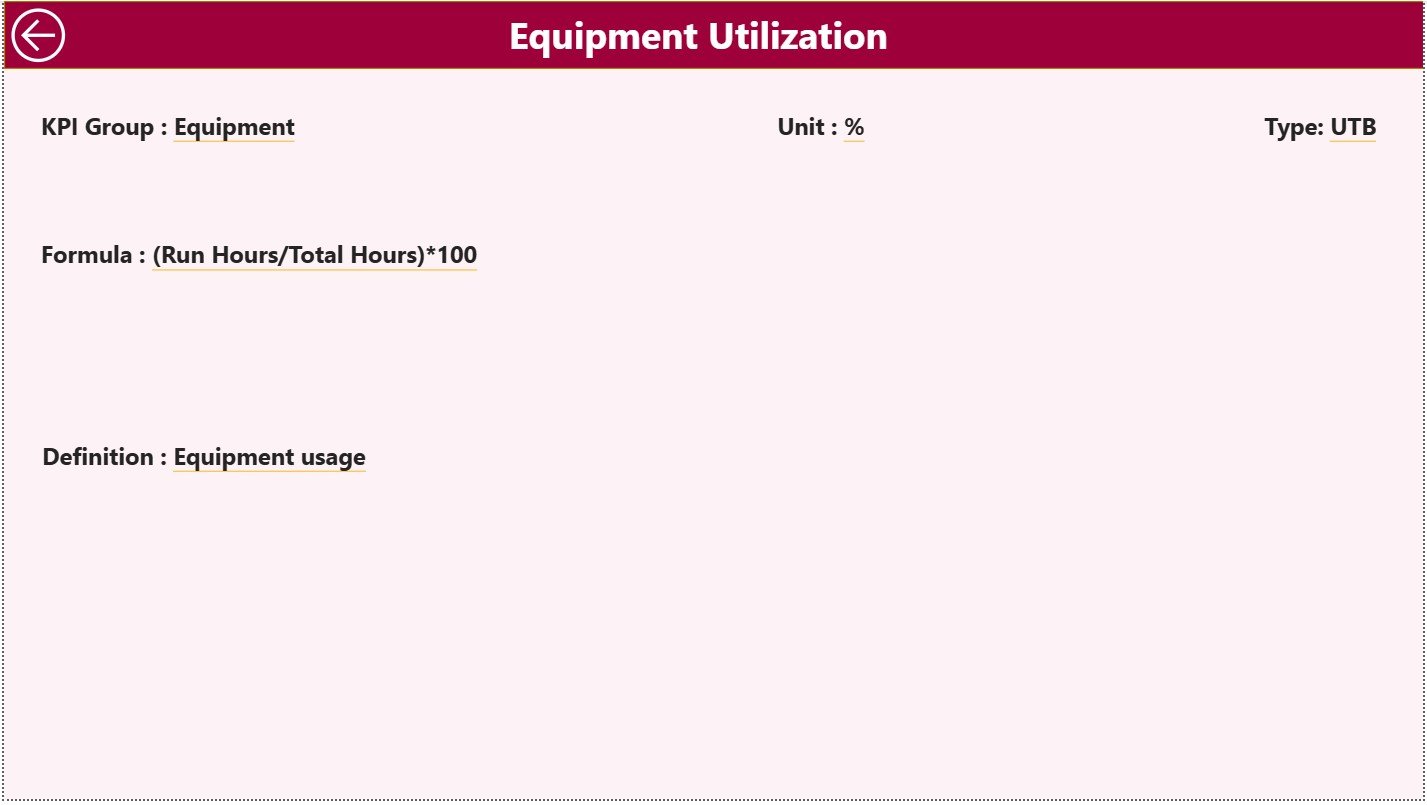
🔍 Drill-Through KPI Insights
Open the KPI Definition Page to see formula, definition, unit, KPI type (UTB/LTB), and detailed meaning for each KPI.
📥 Excel-Driven Workflow
Just update the Actual, Target, and Definition sheets in Excel—Power BI visuals refresh automatically.
🎨 Fully Editable & Customizable
Modify colors, themes, charts, icons, and layout to match your project reporting style.
📦 What’s Inside the Road and Highway Construction KPI Dashboard in Power BI
Your digital product includes everything required for complete performance monitoring:
✔ Power BI File (.pixy)
Ready-to-use dashboard with clean visuals and pre-built calculations.
✔ Excel Input File (3 Structured Sheets)
-
Input Actual – Monthly actual performance
-
Input Target – Monthly & YTD targets
-
KPI Definition – KPI logic, formula, unit & type
✔ Three Interactive Dashboard Pages
1️⃣ Summary Page – Overall KPIs, cards, table view, target comparison
2️⃣ KPI Trend Page – CY vs PY trend charts
3️⃣ KPI Definition Page – Drill-through KPI documentation
✔ User-Friendly Navigation
Built-in buttons, slicers, and clean formatting for smooth usage.
✔ Automated Formulas
Includes MTD%, YTD%, CY vs PY%, Actual vs Target calculations.
🛠 How to Use the Road and Highway Construction KPI Dashboard in Power BI
Using the dashboard is simple, fast, and beginner-friendly:
➤ Step 1: Update the Excel Input File
Enter monthly Actuals, Targets, and KPI Definitions.
➤ Step 2: Open Power BI Desktop
The dashboard is already connected to the Excel sheets.
➤ Step 3: Click “Refresh”
Power BI instantly loads updated values into charts and tables.
➤ Step 4: Use Slicers to Analyze KPIs
Filter KPIs based on month or category to focus on specific areas.
➤ Step 5: View Trend Charts
Review MTD and YTD performance trends to identify patterns.
➤ Step 6: Drill Through for KPI Details
View formula, definition, and type to understand KPI meaning clearly.
This workflow eliminates manual reporting and gives you clean, updated visuals every time.
👥 Who Can Benefit from This Road and Highway Construction KPI Dashboard
This dashboard is ideal for every team involved in road and highway construction:
🚧 Construction Project Managers
Monitor daily and monthly project performance at a glance.
🏗 Contractors & EPC Companies
Track resource usage, progress, and contractor productivity.
🏢 Government Departments & Municipal Authorities
Ensure compliance, transparency, and timely project delivery.
📊 Project Management Consultants (PMC)
Use real-time data for audits, reviews, and assessments.
🛠 Site Engineers & Execution Teams
Track material usage, equipment efficiency, and daily progress.
⚙ Quality & Safety Teams
Monitor safety KPIs, inspection scores, and compliance indicators.
💰 Finance & Cost Control Teams
Track cost-related KPIs, productivity, and budget adherence.
If you work with construction KPIs, this dashboard will completely transform how you monitor performance.


Reviews
There are no reviews yet.