


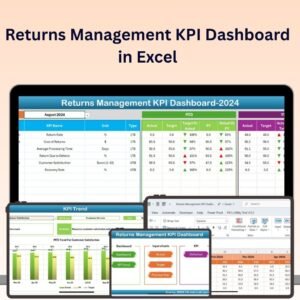
The Returns Management KPI Dashboard in Excel is a comprehensive tool designed to help businesses track, analyze, and optimize their product return processes. Whether you’re managing a retail store, an e-commerce business, or a wholesale operation, this Excel-based dashboard enables you to monitor key performance indicators (KPIs) like return rates, return reasons, customer satisfaction, and financial impact, helping you streamline your returns process and reduce associated costs.
With real-time data tracking, visual reports, and customizable metrics, this dashboard ensures that you can efficiently manage returns, identify trends, and improve your customer service while minimizing the impact of returns on your bottom line.

Key Features of the Returns Management KPI Dashboard in Excel:
🔄 Returns Rate Monitoring
Track the percentage of returns relative to total sales to evaluate the overall effectiveness of your product quality and customer satisfaction efforts.
💡 Return Reasons Analysis
Analyze common reasons for returns, such as product defects, size issues, or customer dissatisfaction, to identify areas for improvement in product offerings and customer service.
📈 Financial Impact Tracking
Monitor the cost of returns, including shipping, restocking, and product refurbishing, to assess the financial impact on your business and optimize your returns strategy.
🛠 Customer Satisfaction Tracking
Measure customer satisfaction with the return process, including return speed, ease of processing, and the quality of customer service, to ensure that returns are handled effectively.
💬 Return Process Efficiency
Evaluate how efficiently your returns process is operating, from the initiation of the return to restocking or disposal, ensuring minimal disruption to operations.
🚀 Why You’ll Love the Returns Management KPI Dashboard in Excel:
✅ Track Return Rates – Monitor the percentage of returned items relative to total sales to assess product quality and identify trends that may be impacting return volumes.
✅ Optimize Returns Process – Analyze reasons for returns to identify actionable insights that improve product quality, descriptions, and customer expectations.
✅ Measure Financial Impact – Track the cost of returns and the associated impact on your business’s bottom line, enabling you to optimize your return policies and reduce expenses.
✅ Enhance Customer Experience – Ensure a smooth and customer-friendly returns process by tracking customer satisfaction and providing top-notch service during returns.
✅ Customizable and Easy-to-Use – This Excel dashboard is simple to use and fully customizable to suit your specific returns management needs.
✅ Data-Driven Insights – Use real-time data to make informed decisions about product offerings, return policies, and customer service improvements.
What’s Inside the Returns Management KPI Dashboard in Excel:
- Returns Rate Tracking: Track the total number of returns and the percentage of returns relative to overall sales, allowing you to monitor performance over time.
- Return Reasons Analysis: Break down returns by reason (e.g., product defects, sizing issues, dissatisfaction) to identify patterns and improve product offerings.
- Cost Tracking: Monitor costs related to returns, such as shipping fees, restocking fees, and refunds, to ensure financial efficiency.
- Customer Satisfaction Metrics: Track feedback and satisfaction ratings related to the returns process to ensure that your return policy meets customer expectations.
- Return Process Efficiency: Analyze the time it takes to process returns and the steps involved, identifying bottlenecks and inefficiencies in the return process.
- Custom Reports and Dashboards: Generate custom reports that summarize return-related KPIs and share insights with stakeholders or management.
How to Use the Returns Management KPI Dashboard in Excel:
1️⃣ Download the Template – Instantly access your Excel file upon purchase.
2️⃣ Enter Return Data – Input data such as return reasons, return volumes, and financial impact into the dashboard.
3️⃣ Track Key Metrics – Monitor important KPIs like return rates, reasons for returns, and financial costs associated with returns.
4️⃣ Analyze Trends – Use visual charts to analyze trends in return reasons, customer satisfaction, and return rates over time.
5️⃣ Generate Reports – Create customized reports to present findings and insights to stakeholders, helping to optimize your returns process.
Who Can Benefit from the Returns Management KPI Dashboard in Excel:
- Retail Businesses
- E-commerce Stores
- Wholesale Operations
- Inventory Managers
- Customer Service Teams
- Product Managers
- Financial Analysts
- Business Owners
The Returns Management KPI Dashboard in Excel is the ideal solution for any business looking to streamline its returns process, minimize costs, and improve customer satisfaction. By providing valuable insights into the returns process, it helps you optimize your operations and drive business growth.
Click here to read the Detailed blog post
https://www.pk-anexcelexpert.com/returns-management-kpi-dashboard-in-excel/
Visit our YouTube channel to learn step-by-step video tutorials
Youtube.com/@PKAnExcelExpert


Reviews
There are no reviews yet.