
Managing a retail supply chain without real-time visibility often leads to delays, rising costs, stockouts, and unhappy customers. Retail businesses deal with procurement, inventory, warehousing, logistics, and store replenishment every single day. Retail Supply Chain KPI Dashboard in Excel However, when performance tracking depends on scattered Excel files and manual reports, inefficiencies quickly multiply.
Retail Supply Chain KPI Dashboard in Excel That is exactly why the Retail Supply Chain KPI Dashboard in Excel becomes a powerful and practical business solution 📊🚚.
This ready-to-use Excel dashboard converts raw supply chain data into clear, structured, and actionable insights. Instead of reviewing multiple reports, retail teams can monitor Month-to-Date (MTD) and Year-to-Date (YTD) performance from one centralized dashboard. Because everything runs in Microsoft Excel, the dashboard remains flexible, affordable, and easy to use—without any advanced technical skills.
Designed specifically for retail supply chain operations, this dashboard helps organizations move from reactive problem-solving to proactive performance management.
⭐ Key Features of Retail Supply Chain KPI Dashboard in Excel
📊 Centralized Supply Chain Visibility
Track procurement, inventory, logistics, warehousing, and fulfillment KPIs in one dashboard.
📅 MTD & YTD Performance Tracking
Analyze short-term operational performance and long-term efficiency trends together.
🎯 Target vs Actual Comparison
Instantly identify gaps between planned targets and actual performance.
📈 Year-over-Year Performance Analysis
Compare current performance with previous year results to measure improvement.
🧭 Easy Navigation with Home Sheet
Quickly move between worksheets using a dedicated Home page with navigation buttons.
📉 Visual KPI Trends
Trend charts help identify bottlenecks, seasonality, and improvement opportunities early.
📦 What’s Inside the Retail Supply Chain KPI Dashboard in Excel
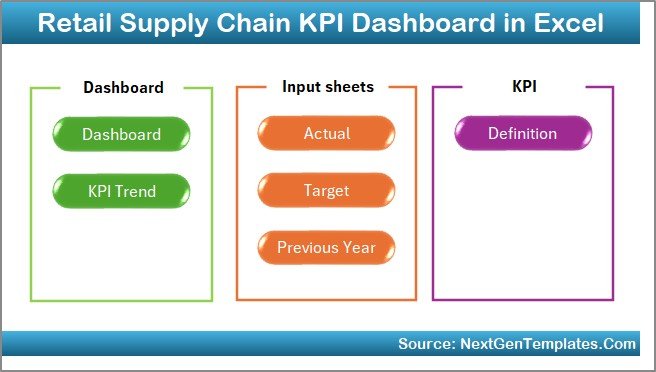
This professionally designed Excel workbook includes seven well-structured worksheets; each created for a specific analytical purpose:
🏠 Home Sheet
Acts as a navigation index with buttons for instant access to all dashboard sections.
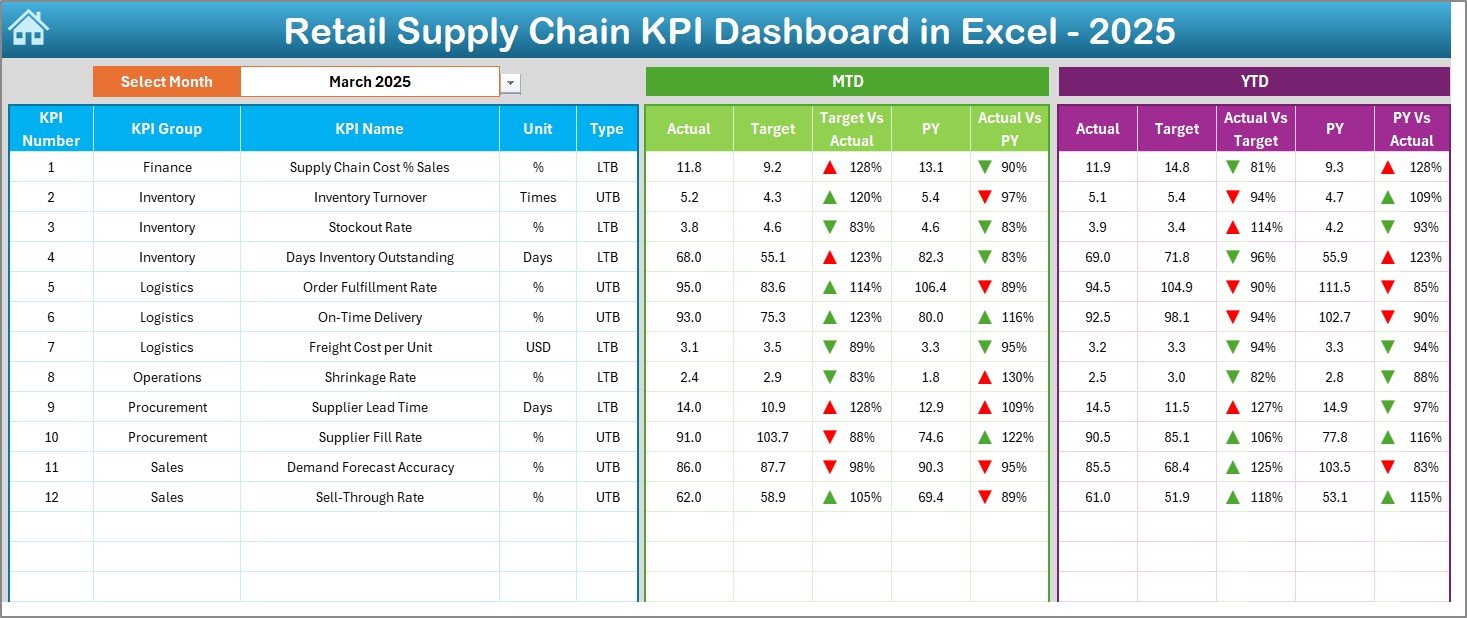
📊 Dashboard Sheet
The main KPI summary page displaying:
-
Month selection drop-down
-
MTD and YTD performance sections
-
Actual, Target, and Previous Year comparisons
-
Conditional formatting arrows for quick performance interpretation
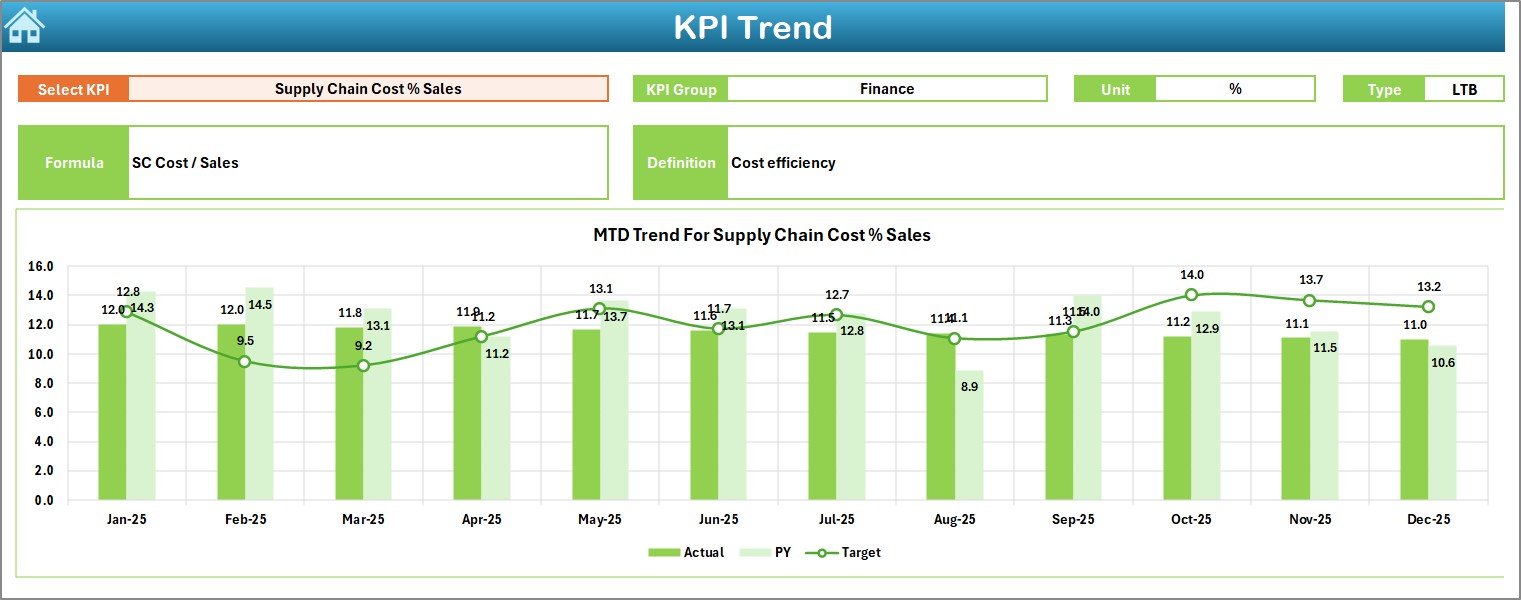
📈 KPI Trend Sheet
Provides detailed KPI-level analysis with:
-
KPI selection drop-down
-
KPI group, unit, type (LTB/UTB), formula, and definition
-
MTD and YTD trend charts comparing Actual, Target, and PY values
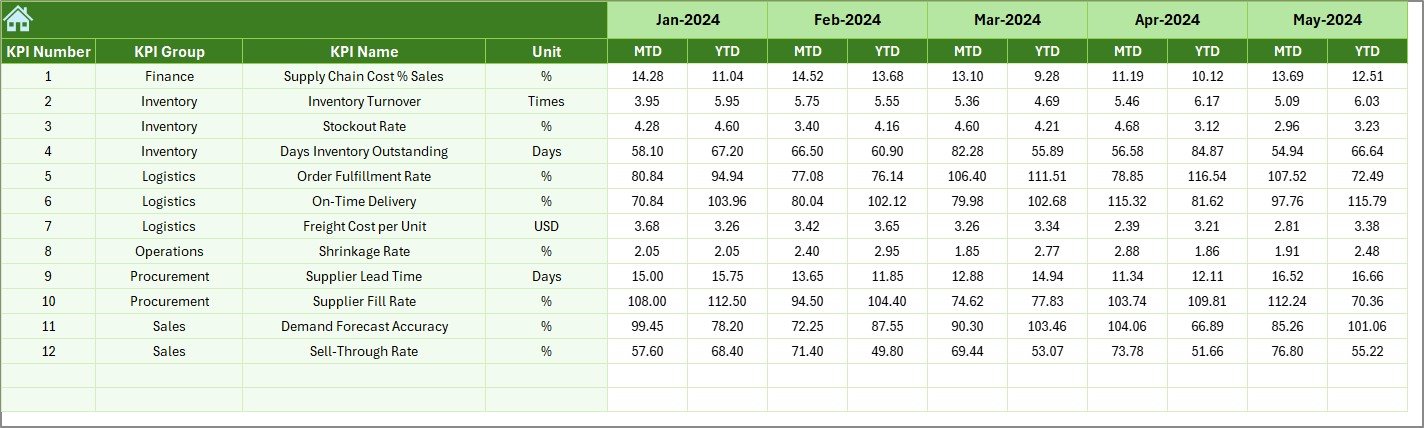
📝 Actual Numbers Input Sheet
Where users enter real MTD and YTD operational data.
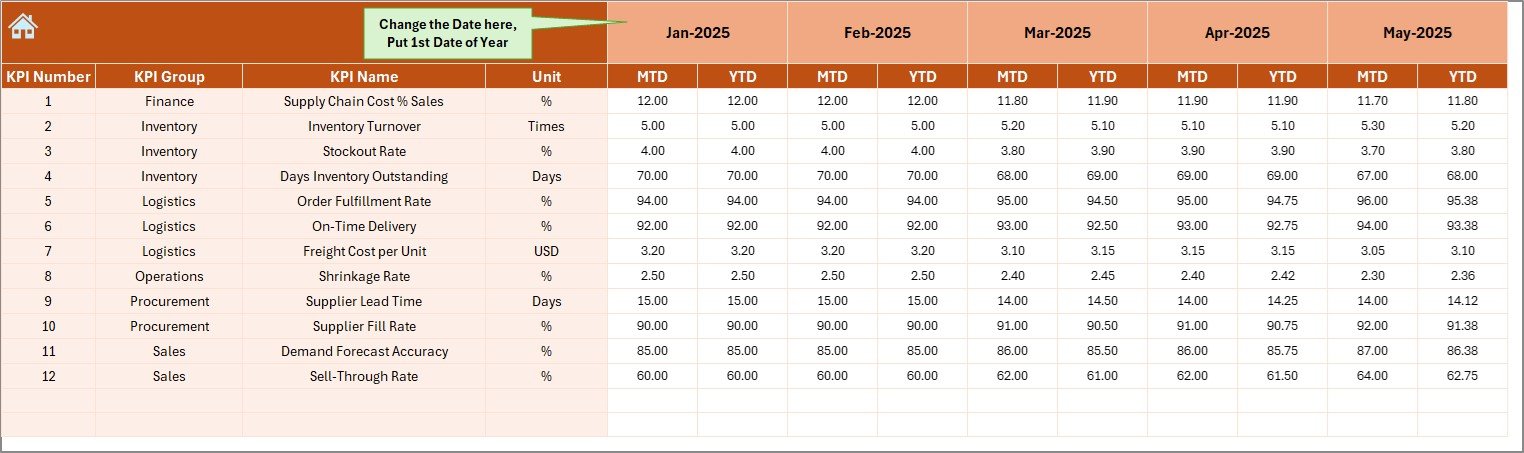
🎯 Target Sheet
Stores monthly and cumulative targets for all supply chain KPIs.
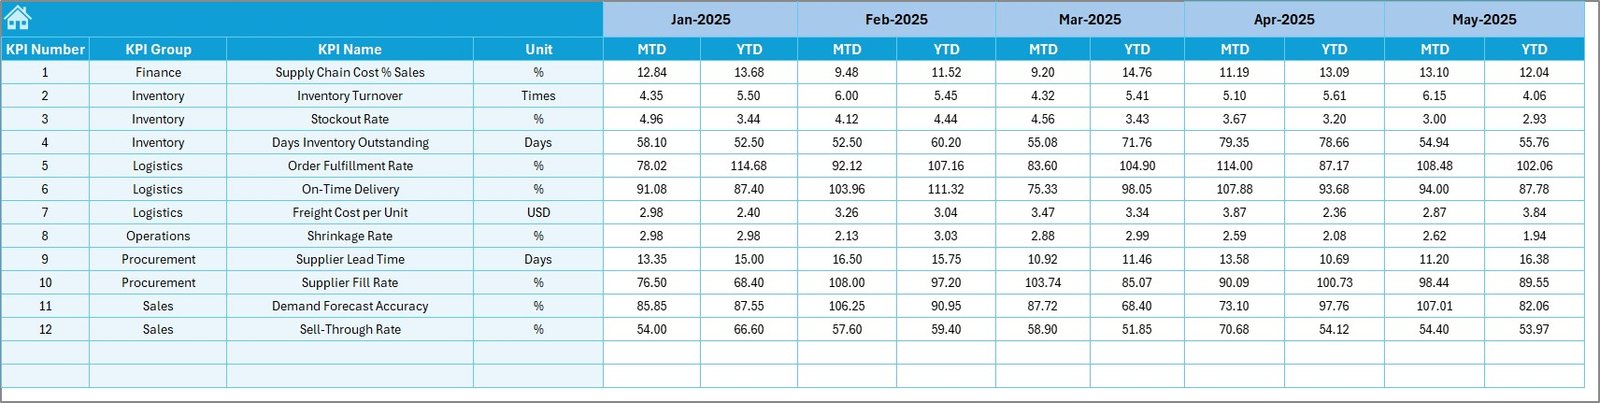
📅 Previous Year Number Sheet
Holds historical MTD and YTD values to support year-over-year comparison.
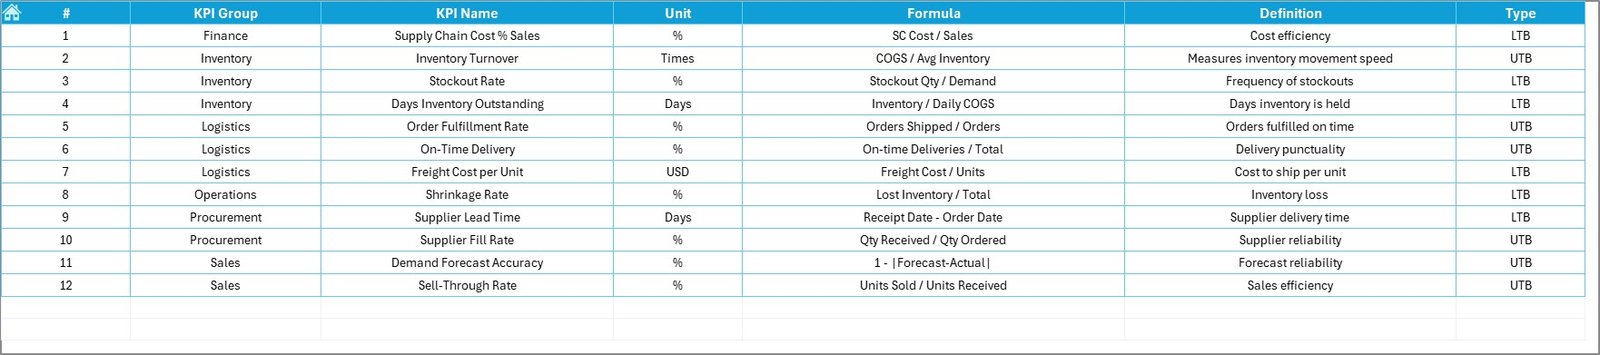
📘 KPI Definition Sheet
Documents KPI names, groups, units, formulas, and definitions to ensure consistency and clarity.
🛠️ How to Use the Retail Supply Chain KPI Dashboard in Excel
Using this dashboard is simple and efficient:
1️⃣ Enter actual performance data in the Actual Numbers sheet
2️⃣ Define KPI targets in the Target sheet
3️⃣ Add previous year values for comparison
4️⃣ Select the reporting month
5️⃣ Instantly view updated KPIs, trends, and performance indicators
Because calculations and visuals update automatically, teams save time and reduce reporting errors.
👥 Who Can Benefit from This Retail Supply Chain KPI Dashboard in Excel
This dashboard is ideal for:
🛒 Retail Supply Chain Managers
📦 Inventory & Demand Planners
🚚 Logistics & Warehouse Managers
📑 Procurement Teams
📊 Business Analysts
🏢 Retail Operations & Leadership Teams
Whether managing a single store or a multi-location retail network, this dashboard adapts to your operational needs.


Reviews
There are no reviews yet.