Running a retail business today requires more than intuition—it requires actionable insights. From sales and customer satisfaction to inventory and store operations, every decision impacts growth. The Retail KPI Scorecard in Excel is your all-in-one solution for tracking performance, aligning goals, and driving smarter decisions.
Instead of juggling scattered spreadsheets or manual reports, this scorecard consolidates all your retail KPIs into an interactive Excel dashboard. Designed with dropdowns, color-coded visuals, and automated updates, it delivers real-time insights that help you identify strengths, address weaknesses, and stay ahead of the competition.
✨ Key Features of the Retail KPI Scorecard
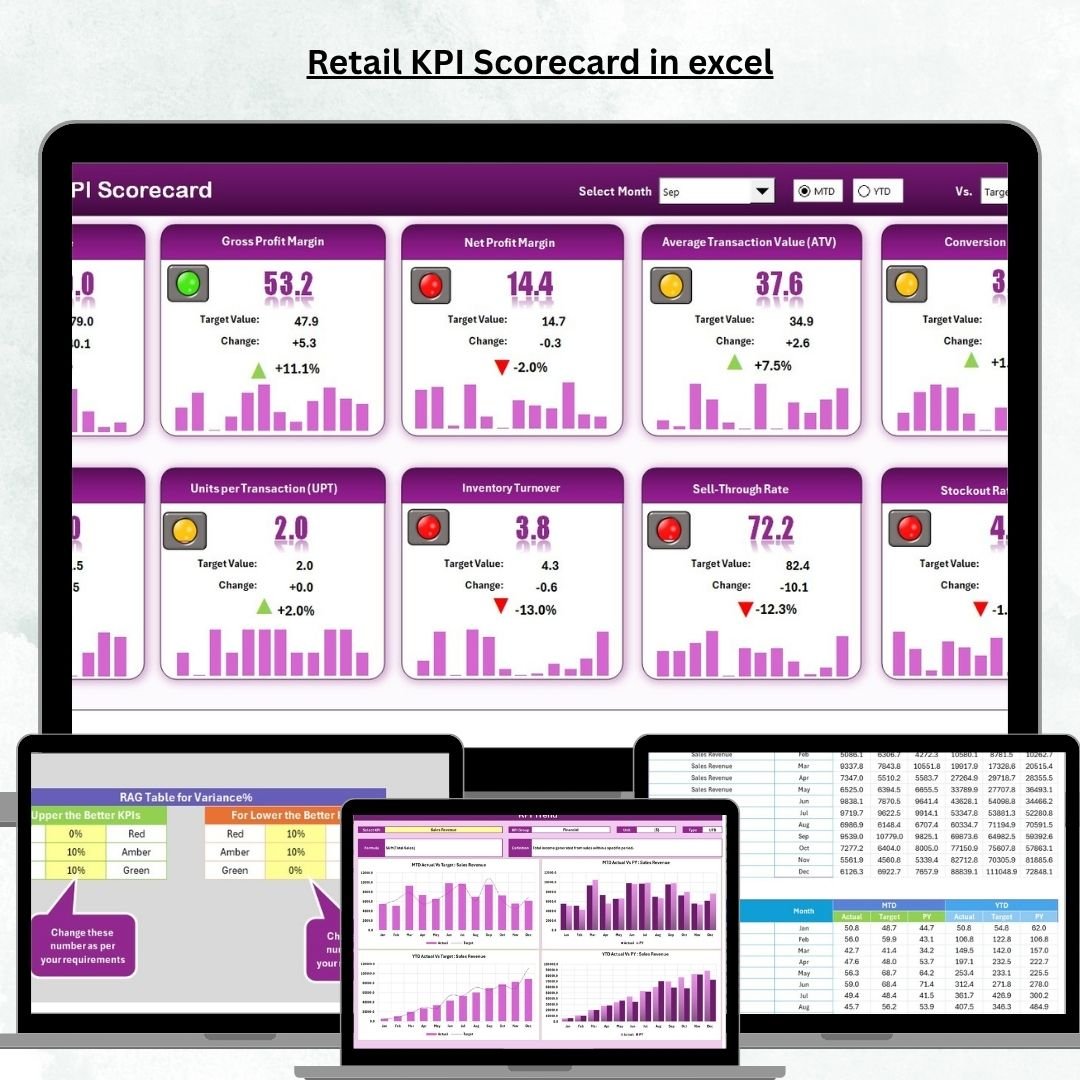
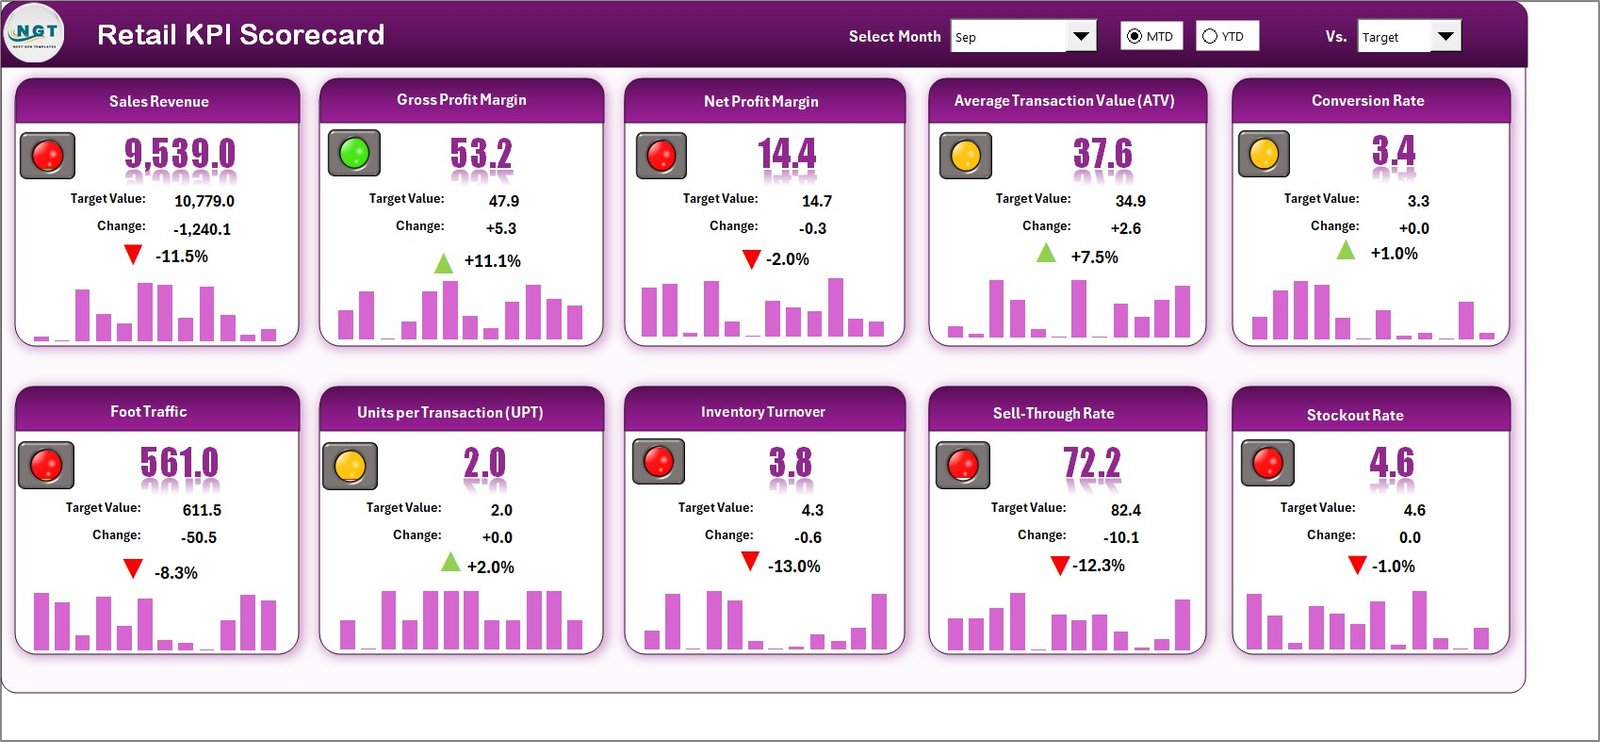
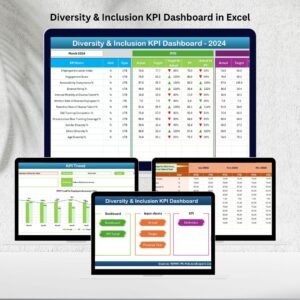
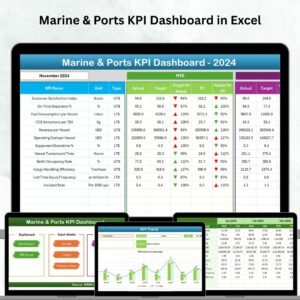
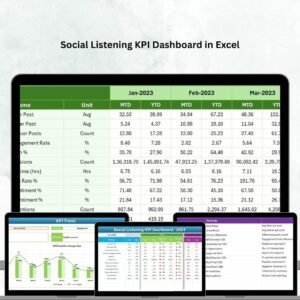
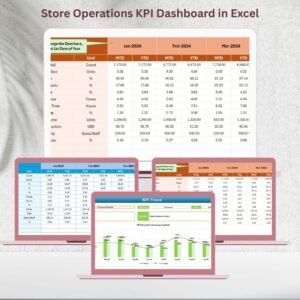
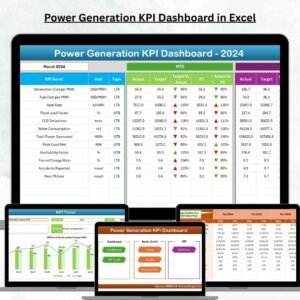
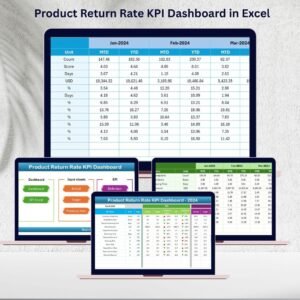
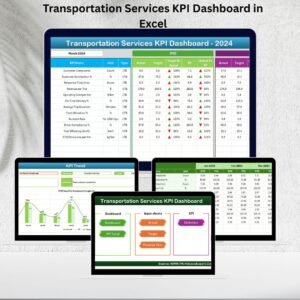
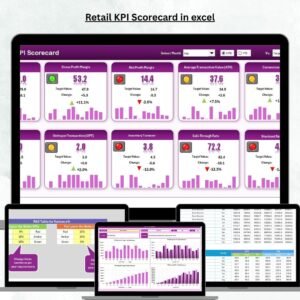
✅ Scorecard Dashboard – Quick overview of retail KPIs with dropdowns for MTD/YTD analysis, visual indicators, and instant actual vs. target comparisons.
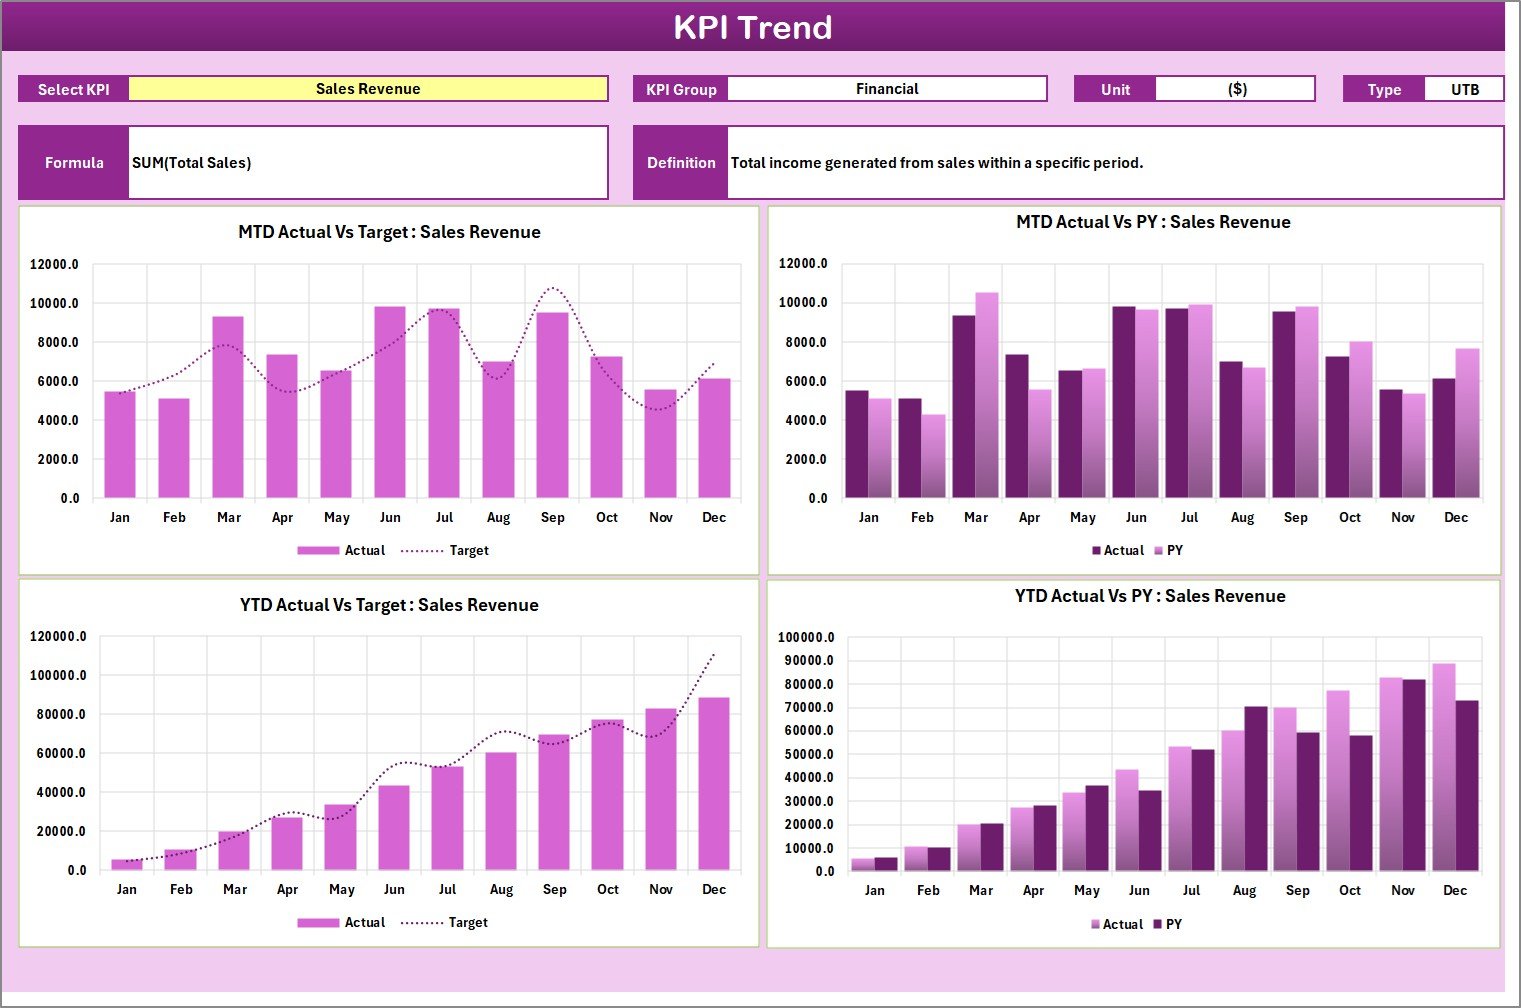
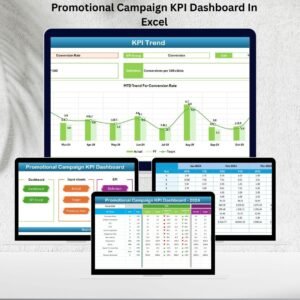
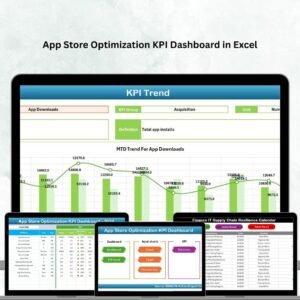
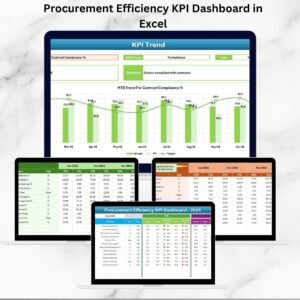
✅ KPI Trend Sheet – Select any KPI and track performance across months with interactive trend charts.
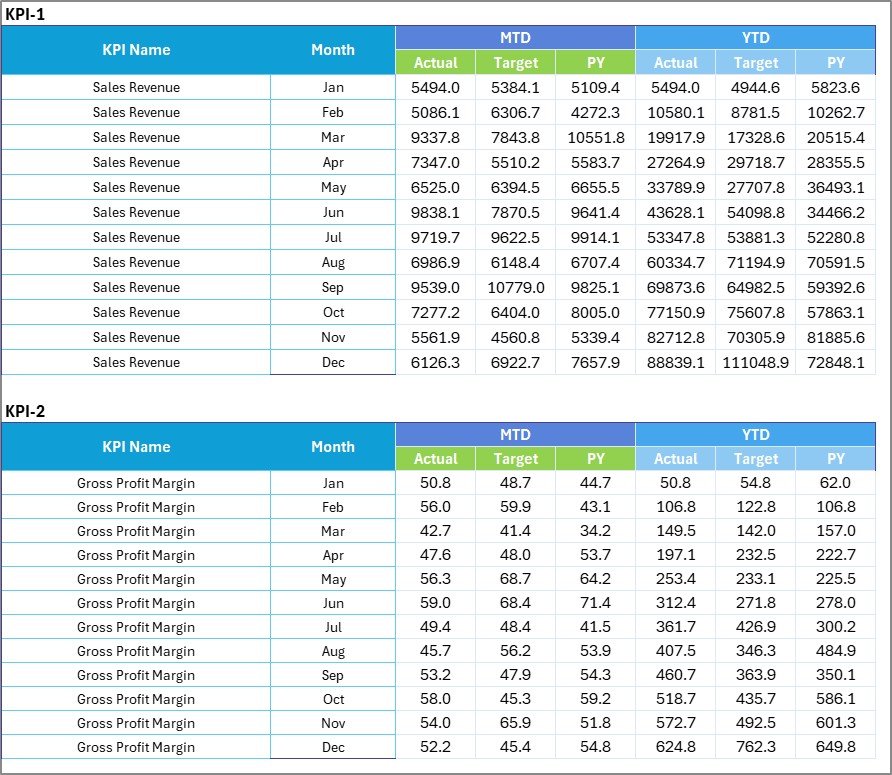
✅ Input Data Sheet – Centralized data entry hub where you record actuals, targets, and metrics. Updates instantly reflect on dashboards.
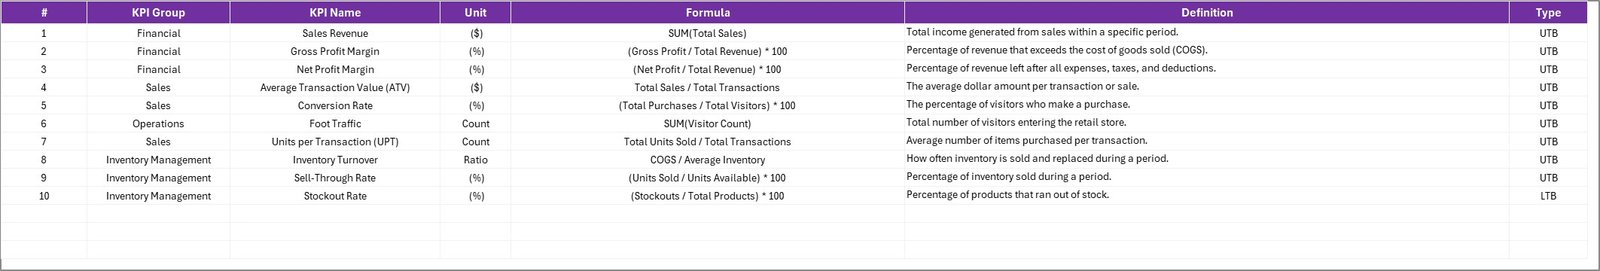
✅ KPI Definition Sheet – Standardized KPI library with definitions, formulas, and units for clarity across teams.
✅ Color-Coded Insights – Red, yellow, and green highlights for fast performance checks.
✅ Automation Ready – Linked formulas eliminate manual errors and ensure consistency.
✅ Scalable – Works seamlessly whether you’re managing a single shop or a chain of stores.
✅ Customizable – Add, remove, or edit KPIs and charts to fit your unique business model.
📂 What’s Inside the Retail KPI Scorecard
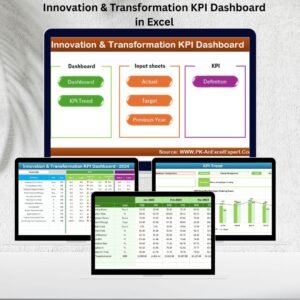
This Excel-based tool comes with four integrated worksheets:
-
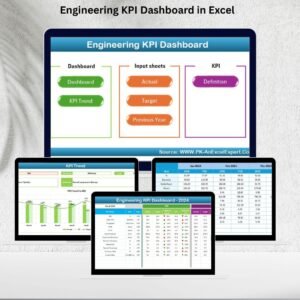
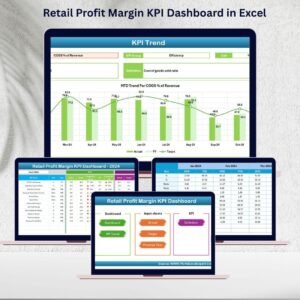
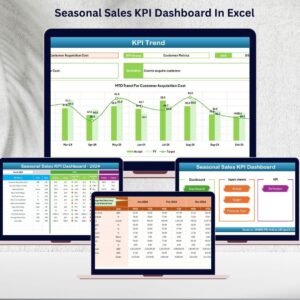
Scorecard Sheet 📊 – The main dashboard featuring dropdown menus, KPI cards, visual indicators, and MTD/YTD comparisons.
-
KPI Trend Sheet 📈 – Analyze performance trends with combo charts for Actual, Target, and Previous Year values.
-
Input Data Sheet 📝 – Record raw metrics, actual results, and targets. The backbone of your reporting system.
-
KPI Definition Sheet 📖 – A structured reference sheet ensuring consistency and eliminating confusion across stores and teams.
🛠️ How to Use the Retail KPI Scorecard
-
Enter Data – Update the Input Data sheet with actuals, targets, and PY values.
-
Review Dashboard – Instantly view updated Scorecard with visual performance indicators.
-
Analyze Trends – Select KPIs in the Trend Sheet to identify seasonal patterns or recurring issues.
-
Refer to Definitions – Ensure standardized understanding of metrics through the KPI Definition Sheet.
-
Take Action – Use insights to optimize inventory, enhance customer experience, and drive sales growth.
👥 Who Can Benefit from This Scorecard?
🛒 Supermarkets – Track basket size, shrinkage, and footfall.
🏬 Department Stores – Monitor staff efficiency, promotions, and category sales.
🛍️ E-commerce Retailers – Evaluate conversion rates, returns, and average order value.
☕ Restaurants & Cafes – Track table turnover, delivery times, and customer satisfaction.
👗 Fashion Retail – Manage markdowns, inventory turnover, and omni-channel sales.
📈 Franchise Chains – Standardize KPIs across multiple locations.


Reviews
There are no reviews yet.