Running a restaurant or food service business isn’t just about serving great meals—it’s about managing operations, finances, customer satisfaction, and employee performance. Without proper tracking, decisions are often made on guesswork, which can hurt growth. That’s why you need the Restaurants & Food Services KPI Dashboard in Excel—a ready-to-use performance monitoring tool designed to give you clarity, control, and confidence.
This Excel-based dashboard helps restaurant owners, managers, and teams track Month-to-Date (MTD) and Year-to-Date (YTD) KPIs, compare them against targets, and evaluate performance versus previous years. With its interactive sheets, charts, and conditional formatting, it becomes a one-stop solution for smarter decision-making.
Whether you run a small café, a food truck, or a large restaurant chain, this KPI Dashboard will help you measure performance, optimize costs, and boost customer satisfaction.
✨ Key Features of Restaurants & Food Services KPI Dashboard in Excel
-
📊 Centralized Dashboard – Track sales, customer satisfaction, operations, and employee performance in one place.
-
⏳ MTD & YTD Insights – Instantly compare results with targets and last year’s performance.
-
📈 Trend Analysis – Visualize KPI progress with clear, dynamic charts.
-
✔ Conditional Formatting – Red/green arrows highlight performance gaps and achievements.
-
📂 Structured Worksheets – Separate tabs for Actuals, Targets, Previous Year, KPI Definitions, and Trends.
-
🎯 Customizable – Add or remove KPIs based on your restaurant’s needs.
-
💡 User-Friendly – Designed for managers and staff with basic Excel skills.
-
💸 Cost-Effective – No expensive software required—works in Excel.
📦 What’s Inside the Restaurants & Food Services KPI Dashboard
This template is organized into seven interactive sheets, each with a unique purpose:

-
Home Sheet – Index page with navigation buttons for smooth access.
-
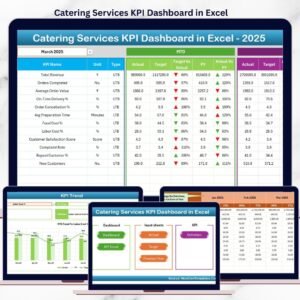
Dashboard Sheet – Main reporting hub with MTD & YTD comparisons.
-
KPI Trend Sheet – Analyze trends for any KPI with charts.
-
Actual Numbers Sheet – Enter monthly performance data.
-
Target Sheet – Define monthly and yearly targets.
-
Previous Year Sheet – Compare with historical performance.
-
KPI Definition Sheet – Store KPI formulas, groups, and definitions for reference.
🛠 How to Use the Restaurants & Food Services KPI Dashboard
-
Enter Actuals – Record monthly sales, costs, and performance numbers.
-
Set Targets – Define business goals in the Target sheet.
-
Compare vs Previous Year – Track YoY growth and patterns.
-
Review Dashboard – Use interactive charts for quick insights.
-
Analyze Trends – Spot areas of improvement using KPI Trend charts.
-
Take Action – Adjust staffing, inventory, or promotions based on insights.
With just a few updates, you’ll have a professional-grade dashboard at your fingertips.
👥 Who Can Benefit from This Restaurants & Food Services KPI Dashboard
-
🍽 Restaurant Owners & Managers – Monitor financial, operational, and service KPIs.
-
☕ Cafés & Coffee Shops – Track daily sales, customer satisfaction, and staff productivity.
-
🍔 Fast Food Chains – Measure order accuracy, drive-thru times, and repeat customer rates.
-
🍷 Fine Dining – Monitor table turnover, occupancy, and menu performance.
-
🚚 Food Trucks & Catering – Analyze sales by event, location, or menu items.
-
📊 Hospitality Consultants – Use as a reporting tool for clients.
If you want to run your restaurant with precision and data-driven decisions, this dashboard is for you.
📖 Click here to read the Detailed blog post
Visit our YouTube channel to learn step-by-step video tutorials






Reviews
There are no reviews yet.