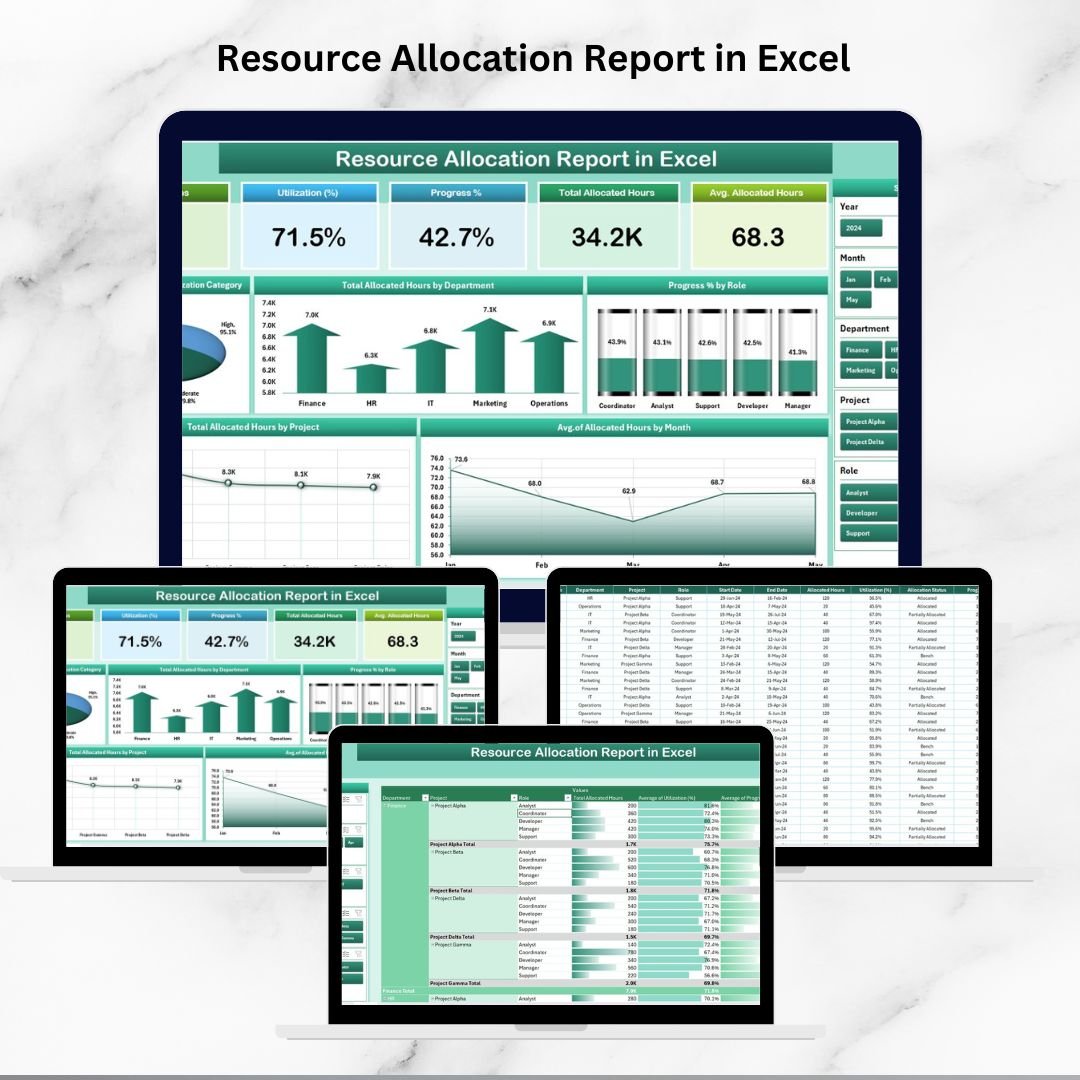
Managing people, skills, and time is one of the most critical challenges in modern organizations. Whether you’re overseeing a small team or handling multiple large-scale projects, ensuring that resources are optimally allocated is key to boosting efficiency and reducing costs. That’s why we created the Resource Allocation Report in Excel—a ready-to-use, interactive solution for smarter decision-making.
This Excel-based tool helps you track utilization, spot under- or over-allocation, and plan workloads with confidence. With its easy-to-use dashboards, slicers, and detailed reports, you can transform scattered data into clear, actionable insights.
✨ Key Features of Resource Allocation Report in Excel
-
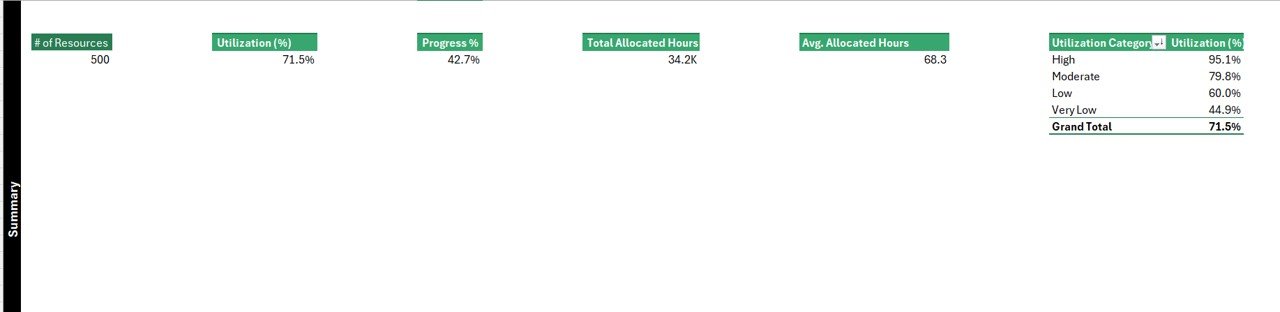
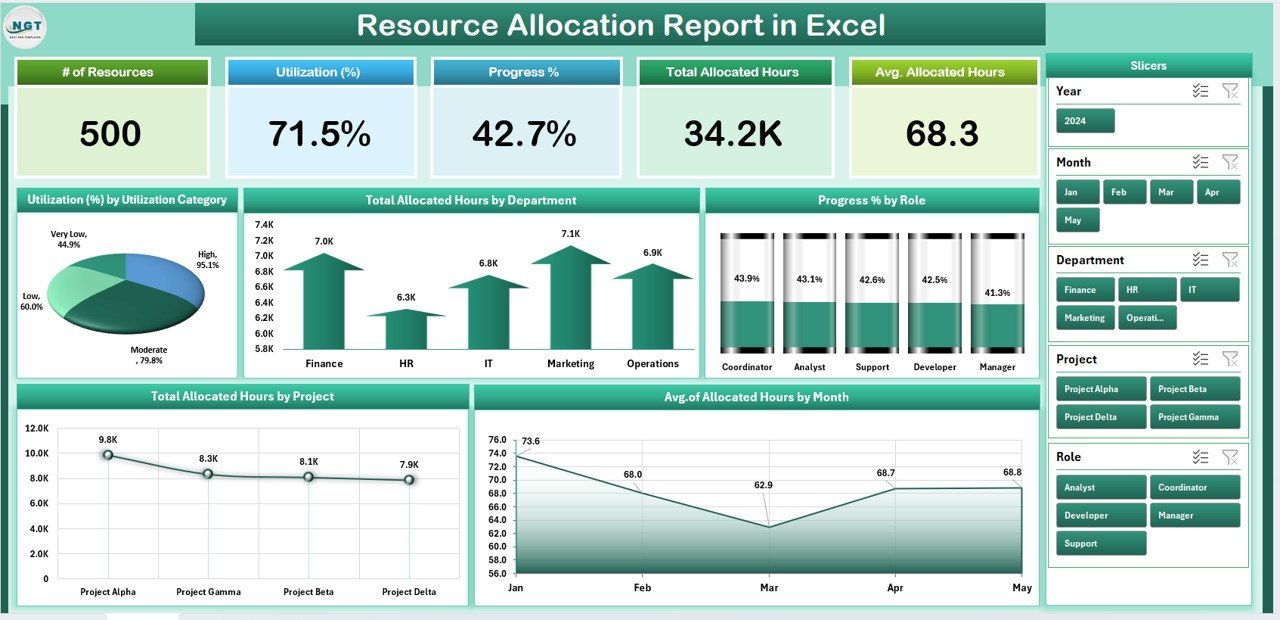
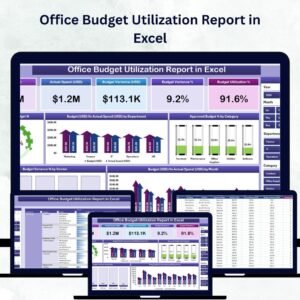
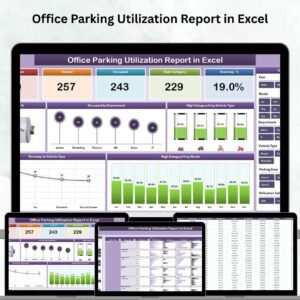
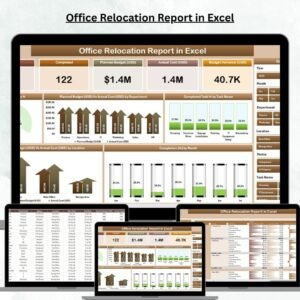
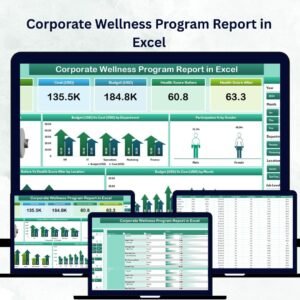
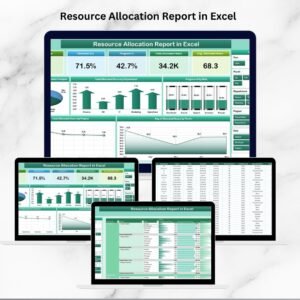
📊 Summary Dashboard – Cards and charts show allocation hours, utilization %, projects count, and role progress.
-
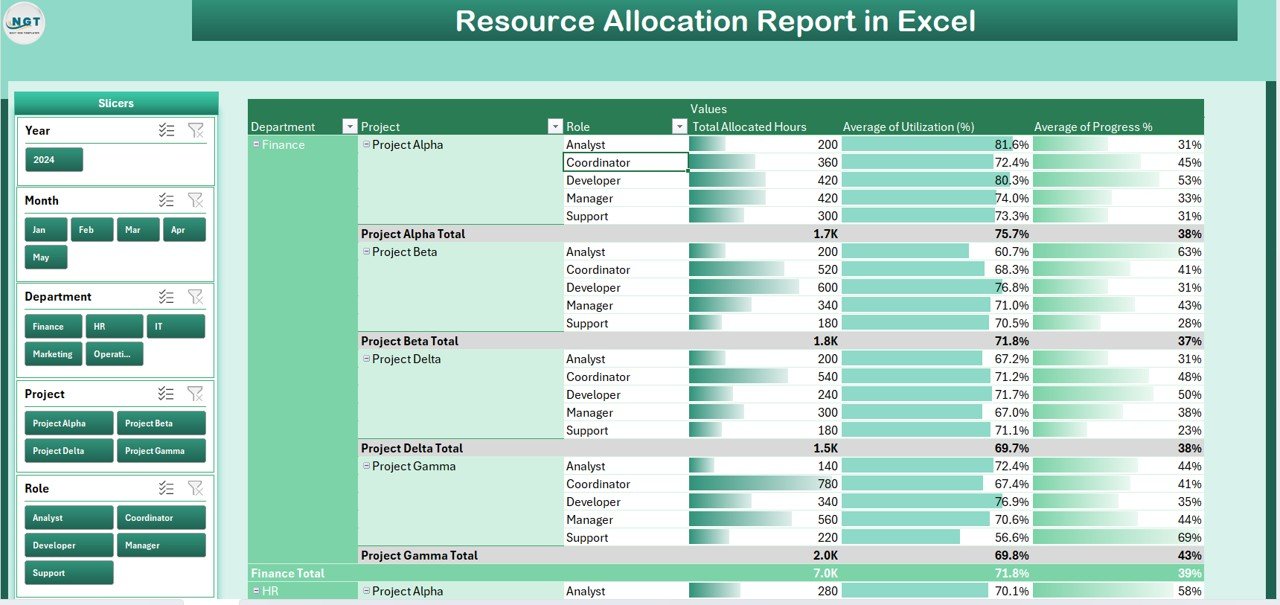
🎯 Interactive Slicers – Filter data by project, department, role, or timeframe instantly.
-
📑 Detailed Report Page – Tabular insights break down hours by employee, role, or department.
-
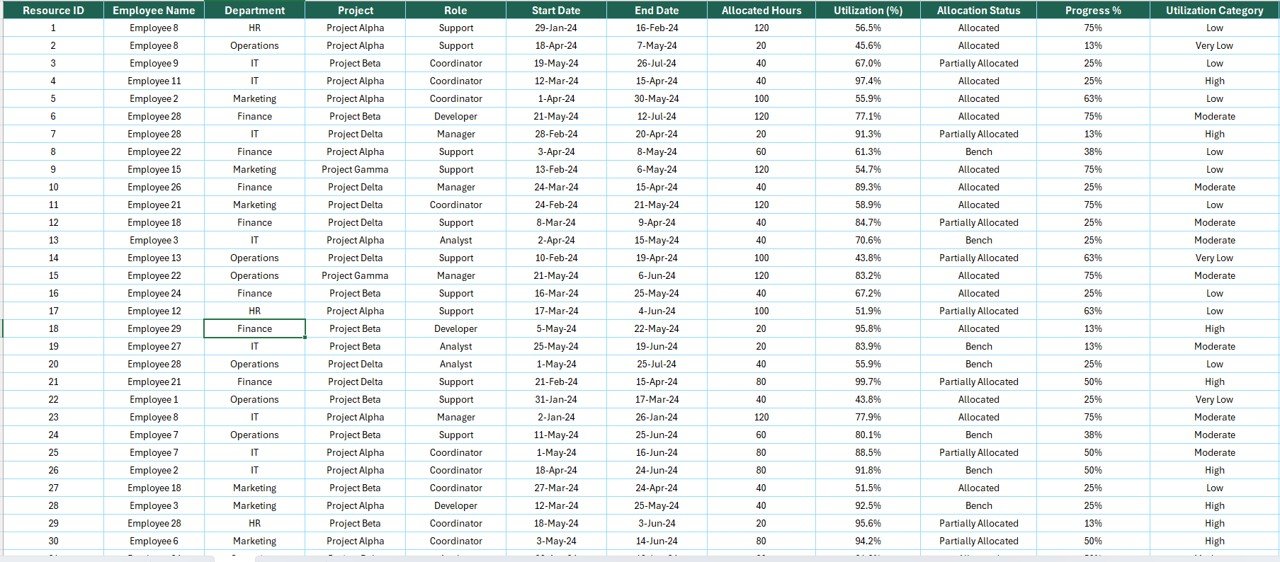
🗂 Data Sheet – Centralized place to input actual hours and assignments.
-
⚙ Support Sheet – Includes reference lists for departments, projects, roles, and utilization categories.
-
🚦 Visual Insights – Charts highlight bottlenecks, trends, and workload imbalances.
-
🔄 Auto-Refresh – Update raw data once, and all dashboards adjust automatically.
-
💰 Cost-Effective – No expensive project management software—Excel does the job.
📂 What’s Inside the Resource Allocation Report
-
Summary Page – The main hub with 5 KPI cards, slicers, and charts for quick resource allocation insights.
-
Report Page – Detailed tables for managers who prefer granular data views.
-
Data Sheet – The raw data engine where allocation details are updated.
-
Support Sheet – Structured lists that keep data consistent and error-free.
📖 How to Use the Resource Allocation Report
-
Enter Data – Fill the Data Sheet with hours, project info, departments, and roles.
-
Explore the Summary – Use slicers to analyze allocation by project, department, or role.
-
Dive into the Report Page – Access detailed tables for in-depth analysis.
-
Update Regularly – Refresh data weekly or monthly to maintain accurate reports.
-
Act on Insights – Reallocate staff, balance workloads, and forecast requirements.
👥 Who Can Benefit from This Report?
-
🏢 Project Managers – Track team workloads and spot over-allocation.
-
🧑💼 Department Heads – Ensure fair workload distribution.
-
👥 HR Teams – Monitor utilization and support workforce planning.
-
📊 Executives – Gain a big-picture view of resource efficiency.
-
🛠 Any Organization – From IT and construction to healthcare and education.
This report is designed to save time, reduce costs, and maximize team potential.


Reviews
There are no reviews yet.