The Renewable Energy KPI Scorecard in Excel is a must-have tool for energy companies, sustainability teams, and analysts aiming to track and optimize performance across solar, wind, hydro, or hybrid energy projects 🌎⚡. Built with precision and simplicity in mind, this Excel-based scorecard transforms raw data into visual insights — helping you make smarter, faster, and greener decisions.
Say goodbye to complex software or scattered spreadsheets — this one-stop solution brings clarity to every performance metric, empowering you to monitor production, cost efficiency, and environmental impact with ease.
⚡ Key Features of Renewable Energy KPI Scorecard in Excel
✅ Interactive Performance Dashboard: Instantly visualize Month-to-Date (MTD) and Year-to-Date (YTD) performance with dropdowns and slicers.
✅ Actual vs Target Analysis: Compare goals vs results to identify areas of improvement.
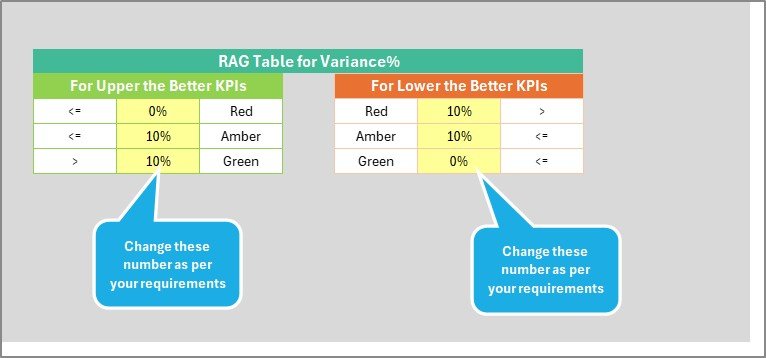
✅ Color-Coded Indicators: Quick performance overview with green (good), yellow (average), and red (underperforming) icons.
✅ Dynamic Trend Analysis: Monitor KPI trends over time through line charts and visual comparisons.
✅ Customizable KPI Setup: Add or edit KPIs, units, and formulas easily without coding.
✅ Data Transparency: KPI Definition Sheet explains every metric for better understanding.
✅ Department-Wise Insights: Evaluate KPIs across multiple regions, teams, or plants.
✅ Excel Compatibility: 100% Excel-based — no additional software required.
This scorecard helps renewable energy professionals move from manual reporting to intelligent analytics — all within a familiar Excel interface.
📘 What’s Inside the Renewable Energy KPI Scorecard
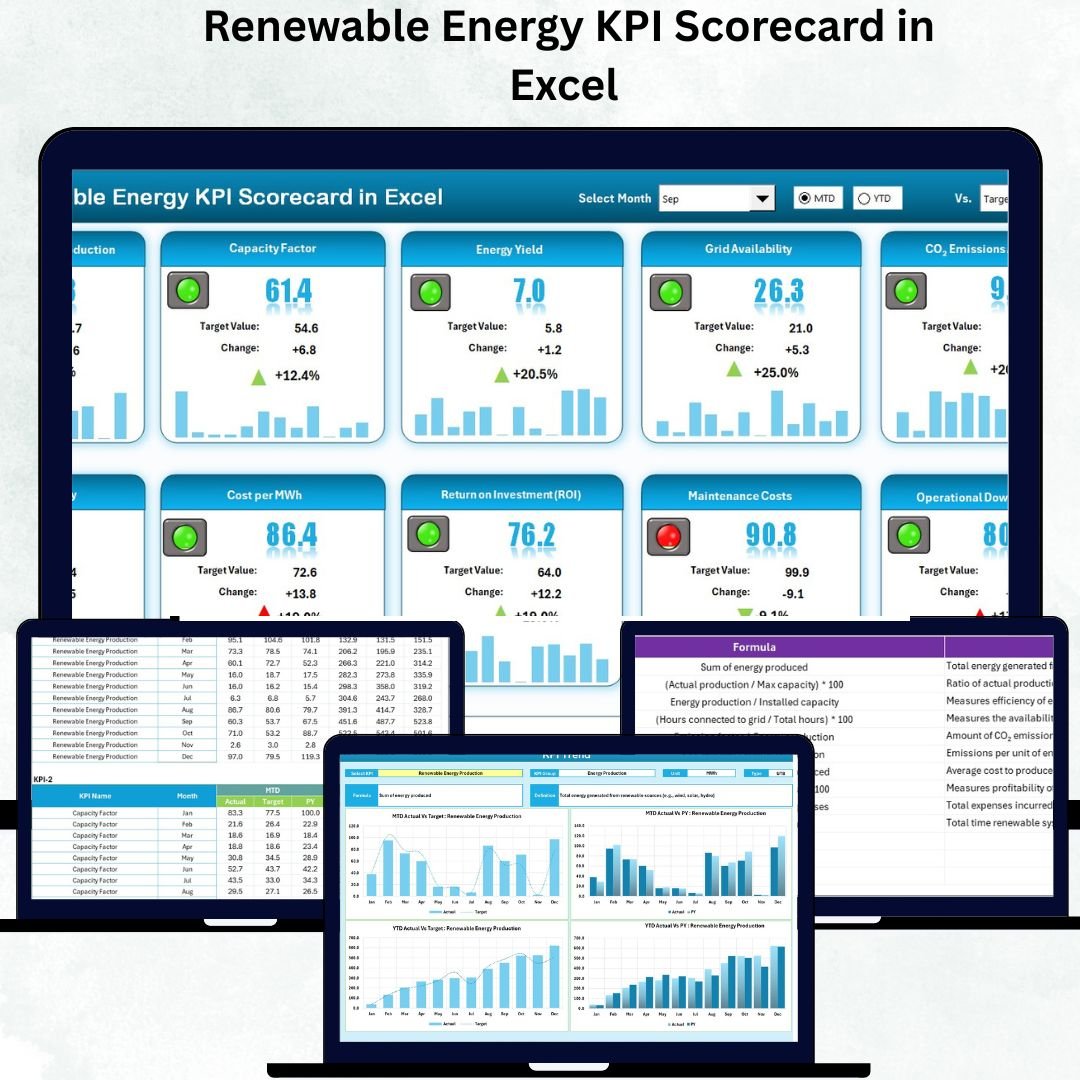
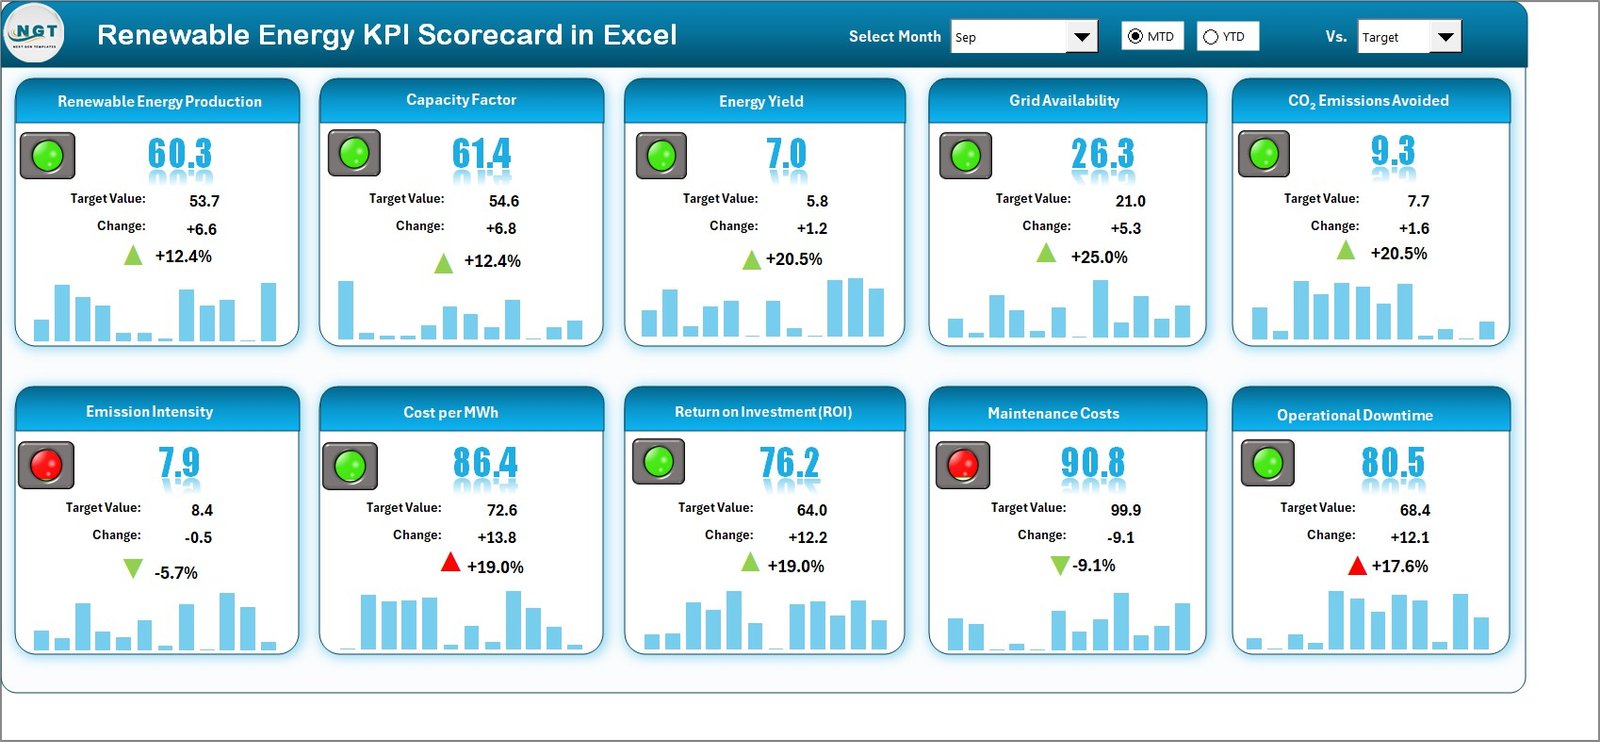
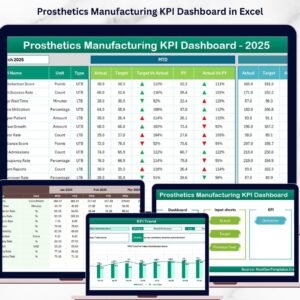
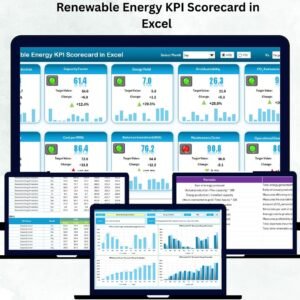
🧩 1. Scorecard Sheet (Main Dashboard):
Get a complete overview of your renewable energy KPIs — all in one page. Use dropdown menus to select the month and switch between MTD/YTD views.
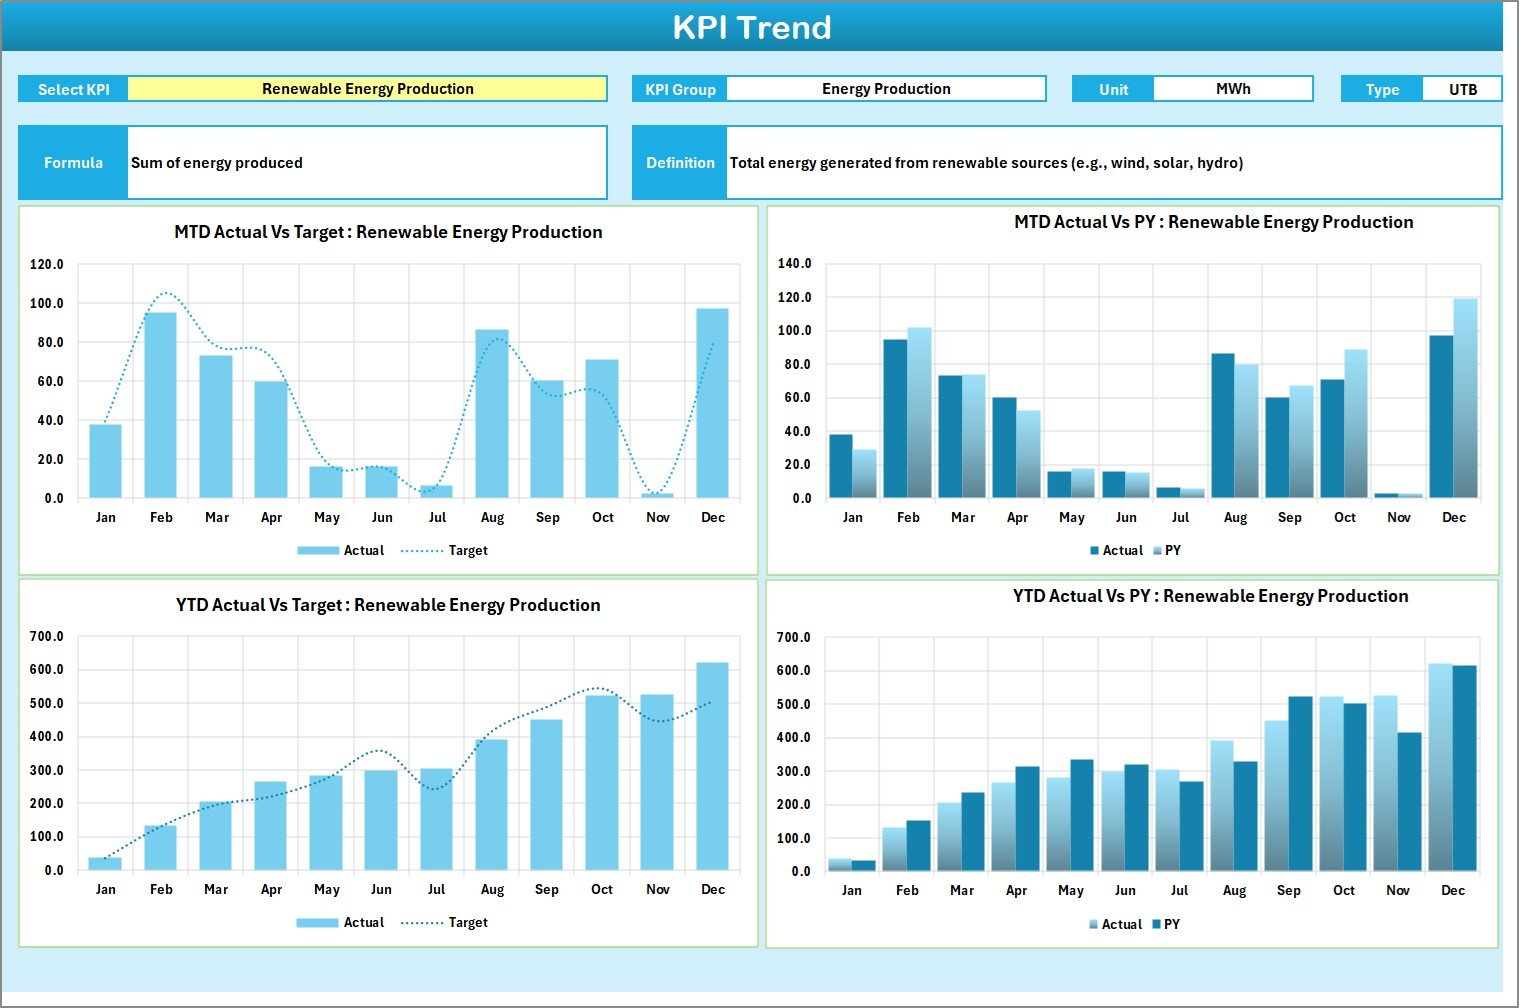
📈 2. KPI Trend Sheet:
Analyze monthly progress for each KPI using dynamic line charts and automated comparisons. Perfect for identifying upward or downward performance patterns.
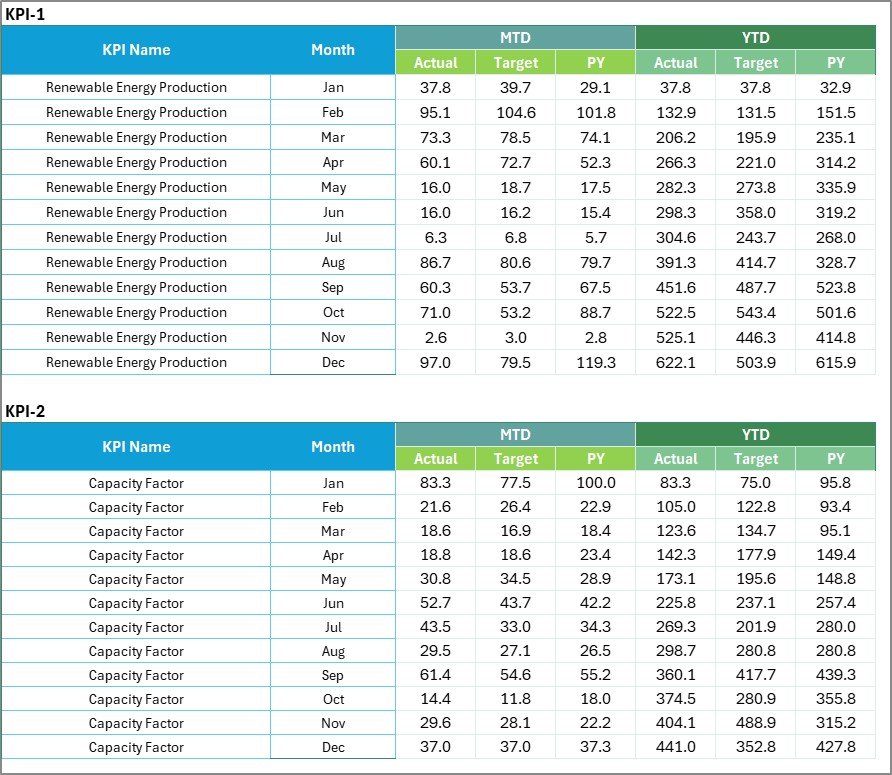
📊 3. Input Data Sheet:
Enter Actual, Target, and Previous Year values for every KPI in a structured format. You can import data automatically or link from other systems like ERP or SCADA.
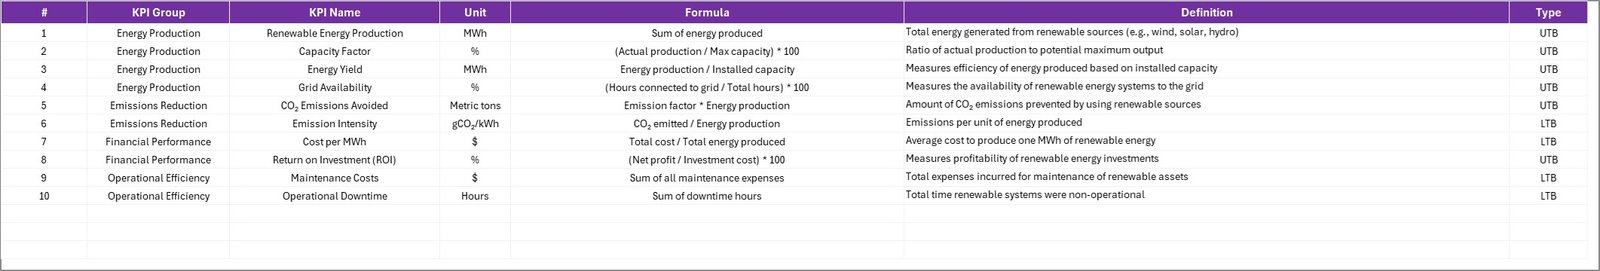
📘 4. KPI Definition Sheet:
Understand every KPI in detail — its formula, type (UTB/LTB), and definition. This ensures consistency and clarity across all reporting levels.
With these four sheets, your renewable energy operations are fully covered — from data collection to actionable insight.
⚙️ How to Use the Renewable Energy KPI Scorecard
1️⃣ Define your KPIs and update them in the KPI Definition Sheet.
2️⃣ Add monthly performance data in the Input Data Sheet.
3️⃣ Open the Scorecard Sheet to analyze the performance visually.
4️⃣ Use the KPI Trend Sheet to track progress over time.
5️⃣ Apply filters for MTD/YTD or department-wise views.
6️⃣ Review color indicators and take quick corrective actions.
That’s it — your renewable energy performance analysis is ready to go! 🚀
👥 Who Can Benefit from This Renewable Energy KPI Scorecard
🌞 Renewable Energy Companies: Track generation efficiency, cost, and sustainability performance.
🏭 Energy Plant Managers: Monitor output, downtime, and equipment performance across facilities.
🌍 Sustainability Teams: Measure carbon offset and ESG goals effortlessly.
📊 Financial Analysts: Review ROI, cost per kWh, and profitability trends.
🏢 Government & Regulatory Bodies: Ensure compliance and monitor clean energy progress.
💼 Consultants & Auditors: Provide clients with data-driven energy insights.
This template is ideal for organizations looking to streamline performance tracking and sustainability reporting — all without expensive software subscriptions.


Reviews
There are no reviews yet.